Experimental Psychology (Russia)
2019. Vol. 12, no. 4, 27–49
doi:10.17759/exppsy.2019120403
ISSN: 2072-7593 / 2311-7036 (online)
New approaches for assessing the activities of operators of complex technical systems
Abstract
Presented are new approaches for supporting the outcome grading for activities of operators of complex technical systems, which are based on comparisons of current exercises with the activity database patterns in both the wavelet representation metric associated with time series of activity parameters and the likelihood metric of eigenvalue trajectories for these parameters transforms as well as on probabilistic assessments of skill class recognition using sample distribution functions of exercise distances to cluster centers in a scaling space and Bayesian likelihood estimations with the aid of probabilistic profile of staying in activity parameter ranges. These techniques have demonstrated the capabilities of recognizing sets of abnormal exercises and detection of parameters characterizing operator mistakes to reveal the causes of abnormality. The techniques in question overcome limitations of existing methods and provide advantages over manual data analysis since they greatly reduce the combinatorial enumeration of the options considered.
General Information
Keywords: operators of complex technical systems, discrete wavelet transform, skill class recognition, Principal Components Analysis, Multidimensional Scaling, Cluster Analysis, Discriminant Analysis, eigenvalue trajectories
Journal rubric: Cognitive Psychology
Article type: scientific article
DOI: https://doi.org/10.17759/exppsy.2019120403
Funding. This work was performed as a part of the “SAFEMODE” Project (Grant Agreement No 814961) with the financial support of the Ministry of Science and Higher Education of the Russian Federation (Project UID RFMEFI62819X0014).
For citation: Kuravsky L.S., Yuryev G.A., Zlatomrezhev V.I. New approaches for assessing the activities of operators of complex technical systems. Eksperimental'naâ psihologiâ = Experimental Psychology (Russia), 2019. Vol. 12, no. 4, pp. 27–49. DOI: 10.17759/exppsy.2019120403.
Full text
Introduction
An objective assessment of activity performance is essential for training process of operators of complex technical systems (OCTS). One of the critical aspects here is development of the training evaluation criteria. The objective data based on trainee activity characteristics may be an effective indicator for objective judging of the level of training effectiveness and skills obtained after training. So, in demand are computer-aided diagnostics techniques that can be employed for selection of OCTS candidates to estimate the level of building-up of knowledge, ability and skills. These techniques can raise objectivity, informational content and accuracy of estimations together with standardization and automation of measurements. Of special importance are development and analysis of new approaches which are used to estimate level of training and psychophysiological state of operators. The principal focus area in this regard is diagnostics as a result of work on contemporary simulators where special conditions are available.
By now, a certain amount of results related to selection of abnormal exercise implementations has been accumulated [1—2, 7—15, 18, 29—31, 35, 37—38]. The vast majorities of them consider aircraft trajectories only and do not take into account other exercise parameters. The techniques obtained have the following limitations, which essentially restrict their practical applications, especially in case of analyzing flight data:
— Laborious manual preliminary data processing is always required;
— No rigorous mathematical criteria for selecting abnormal exercises;
— No capabilities to reveal the causes of incorrect exercise implementations including flight parameters clarifying them;
— Inefficient numerical optimization methods were selected;
— Different time scales for flight parameters under study, which are not acceptable for correct data analysis, are in use;
— Unsuccessful choices for metrics to compare exercises;
— Very significant computing resources are in need for calculations that results from both time series representation of the data to be processed and selection of time-consuming algorithms for solving relevant optimization problems;
— The EM-algorithm involved in data processing is not usually applicable for the data of high dimension;
— The regression models involved in data processing cannot be applied effectively for all possible flight parameters of interest;
— Calculated “averaged” structures (“centroids”) which are in use for flight classification cannot be generally considered as samples those might be implemented during a real flight;
— So called “negative scaling” that yields unrealistic interpretation for flight analysis is frequently resulted from data processing;
— Unacceptably large samples of similar exercises are required for qualitative analysis;
— Clustering flight trajectories instead of flights themselves;
— No really successful attempts to reduce the amount of flight data to be processed that results from their time series representation.
Certain application prospects are available for the approach implemented with the aid of the self-organizing maps (SOM) [5, 10]. However its real capabilities are limited essentially by non-determinism of SOM clustering and an inefficient way of aligning analyzed time series in the time domain, with structural stability of the obtained solutions being questionable.
As a result, there are only few examples of useful practical applications of these techniques by now (usually landing trajectories are under study). It should be noted that one of the principal weaknesses of the techniques in question is applying traditional metrics for comparing flight fragments since these metrics failed to solve the problem under study as well as related problems.
Since pilots are mentioned and because one of the most popular, but the least effective method for simple assessing the piloting quality is to check whether certain parameters are in the given critical value ranges for the specified flight modes, comments on this topic are unavoidable. Validity of such a technique is best clarified by the following analogy: it looks like an attempt to assess the quality of car driving via the number of collisions with a fence along the road, with all the other information about the car movement being ignored. It is obvious that the effectiveness and relevance of such evaluations do not hold water.
All the limitations presented above are overcome with the aid of the techniques [27—28] based on wavelet representation of operator activity parameters and comparisons of eigenvalue trajectories associated with observed exercises in the likelihood metric, which practical application is under consideration in this paper. Presented below are the techniques for skill assessments associated with relevant activity data obtained with the aid of both experiments and mathematical analysis of their results. As a result of its application, classes of skills should be determined using activity parameters and operator actions revealed during exercises.
To evaluate the data under study an activity record database is required, in which patterns of training data representing exercise implementations by different operator crews are collected. A pattern in question is a representation of a certain activity fragment to be analyzed, which is referred to as an exercise, via the set of parameters describing this exercise. These patterns are to be related to one of the recognizable skill classes of trainees.
Collected training data should include exercise parameters as well as relevant expert as- sessment/supervision comments from different sources including various types of training simulators, virtual reality systems and real operator work. The expert comments in use should reveal weak points of OCTS performance using information about typical mistakes in terms of activity parameters and advices to a local operator instructor how to correct these weaknesses. Certain attributes related to recognizable classes can be stored in the database both for cluster centers of patterns belonging to the classes under consideration and for each exercise pattern to solve application problems of interest.
The general assumption for the approaches under consideration is that the activities implemented in different styles and quality as well as exercises of different types can be discriminated in the multidimensional space formed with the aid of the wavelet coefficient metric or the likelihood metric of eigenvalue trajectories for activity parameters transforms. This statement is proved by computer experiments based on relevant empirical data. The general method that results from this conclusion is the pattern selection.
The techniques presented provide essential advantages over manual data analysis since they greatly reduce the combinatorial enumeration of the options considered.
The approaches in question can be used to support education activity and instructor assessment processes. They should be also useful as tools for comparing different training means and syllabus. They differ significantly from the probabilistic methods applied for system control, predictive diagnostics of technical failures, condition monitoring and operator activity support [16].
Basic approach: analysis of activity parameters represented via the discrete
wavelet transform of their time series
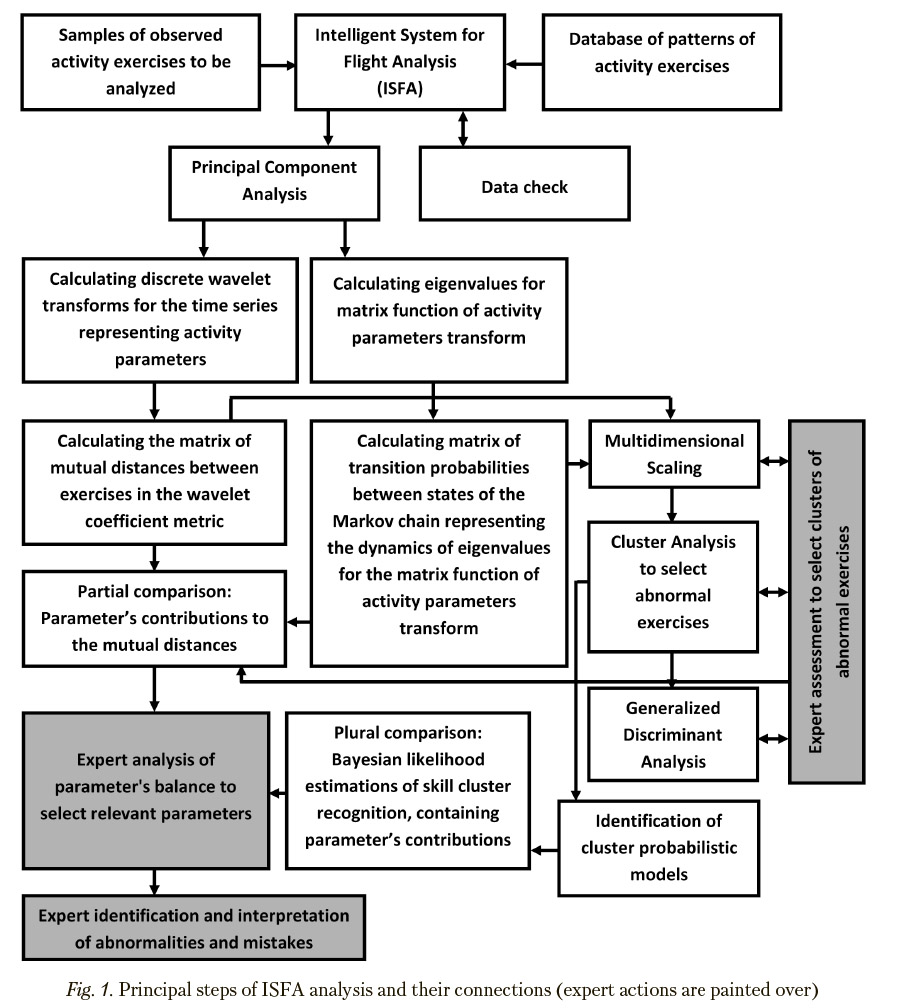
It is assumed that operator’s activity is represented by a set of time series describing the dynamics of technical system parameters as well as, if possible, the operator’s state. Both principal steps and connections of the analysis performed according to the proposed approach are presented in Figure 1, comments to which are placed below.
Among the purposes of this analysis are:
— Support of the outcome grading for current activity by means of its comparing with the activity patterns collected beforehand in the corresponding record database;
— Recognition of abnormal activity and detection of the parameters characterizing operator mistakes to reveal the sources of abnormality.
As preliminary processing, selections of time intervals for exercise comparison and data normalization are carried out. Selected are time series subsets corresponding to common time intervals, which are suitable for comparison of the same type exercises to be analyzed. Prior to the following computations, time series representing the history of performance of exercise completion are brought to a single scale, where the maximum is one and the minimum is zero.
Where the data are broken down by certain exercises represented by several measured parameters, the redundant information contained in the given time series is eliminated using the Principal Components Analysis [34, 39]. To do so, matrices of mutual correlations of time series values are computed, the algebraic problem of eigenvalues is solved and it is figured out to what extent it is possible to decrease the dimension of eigen subspace of the researched parameters so that this would contain a sufficiently representative part of variability of the observed parameters. For each of the selected eigendirections of this subspace (principal components), for one of the highest component loads a representative is elected from registered parameters (transition to the basis of principal components is impractical due to uncertain substantial interpretation of principal components and, in a number of applied tasks, due to no precise synchronization of researched processes for different exercises in time). The purpose of this stage is to find out only relatively independent characteristics replacing groups of significantly dependent representatives with only one characteristic parameter to avoid distortions stipulating to combined effect of strongly dependent characteristics in the subsequent phases.
Following to the basic approach, transition to integral characteristics for time intervals by means of discrete wavelet transform is performed. Time series representing the training processes under study are replaced with series of wavelet coefficients obtained as a result of the Multiresolution Analysis [33]. In this case, the original processes as functions of time are replaced with the integral characteristics of the time intervals, which are associated with these functions domain. In addition, significant saving (for about an order of magnitude) in the number of coefficients necessary for a correct representation of these process becomes available. Due to the rules for assigning wavelet coefficients to time series fragments, which are in use in multiresolution analysis, problems associated iWth the need to precisely synchronize processes relating to various same-type training exercises in tim? hca^^ been cancelled since the most significant coefficients relating to relatively long time intervals are almost insensitive to moderate time shifts. Length of the wavelet representations used during subsequent analysis can be significantly (approximately an order of magnitude) smaller than the length of the corresponding original time series, with no loss in the estimations accuracy.
For exercises under study, one needs either to compute the matrix of mutual distances between wavelet representations of source processes for different operator activities or to use the alternative approach creating similar matrices in the likelihood metric of eigenvalue trajectories associated with observed activity fragments (this way is presented in the subsequent Section). Dimensions of such matrices are equal to the sample sizes of analyzed exercises. Such matrices of mutual distances for all considered parameters are added to form the total matrix of mutual distances between the exercises under study. Estimation of relative contributions of activity parameters in the elements of the mutual distances matrices is available for recognizing abnormal exercises in the scaling spaces and detection of the parameters characterizing operator mistakes to reveal the sources of abnormality.
Multidimensional Scaling [3, 36] to analyze the mutual allocation of operator exercises within a space with acceptable dimensions is available after computing the matrix of mutual distances. The computed allocation of exercises under study in the resulting space of the Multidimensional Scaling is further used to define distances between the exercises to make diagnostic decisions. The dimensions of the scaling space are defined based on the condition of sufficient differentiation of exercise samples relating to different recognizable classes. The aim of this step is subsequent discrimination between the exercise types and normal/abnormal activity implementations in a scaling space.
The Cluster Analysis of patters in the obtained scaling space is performed to reveal clusters representing various types of exercises and operator skill classes. Obtained results provide possibility for creating certain classification rules to separate different scale levels of trial quality assessment in a scaling space. Wherein cluster differences for an exercise type can be explained by the exercise implementation resulted from individual skills. In particular, both Cluster Analysis and Multidimensional Scaling steps are necessary to reasonably select clusters of abnormal exercises.
Probabilistic models represented by Markov random processes with discrete states and continuous time [6, 18—25, 32] for each pattern cluster are created using the identification procedure to represent probabilistic dynamics for each operator skill class to forecast probabilistic class behavior. This step is implemented in two ways: via distribution of probabilities of being in model states and via dynamics of mathematical expectations for each independent parameter determined with the aid of the Principal Components Analysis (correspondingly, these parameters are considered approximately as independent ones).
Computations of distances to pattern cluster centers or to the nearest patterns are based on results of performing a sequence of test exercises. If the pattern sample size is fairly large, distances are defined to centers of cluster patterns. These are computed based on multidimensional scaling data obtained earlier. If pattern samples are small, the nearest pattern is defined, which definition may be done in two ways: either immediately through the computing of the pattern being nearest in the Euclidian metric of wavelet representation or through the identifying of the pattern in the resulting space of multidimensional scaling, with such pattern being nearest in the Euclidian metric.
Probabilistic assessments of operator skill class recognition using sample distribution functions of distances to cluster centers are defined using sample distribution functions F.(X) of Euclidean distances X to cluster centers of patterns belonging to the relevant recognizable operator skill class i e {0, ..., z} in a multidimensional scaling space. Computed values ofpt = 1 - Fi(ri), where r is the Euclidean distance of ith cluster in the space of multidimensional scaling, are interpreted as probabilistic assessments of belonging to the given classes. Their distribution among classes {pi}z=0 characterizes the reliability of the obtained classification. In fact, the given approach implements the idea of the Linear Discriminant Analysis in an generalized form. But unlike the latter there are no restrictions on observed data distributions.
After an operator completes a certain test exercise, in order to collect a meaningful data set representing his activity accumulated by some time check point, the following results are to be determined with the aid of the given database:
— The nearest pattern, following to which the relevant attributes are ascribed to the operator under assessment;
— Distances to cluster centers of patterns belonging to recognizable classes together with the sample distribution functions of distances to centers of such clusters.
Probabilistic assessments of operator skill class attribution using Bayesian likelihood estimations are calculated basing on identified probabilistic models.
Forecasting behavior of the selected parameters for the recognized operator skill class cluster with the aid of the created probabilistic models is carried out by both distribution of probabilities of being in model states and dynamics of mathematical expectations for each independent parameter to estimate probability of hitting into dangerous situations associated with the certain intervals of the parameters under consideration.
So, three ways of skill class assessments are available:
— direct comparison of current exercises with the activity database patterns in the wavelet representation metric associated with observed exercises, which is considered as a basic technique, as well as on
— probabilistic assessment of skill class recognition via the Generalized Discriminant Analysis using sample distribution functions of exercise distances to cluster centers in a scaling space, which is considered as a supportive technique, and
— Bayesian likelihood estimation (selecting a skill class with the aid of probabilistic profile of staying in activity parameter ranges), which is also considered as a supportive technique.
Wherein, the actions, which an expert is responsible for, are:
— Assessment to select clusters of abnormal exercises;
— Analysis of parameter’s balance to select relevant parameters to be under study;
— Identification and interpretation of abnormalities and mistakes.
The approach in question can be applied even if the exercise sample sizes are small since both the pattern selection and calculation of the parameter’s contributions to the mutual distances in pairwise exercises comparison are available in this case.
The Intelligent System for Flight Analysis (ISFA) implementing the developed techniques with the aid of the LabVIEW graphical programming system provides the required calculations [27—28]. ISFA has been officially registered at the Russian Patent Agency (“ROSPATENT”) [26], with the following list of computational macro operations being available:
— Viewing characteristics of the activities represented by the exercises, including characteristic parameters and relevant meaningful comments;
— Eliminating of redundant information by means of the Principal Components Analysis;
— Assessments of a skill class by selecting the closest activity pattern with the aid of the matrix of mutual distances between wavelet representations of time series for collected activities (1st way of skill class assessment);
— Getting the matrix of successful transitions to select a next training activity;
— Clustering collected activities by the K-Means Algorithm;
— Assessments of a skill class using sample distribution functions of distances to cluster centers in a scaling space (2nd way of skill class assessment);
— Identifying probabilistic profile of a selected parameter for a selected cluster in terms of the Markov process with time-dependent transition flow rates between the states. This process implies solving the inverse problem for parameters of a set of ordinary differential equations. It uses observed solution fragments for a certain number of time points, with transition flow rates itself being assumed to be functions of time. Detailed description of a numerical method developed for the abovementioned identification is given in previously published works [22, 32];
— Assessments of a skill class using the Bayesian likelihood estimations. Visualization in form of 3 dimensional surface plots should be used to select characteristic parameters which are potentially responsible for abnormal activity implementation (3rd way of skill class assessment).
Alternative approach: analysis of activity parameters via complex
eigenvalue trajectories of their time series transform
Let us consider a set of M time-dependent operator’s activity parameters which are represented by the set of time series:
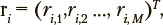
where values of index  correspond to discrete time points.
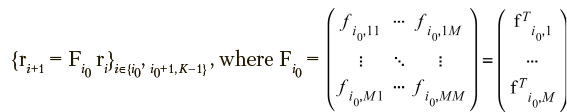
Let the r dynamics be represented by the following matrix equation:

where F. is time-dependent matrix function of dimension M. Since this matrix function is of interest for analyzing dynamics of the activity parameters under study, it should be identified, with empirical data being the only source for such estimation.
Despite the fact that matrix F. depends on time in the general case, it can be approximated by the corresponding stationary matrix during a sufficiently short period including K time points and starting at point i0, where K > M:
If this approximation does not fit empirical data, the time step used in forming the time series in question can be reduced several times to obtain the desired fitness.
If one considers K equations
each row 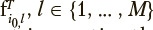 of matrix Fi0 can be identified as a pseudosolution of the corresponding l-th matrix equation that is overdetermined in the general case:
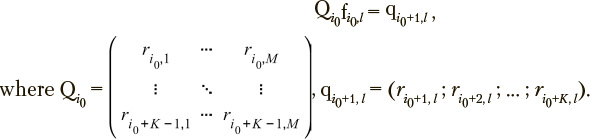
Each of the given l overdetermined equations can be solved by the direct method after multiplying its left and right parts by matrix QTviz.:
This equation yields the solution that provides a minimal residual between left and right parts of the initial overdetermined equation in the Euclidian metric and, accordingly, may be considered as the optimal one. Thus, the entire identified matrix is obtained using redundant information.
Identified matrix function Fi is a normalized characteristic of the time series set to be analyzed. Its eigenvalues, which are functions of discrete time, are principal content of the transform defined by this matrix function for the whole set of parameters. Accordingly, their dynamics is principal content of the total time series dynamics in compressed form. In general case, these eigenvalues are complex ones, with eigenvectors being non-orthogonal. Purely complex values (with nonzero imaginary part) form pairs of complex conjugate ones corresponding to transformations in a certain two-dimensional invariant space. Initial problem dimension can be reduced if dynamics of several first complex eigenvalues, which are greatest in absolute value, is used for analysis.
Trajectories of the given eigenvalues on the complex plane can be used for pairwise comparisons of different exercises to recognize their types and features of implementation including abnormality. In this case discrete-state discrete-time Markov processes (Markov chains) are used to represent the dynamics of each eigenvalue, with the complex plane domain under consideration being divided into cells by a finite grid of sufficient resolution and the'j-th Markov chain state being represented by j-th cell of this grid  . Transitions between the given states are determined by the transitions of the relevant eigenvalue under study between the cells in question.
The s-th exercise under consideration, where  can be characterized by a stochastic square matrix
  of transition probabilities between states of the Markov chain, where ujjs is the probability of transition from state j to state i
  . Dynamics of the probabilities of being in the Markov chain states as functions of discrete time is determined by the following matrix equation:

where values of index  correspond to discrete time points;
  represents the probabilities of being in the states at time point i. Each exercise has its own identified matrix Us with a unique set of the probabilities of transitions between the sttil;es. Identification of each matrix Us is performed using sample estimates based on empirical data on the transition frequencies from one state to another for each exercise under consideration.
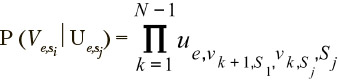
The s-th exercise is represented by a sequence of passed states  The likelihood of exercise s1 in relation to exercise sj for the e-th eigen value trajectory can be represented by the conditional probability
  that is calculated using the sequence of passed states
  } in case of matrix
  of transition probabilities:
 is considered as the exercise pair distance matrix for an exercise set under study and the e-th eigenvalue trajectory in the likelihood metric of eigenvalue trajectories. The total exercise pair distance matrix Z is the sum of corresponding particular matrices for each eigenvalue trajectory under consideration:
Z = KeZe.
Matrix Z can be used instead of the matrix of mutual distances between wavelet representations of source processes for different operator exercises, which is presented in the previous Section, to implement an alternative approach to comparing implementations of exercises in the likelihood metric of eigenvalue trajectories. Calculating this matrix is followed by the multidimensional scaling and cluster analysis as it is shown in the description of algorithmic aspects of the initial way of operator activity analysis in the previous Section.
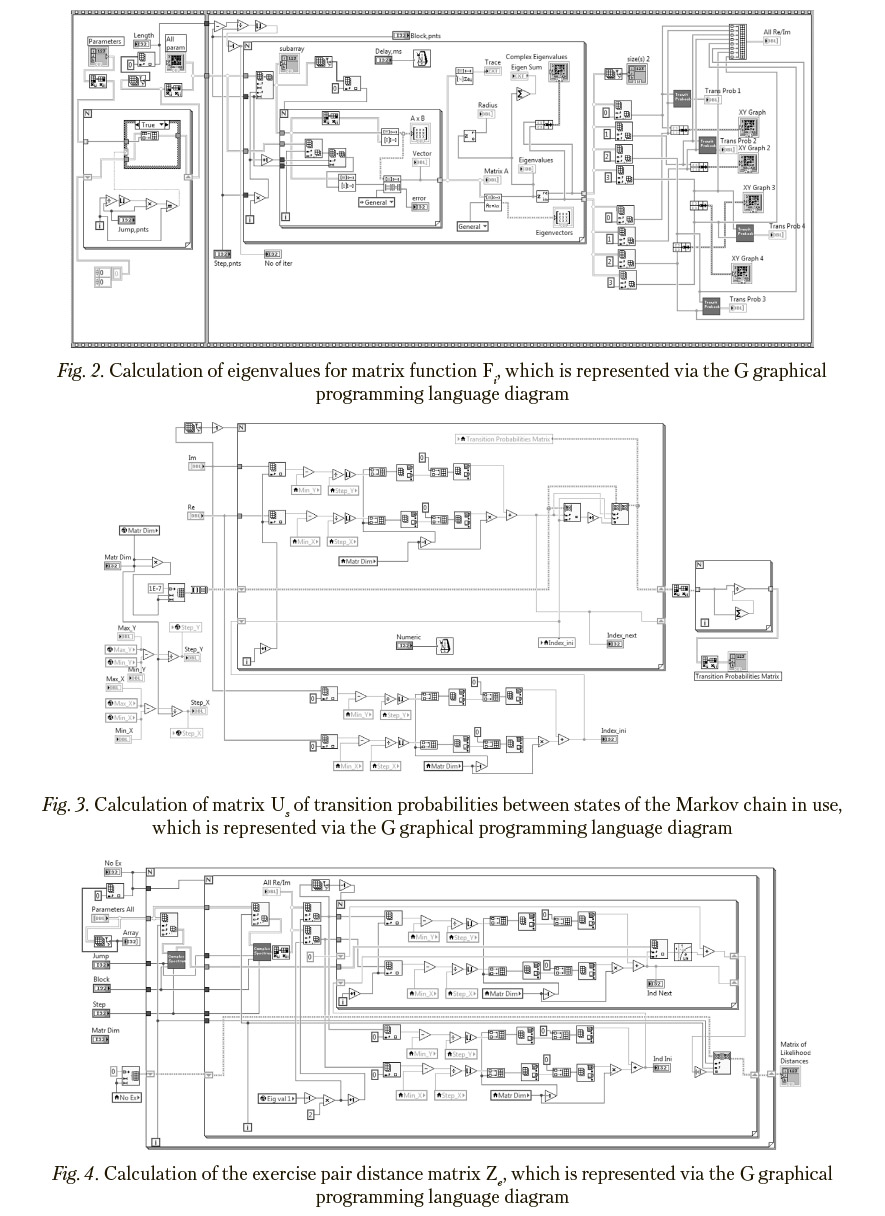
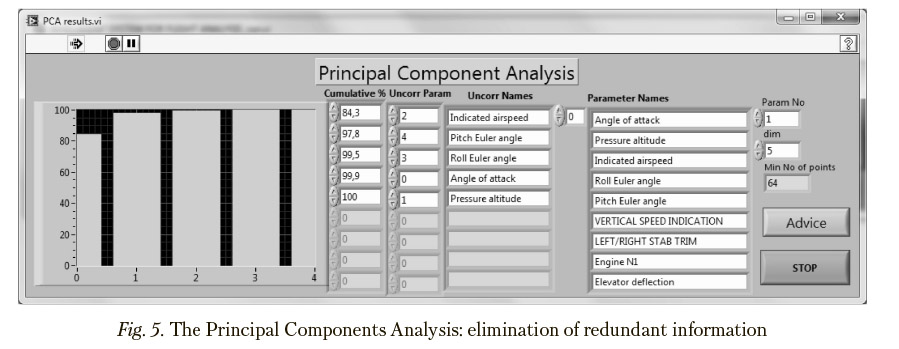
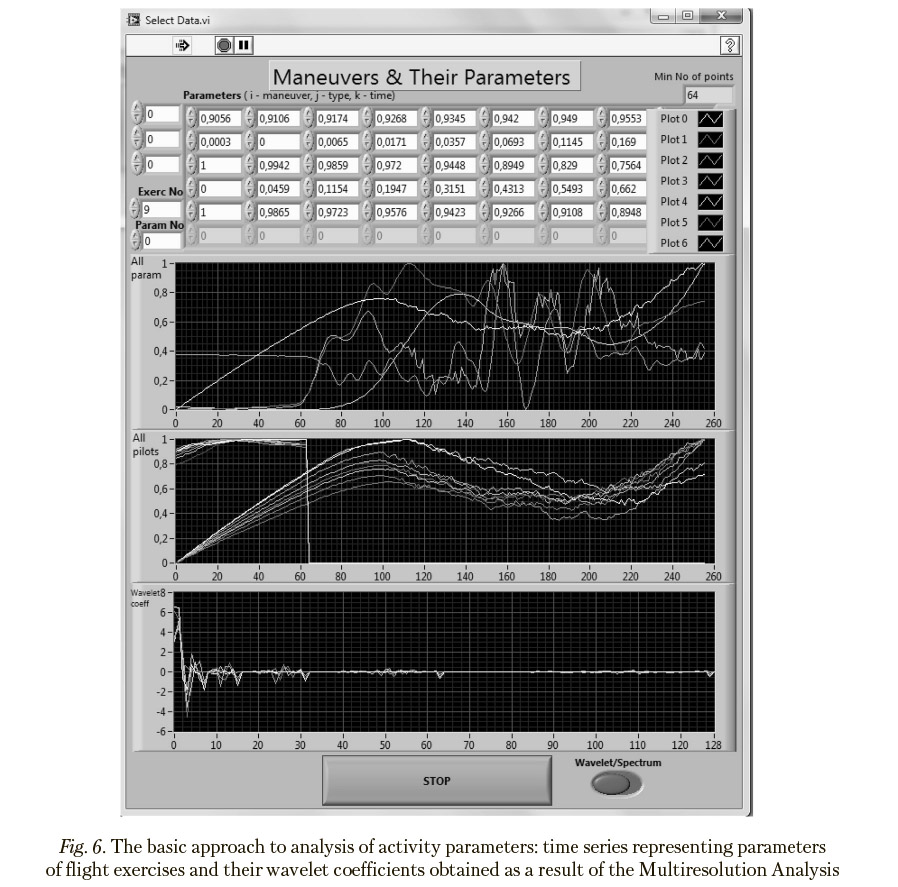
Since, despite the apparent simplicity, programming the given technique may cause difficulties, diagrams illustrating key details of software implementation are presented in Figures 2—4 with the aid of the G graphical programming language notation [4], which is one of the most convenient means for compact representation of computational algorithms.
It is important to note that the approach under consideration is not so much sensitive to reasonable time shifts in synchronizing training exercises due to dependence on the sequence of passed Markov chain states Vs.
Example of application
Since aircraft pilots are one of the most representative embodiments of OCTS, pilot works during flight exercises can be employed as practical illustrations of the activities under consideration. To illustrate the approaches in question, steps of analysis for two groups of 16 demonstration flight exercises, which are conventionally called “Upset Recovery” (UR) and “Wind Shear” (WS), are presented hereinafter. It is important to note that durations of exercises from these groups differ significantly.
The Principal Components Analysis revealed that five first principal components represent almost completely 100% of 28 total observed parameters variance and, therefore, can be employed for representation of all available characteristics for the further analysis (see Figure 5, where cumulative percent of total variance is given for the set of five selected parameters).
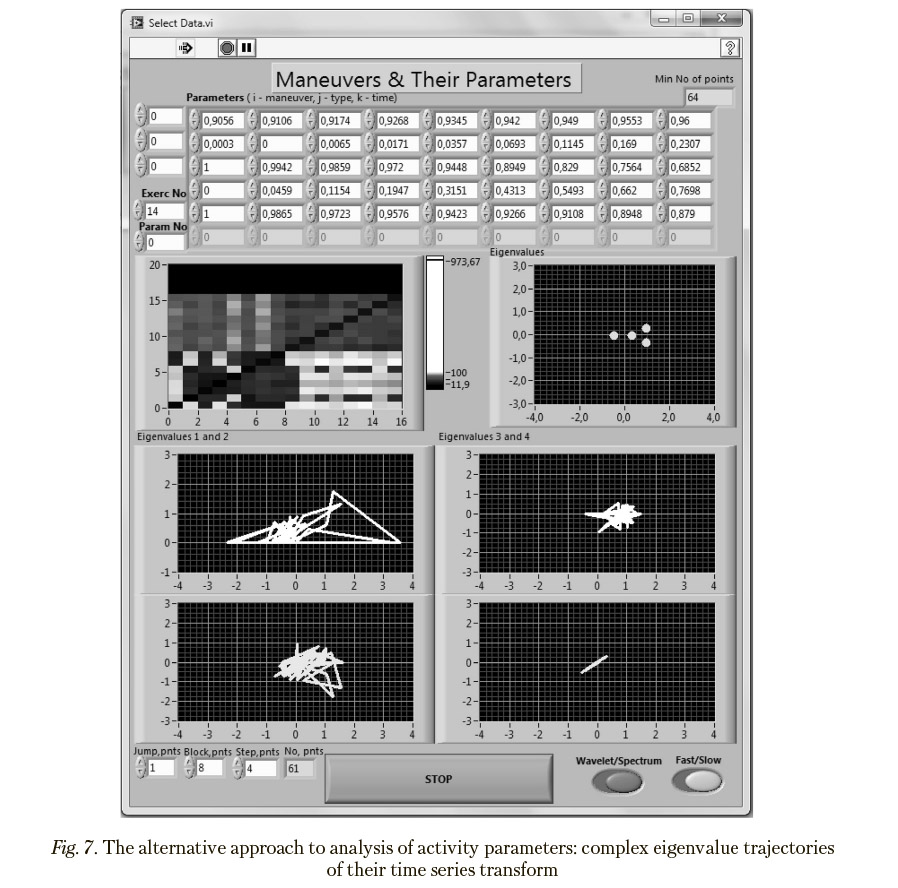
Implementing the basic approach to analysis of activity parameters, the applied Daubechies D4 wavelet transform for time series (Figure 6) turned out to be acceptable to get proper conclusions. The computed allocations of the exercise implementations to be analyzed in the resulting space, which are obtained as a result of the multidimensional scaling, were further in use to both define distances between the trials to make relevant conclusions and represent the exercise implementations for analysis through coordinate sets.
Implementing the alternative approach to analysis of activity parameters, complex eigenvalue trajectories representing their time series transform that was considered in the previous Section were calculated (Figure 7).
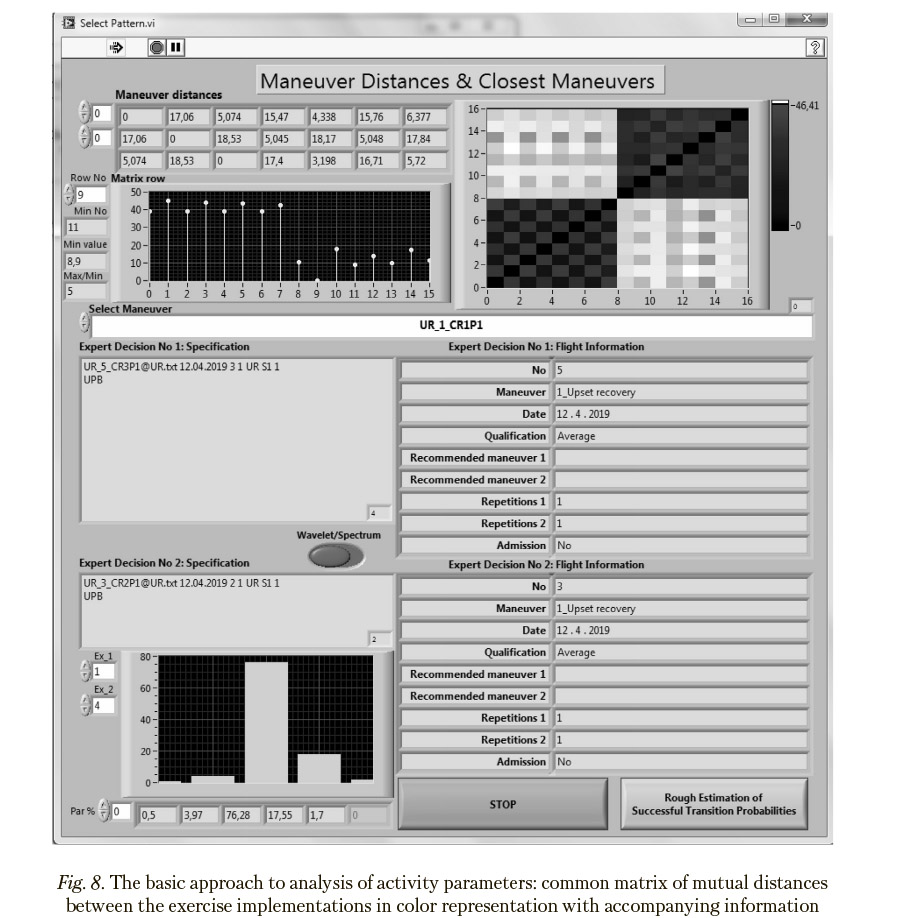
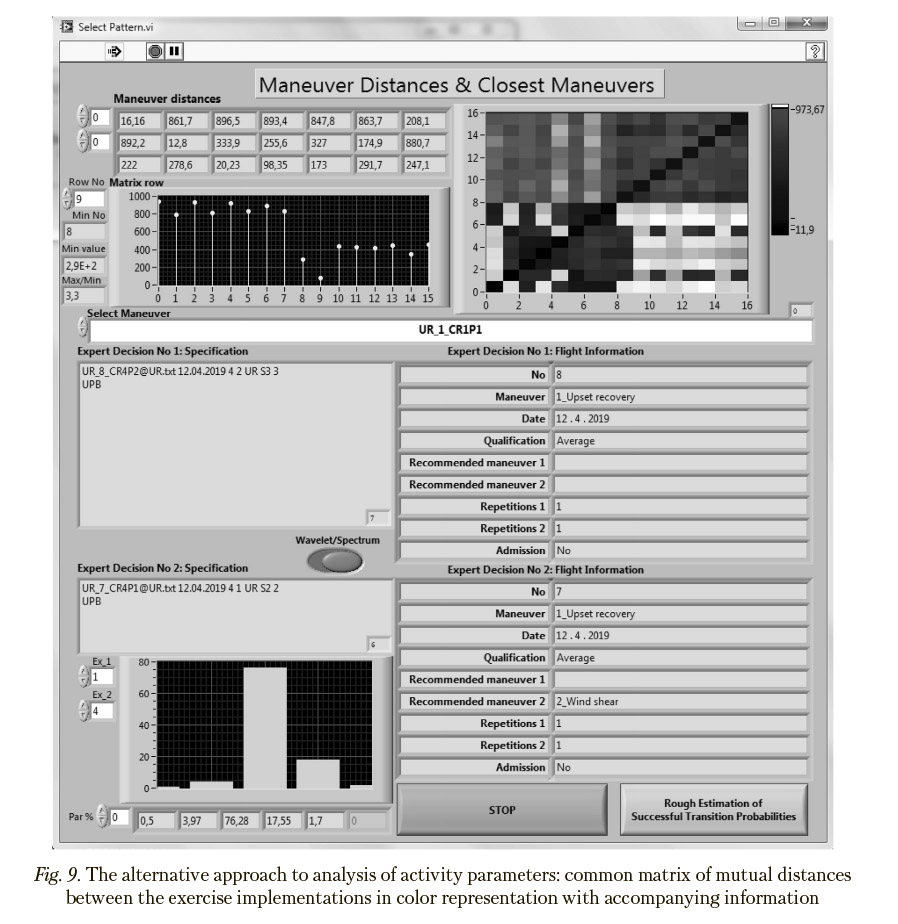
Common matrices of mutual distances between the implementations of flight exercises in color representation together with accompanying information are given in Figures 8—9, with a separate diagram showing distances from the selected exercise to all the other ones. Both presented matrices of mutual distances show by sight substantial qualitative differences between the UR and WS groups.
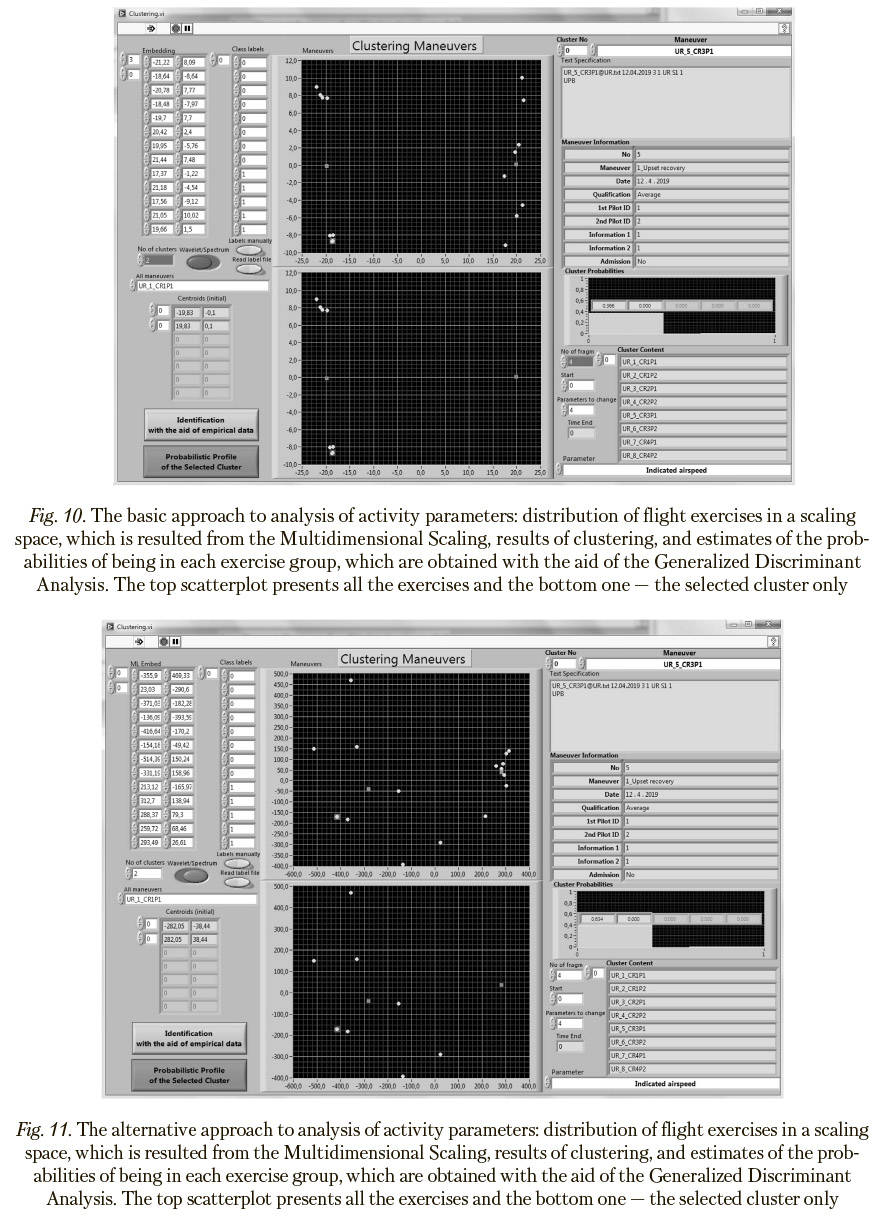
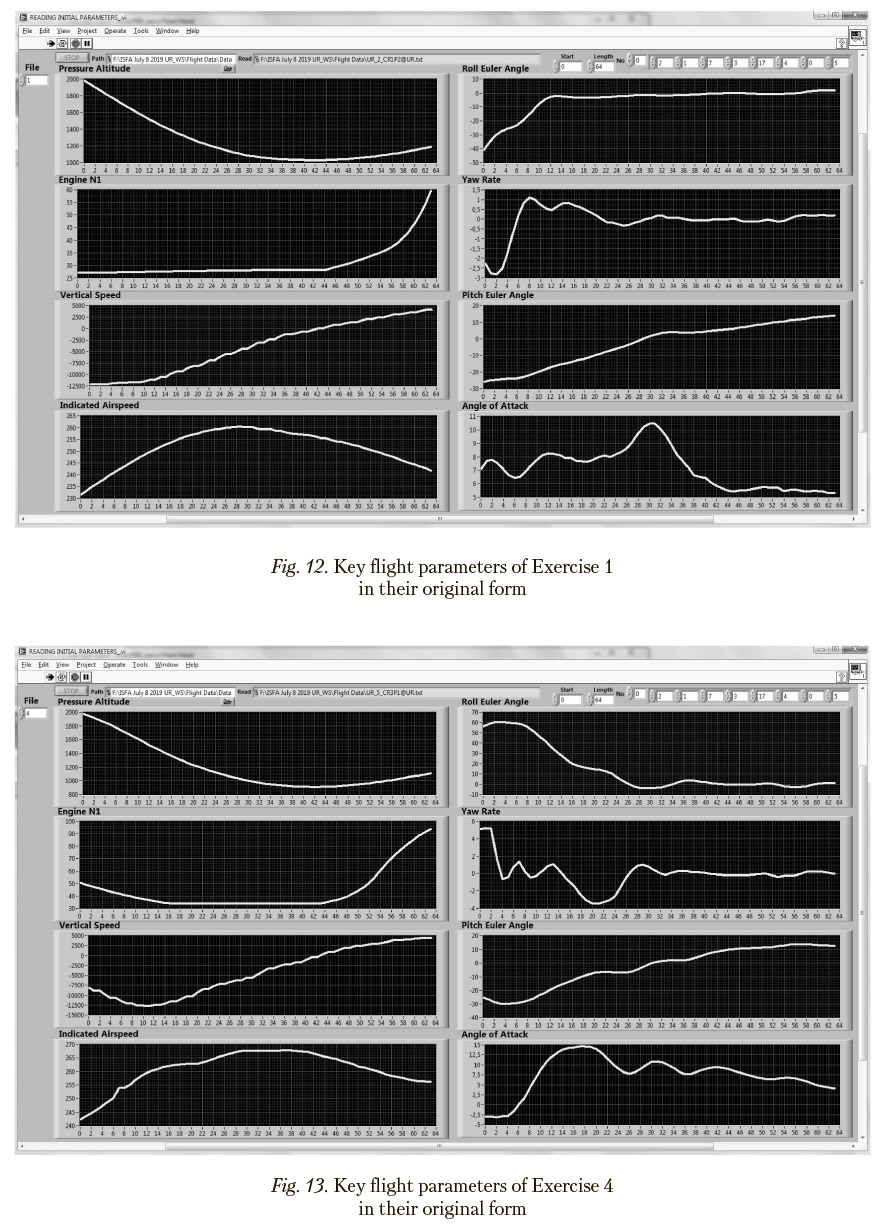
The Multidimensional Scaling, which was performed on the basis of the obtained matrices of mutual distances, yielded the distribution of flight exercises in a scaling space to be analyzed. Results of the subsequent Cluster Analysis are completely coinciding with UR and WS group membership. The corresponding diagrams (Figures 10—11) show obviously that exercises from UR and WS groups are easily separated in this space . The Discriminant Analysis yields highly significant discrimination between the groups under study for both the basic (Wilks’ Lambda=0.0045, F (2,13)=1437.4, p<0.0001) and alternative approaches (Wilks’ Lambda=0.114, F (2,13)=50.3, p<0.0001). As shown in these Figures, the Generalized Discriminant Analysis makes it possible to calculate the estimates of probabilities of being in each exercise group under consideration for any selected flight exercise. Thus, the techniques in use provide strong discrimination between the given flight exercise types in the scaling space.
To reveal the reasons of differences between the implementations of two exercises of interest, relative contributions of the flight parameters, which are selected with aid the Principal Components Analysis, in the corresponding elements of the matrices of mutual distances are estimated. Parameters providing the greatest contribution are considered as responsible ones. For example, if Exercises 1 implemented without mistakes and Exercise 4 implemented abnormally
are taken into consideration, their difference according to the bar chart in Figures 8 and 9 is determined mainly by Parameters “Roll Euler Angle” (76%) and “Angle of Attack” (18%) (names of these parameters are given in Figure 5). These exercises belong to type UR and, as shown in Figure 10, are located at the greatest distance in the corresponding UR-cluster in the scaling space. Direct comparison of key flight parameters presented in Figures 12 and 13 in their original form results in the conclusion that differences between normal and abnormal implementations are caused by reaching unacceptable roll Euler angles and, especially, dangerous angles of attack (15%) in Exercise 4.
Thus, estimating relative contributions of flight parameters in the elements of the common matrices of mutual distances has demonstrated the capabilities of both recognizing abnormal exercises in the scaling spaces and detection of flight parameters characterizing pilot mistakes to reveal the sources of abnormality.
It can be concluded that the applied techniques, which are based on the Multidimensional Scaling for mutual distances between either wavelet transforms of relevant time series representing activity parameters or eigenvalue trajectories for flight parameters transforms in the likelihood metric, proved to be effective tools for both distinguishing maneuvers of different types and detecting abnormal flight fragments, with effectively determining activity parameters which dynamics reveal pilot mistakes.
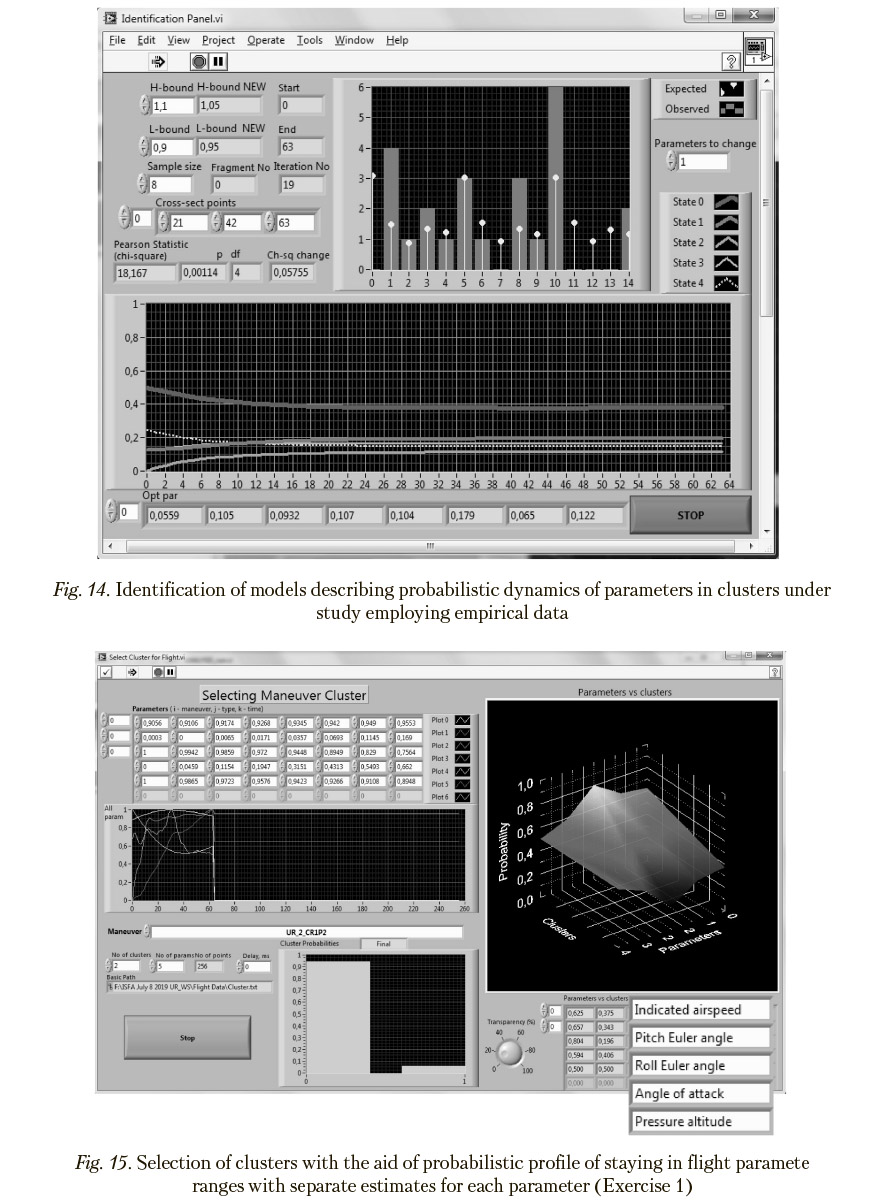
To reveal parameters that are responsible for differences between the calculated clusters, the models describing probabilistic dynamics of each parameter in clusters under study were identified employing the available empirical data and the techniques presented in [22—23, 27— 28, 32] (Figure 14). In particular, selecting clusters via Bayesian likelihood estimations (with the aid of probabilistic profile of staying in flight parameter ranges), with separate estimates for each parameter being calculated, revealed that:
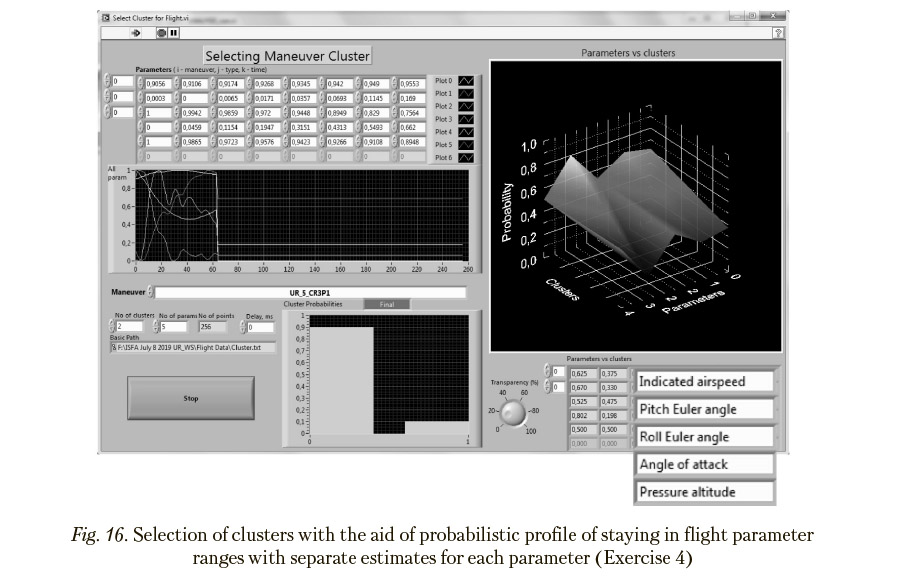
— Exercise 1 is assigned to the UR-cluster due to the prevailing influence of Parameter “Roll Euler Angle” (Figure 15) and
— Exercise 4 is assigned to the UR-cluster due to the prevailing influence of Parameter “Angle of Attack” (Figure 16).
In case of comparing clusters corresponding to normal and abnormal flight exercises, parameters responsible for abnormality and, consequently, the causes of pilot mistakes can be determined in this way. So, the demonstrated capabilities for recognizing the causes of differences between the clusters of exercise implementations in a scaling space are suitable for revealing the sources of flight abnormality.
Principal results and conclusions
1. With the operator’s activity being represented by a set of time series ciescribing < I ynen lies of technical system parameters as well as, if possible, the operator’s state, the presented basic and a^l^^ir- native approaches make it possible to support the outcome grading for current <ex<rrei-^<e> by means of their comparing with the exercise patterns collected beforehand in the uciiviiv recordduKibuse
2. Three ways of skill class assessments are available:
— comparisons of current exercises with the activity database patterns both in the wavelet representation metric and in the likelihood metric of eigenvalue trajectories associated with observed exercises (basic technique);
— probabilistic assessments of skill class recognition using sample distribution functions of exercise distances to cluster centers in a scaling space (supportive technique);
— Bayesian likelihood estimations with the aid of probabilistic profile of staying in activity parameter ranges (also supportive technique).
3. It is important that due to the rules for assigning wavelet coefficients to time series fragments, which are in use in multiresolution analysis, problems associated with the need to precisely synchronize processes relating to various same-type training exercises in time have been cancelled since the most significant coefficients relating to relatively long time intervals are almost insensitive to moderate time shifts. Similarly, the alternative approach is not so much sensitive to moderate time shifts in synchronizing training exercises.
4. The Multidimensional Scaling for mutual distances between either wavelet transforms of relevant time series representing activity parameters or eigenvalue trajectories for activity parameters transforms in the likelihood metric as well as the Cluster Analysis of cext/rci^^c pmters in an obtained scaling space are in use to provide discrimination in a scaling space between the exercise types and normal/abnormal activity implementations. These techniques proved to be effective tools for both distinguishing exercises of different types and detecting their abnormal fragments, with effectively determining activity parameters which dynamics reveal operator mistakes.
5. The techniques in use provide possibility for creating certain classification rules to separate different scale levels of trial quality assessment in a scaling space. Wherein cluster differences for an exercise type can be explained by the exercise implementation resulted from individual skills.
6. Partial comparisons to estimate parameter’s contributions to the mutual distances are available in case of small exercise sample sizes. In case of greater sample sizes, plural comparisons to get Bayesian likelihood estimations for operator skill clusters attribution, which contain parameter’s contributions, are available.
7. Estimating relative contributions of activity parameters in the elements of the matrices of mutual distances has demonstrated the capabilities of both recognizing abnormal exercises in the scaling spaces and detection of the parameters characterizing operator mistakes to reveal the sources of abnormality.
8. The presented capability for recognizing the causes of differences between the clusters of exercise implementations in a scaling space via Bayesian likelihood estimations (when a skill class is selected with the aid of probabilistic profile of staying in activity parameter ranges) is also suitable for revealing the sources of implementation abnormality.
9. The techniques presented provide tremendous advantages over manual data analysis since they greatly reduce the combinatorial enumeration of the options considered.
10. The approaches in question should be useful as tools for comparing different training means and syllabus.
Funding
This work was performed as a part of the “SAFEMODE” Project (Grant Agreement No 814961) with the financial support of the Ministry of Science and Higher Education of the Russian Federation (Project UID RFMEFI62819X0014).
References
-
Aircraft trajectory clustering techniques using circular statistics. Yellowstone Conference Center, Big Sky, Montana, 2016. IEEE.
-
Bastani V., Marcenaro L., Regazzoni C. Unsupervised trajectory pattern classification using hierarchical Dirichlet Process Mixture hidden Markov model //2014 IEEE International Workshop on Machine Learning for Signal Processing (MLSP) / IEEE. 2014. Pp. 1—6.
-
Borg, I., Groenen, P. J. F. Modern Multidimensional Scaling Theory and Applications. — Springer, 2005. P. 140.
-
Bress, Thomas J. Effective LabVIEW Programming: NTS Press, 2013. ISBN 1-934891-08-8.
-
Cottrell M., Faure C., Lacaille J., Olteanu M. Anomaly Detection for Bivariate Signals. IWANN (1) 2019: 162—173.
-
Cramer H. Mathematical Methods of Statistics. Princeton: Princeton University Press. 1999. — 575 pp.
-
Eerland W.J., Box S. Trajectory Clustering, Modelling and Selection with the focus on Airspace Protection // AIAA Infotech@ Aerospace. _ AIAA, 2016. Pp. 1—14.
-
Enriquez M. Identifying temporally persistent flows in the terminal airspace via spectral clustering // Tenth USA/Europe Air Traffic Management Research and Development Seminar (ATM2013) / Federal Aviation Administration (FAA) and EUROCONTROL. Chicago, IL, USA: 2013. June 10—13.
-
Enriquez M., Kurcz C. A Simple and Robust Flow Detection Algorithm Based on Spectral Clustering // International Conference on Research in Air Transportation (ICRAT) / Federal Aviation Administration (FAA) and EUROCONTROL. — Berkeley, CA, USA: 2012. May 22—25.
-
Faure C., Bardet J.M., Olteanu M., Lacaille J. Using Self-Organizing Maps for Clustering and Labelling Aircraft Engine Data Phases. In: WSOM (2017): 96—103.
-
Gaffney S., Smyth P. Joint probabilistic curve clustering and alignment // In Advances in Neural Information Processing Systems. Vol. 17. Cambridge, MA: MIT Press, 2005. Pp. 473—480.
-
Gaffney S., Smyth P. Trajectory clustering with mixtures of regression models // Proceedings of the fifth ACM SIGKDD international conference on Knowledge discovery and data mining. 1999. Pp. 63—72.
-
Gariel M., Srivastava A., Feron E. Trajectory clustering and an application to airspace monitoring // IEEE Transactions on Intelligent Transportation Systems. 2011. Vol. 12, no. 4. Pp. 1511—1524.
-
Grevtsov N. Synthesis of control algorithms for aircraft trajectories in time optimal climb and descent // Journal of Computer and Systems Sciences International. 2008. Vol. 47, no. 1. Pp. 129—138.
-
Hung C., Peng W., Lee W. Clustering and aggregating clues of trajectories for mining trajectory patterns and routes // The VLDB Journal — The International Journal on Very Large Data Bases. 2015. Vol. 24, no. 2. Pp. 169—192.
-
Krasilshchikov M.N., Evdokimenkov V.N., Bazlev D.A. Individually adapted airborne systems for monitoring the aircraft technical condition and supporting the pilot control actions. Moscow, MAI Publishing House, 2011. — 440 pp (in Russian).
-
Kuchar J. K., Yang L. C. A review of conflict detection and resolution modeling methods // IEEE Transactions on Intelligent Transportation Systems. 2000. Vol. 1, no. 4. Pp. 179—189.
-
Kuravsky L.S., Artemenkov S.L., Yuriev G.A., Grigorenko E.L. New approach to computer-based adaptive testing. Experimental Psychology. 2017. Vol. 10. No. 3. Pp. 33—45. doi:10.17759/exppsy.2017100303
-
Kuravsky L.S., Margolis A.A., Marmalyuk P.A., Panfilova A.S. , Yuriev G.A. Mathematical aspects of the adaptive simulator concept — Psychological Science and Education. 2016. Vol. 21. No. 2. Pp. 84—95. doi: 10.17759/pse.2016210210 (in Russian).
-
Kuravsky L.S., Margolis A.A., Marmalyuk P.A., Panfilova A.S., Yuryev G.A., Dumin P.N. A Probabilistic Model of Adaptive Training. — Applied Mathematical Sciences, Vol. 10, 2016, no. 48, 2369—2380, http:// dx.doi.org/10.12988/ams.2016.65168
-
Kuravsky L.S., Marmalyuk P.A., Yurev G.A. Diagnostics of Professional Skills Based on Probability Distributions of Oculomotor Activity. — RFBR Journal, No. 3 (91), 2016, pp. 72—82 (Supplement to “Information Bulletin of RFBR” No. 24, in Russian).
-
Kuravsky L.S., Marmalyuk P.A., Yuryev G.A. and Dumin P.N. A Numerical Technique for the Identification of Discrete-State Continuous-Time Markov Models — Applied Mathematical Sciences. Vol. 9, 2015, No. 8, pp. 379—391. URL: https://doi.org/10.12988/ams. 2015.410882
-
Kuravsky L.S., Marmalyuk P.A., Yuryev G.A., Belyaeva O.B. and Prokopieva O.Yu. Mathematical Foundations of Flight Crew Diagnostics Based on Videooculography Data. — Applied Mathematical Sciences, Vol. 10, 2016, no. 30, 1449—1466, https://doi.org/10.12988/ams.2016.6122
-
Kuravsky L.S., Marmalyuk P.A., Yuryev G.A., Dumin P.N., Panfilova A.S. Probabilistic modeling of CM operator activity on the base of the Rasch model. — In: Proc. 12th International Conference on Condition Monitoring & Machinery Failure Prevention Technologies, Oxford, UK, June 2015.
-
Kuravsky L.S., Yuriev G.A. Probabilistic method of filtering artefacts in adaptive testing. — Experimental Psychology, Vol.5, No. 1, 2012, pp. 119—131 (in Russian).
-
Kuravsky L.S., Yuryev G.A. Certificate of state registration of the computer program № 2018660358 Intelligent System for Flight Analysis v1.0 (ISFA#1.0). Application №2018617617; declared 18 July 2018; registered 22 August 2018. (ROSPATENT).
-
Kuravsky L.S., Yuryev G.A. Detecting abnormal activities of operators of complex technical systems and their causes basing on wavelet representations // International Journal of Civil Engineering and Technology (IJCIET). Vol. 10(2). P. 724—742. URL: http://www.iaeme.com/MasterAdmin/UploadFolder/ IJCIET_10_02_070/IJCIET_10_02_070.pdf. (Accessed 17.09.2019).
-
Kuravsky L.S., Yuryev G.A. On the approaches to assessing the skills of operators of complex technical systems. In: Proc. 15th International Conference on Condition Monitoring & Machinery Failure Prevention Technologies, Nottingham, UK, September 2018. 25 pp.
-
Laxhammar R., Falkman G. Online learning and sequential anomaly detection in trajectories // IEEE Transactions on Pattern Analysis and Machine Intelligence. 2014. Vol. 36, no. 6. Pp. 1158—1173.
-
Li Z., et al. Incremental clustering for trajectories // Database Systems for Advanced Applications. Lecture Notes in Computer Science. 2010. Vol. 5982. Pp. 32—46.
-
Liu H., Li J. Unsupervised multi-target trajectory detection, learning and analysis in complicated environments // 2012 21st International Conference on Pattern Recognition (ICPR) / IEEE. 2012. Pp. 3716—3720.
-
Markov models in the diagnostics and prediction problems: Textbook. /Edited by L.S. Kuravsky. 2nd Edition, Enlarged. — Moscow: MSUPE Edition, 2017. — 203 pp. (in Russian).
-
Neal P.G. Multiresolution Analysis for Adaptive Refinement of Multiphase Flow Computations. University of Iowa, 2010.116 pp.
-
René Vidal, Yi Ma, Shankar Sastry. Generalized Principal Component Analysis. Springer-Verlag: New York, 2016.URL: http://www.springer.com/ us/book/9780387878102
-
Rintoul M., Wilson A. Trajectory analysis via a geometric feature space approach // Statistical Analysis and Data Mining: The ASA Data Science Journal. 2015.
-
Trevor F. Cox, M.A.A. Cox. Multidimensional Scaling, Second Edition. Chapman & Hall/CRC, 2001. P. 299.
-
Wei J., et al. Design and Evaluation of a Dynamic Sectorization Algorithm for Terminal Airspace // Journal of Guidance, Control, and Dynamics. 2014. Vol. 37, no. 5. Pp. 1539—1555.
-
Wilson A., Rintoul M., Valicka C. Exploratory Trajectory Clustering with Distance Geometry // International Conference on Augmented Cognition /Springer. 2016. Pp. 263—274.
-
Xiangyu Kong, Changhua Hu, Zhansheng Duan. Principal Component Analysis Networks and Algorithms. Springer, 2017. URL: http://www.springer.com/us/book/9789811029134.
Information About the Authors
Metrics
Views
Total: 872
Previous month: 12
Current month: 6
Downloads
Total: 349
Previous month: 1
Current month: 1