Psychological-Educational Studies
2022. Vol. 14, no. 1, 95–110
doi:10.17759/psyedu.2022140107
ISSN: 2587-6139 (online)
Age and Individual Differences in the Intellectual Development of Elementary Schoolchildren when Solving SPM Tasks
Abstract
General Information
Keywords: Standard Progressive Matrices, wrong responses analysis, intellectual development, elementary schoolchildren
Journal rubric: Developmental Psychology
Article type: scientific article
DOI: https://doi.org/10.17759/psyedu.2022140107
Received: 08.05.2021
Accepted:
For citation: Vucicevic B. Age and Individual Differences in the Intellectual Development of Elementary Schoolchildren when Solving SPM Tasks [Elektronnyi resurs]. Psychological-Educational Studies, 2022. Vol. 14, no. 1, pp. 95–110. DOI: 10.17759/psyedu.2022140107.
Full text
Introduction
Progressive Matrices by J.C. Raven in all their variants (Standard, Standard plus, Coloured and Advanced) are still the most famous and widely used intelligence tests in both research and practice [16; 34], with the classic version SPM remaining the most popular one. They are used in education (diagnostics of intelligence and giftedness) [1; 4; 22], in clinical practice (diagnosis of mental backwardness) [12; 24], in professional selection [2], in different studies for leveling groups according to their intelligence [33], as well as a standard when developing and validating new intelligence tests. The results of the meta-analysis show that programs aimed at increasing the level of intelligence do not affect the development of ability measured by the Matrices [26]. Although there are studies in which the Matrices continue to be considered as a test of general intelligence [6; 20], in most of contemporary studies they are mainly used for assessment of the key function of fluid intelligence – the abstract reasoning [5; 9; 11; 16; 26; 28; 29; 33; 34].
From the very beginning of the administration of the SPM test, due to its structure, it became possible to go beyond the traditional method of intelligence assessment and to obtain an additional information about the intellectual abilities of the subjects. Having to choose an answer among several options provides a basis for investigating the mistakes people make when solving this test. The main idea is that a variety of mistakes made while solving the tasks with a given choice of answers makes it possible to discover unique patterns of intellectual processes. Despite the fact that the SPM test items were not originally designed for this purpose [3], already in his first studies Raven discovered that not all alternative answers are chosen with the same frequency, but rather that people have preferred options [23]. Even those contemporary studies that were not directly interested in SPM, indicate that by analyzing the mistakes subject makes when solving an intelligence test, we can acquire some interesting data. For example, in one experiment [8] it was revealed that subjects with different levels of intellectual ability not only choose different wrong alternatives, but also in problem solving situations when there is no set of answers provided, they make different mistakes. This is another confirmation of the words of I.E. Sigel who said that, first, by ignoring incorrect answers, psychologists are losing a lot of information about cognitive processes that can indicate what exactly causes difficulties for a given person and, second, due to existing testing practices suffers not only the quality of the intelligence assessment of an individual, but also the understanding of intelligence in general - its boundaries, functioning and development [27]. Thus, the question about the possibilities of using the analysis of wrong responses on the SPM test for a differentiated assessment of the level of the child's intellectual development remains open.
From 1939 to the present time, a fairly large number of studies on the analysis of the mistakes people made while solving SPM have been carried out, which led to the expansion of and addition to the classification made by Raven. These studies differ in their approaches to the problem of wrong responses analysis, as well as in their choice of the test variants the analysis was performed on. Usually, researchers used statistical [18; 30] or computer [10] models of human cognitive functioning or they compared the mistakes made by different groups, for example, the mistakes of adults and children of different ages [7; 27; 32] or mistakes of typical children and children with developmental disabilities such as Down syndrome [17], Williams syndrome [31], and autism [13]. Everyone agrees that wrong responses analysis provides an additional information, but, unfortunately, no one has explained how this information can be used in practice, for a deeper understanding of the differences in the development of thinking in children. Also, these studies did not discuss the possibility of using this approach to study the development of intellectual ability.
In our opinion, the last suggested classification of mistakes that children make when solving SPM tasks, proposed in the work of M. Kunda et al. [13], has some advantages when compared with all previous ones that are based on a logical analysis of the features of the tasks themselves. First, descriptions of wrong responses attempt to explain the mental processes of a person who made a particular mistake. Second, based on the descriptions, the authors made a step-by-step instruction manual that allows each response option to be attributed to one of 4 groups of errors. The inter-rater reliability for coding the answer responses is high - 98%. It is important to note that the authors of the manual use already known types of errors. They are first named and described by Raven [3], and then they were used and elaborated by others. In the last classification, the wrong responses are described based on the characteristic features of the mental process that lead to each type of error, as follows:
-
Incomplete correlate error – the subject understands the problem, sees all the relevant relationships within the matrix, but cannot combine them all when choosing an answer;
-
Wrong principle error – the subject is not able to understand the relationships within the matrix and instead combines the elements of the matrix according to some of his own rules;
-
Repetition – Perseveration or repetition of the figure closest to the missing fragment within the matrix, the answer is chosen based on perception;
-
Difference – The subject chooses an answer that catches the eye, because it is qualitatively different from the rest and may seem like the most difficult option.[1]
Thus, the classification of wrong responses suggested in the work of Kunda et al. is, in our opinion, the most suitable for studying the possibilities of using the wrong responses analysis for the study and differentiated assessment of the intellectual development of a child.
Procedure
The aim of the study was to determine the possibilities of using the analysis of wrong responses on the SPM test for a differentiated assessment of the development of the intellectual abilities of children at elementary school age. In addition, since the study of the analysis of wrong responses when solving the SPM was never done in Russia before, an additional task of this study was to compare the data with those obtained in foreign studies.
The hypothesis of the study was that the characteristic type of wrong response made by primary schoolchildren when solving SPM test items manifests itself when analyzing both age-related differences and individual differences.
The study was organized in two stages. At the first stage, we identified and coded all possible wrong responses in every SPM item, using the manual for Kunda et al.'s classification [13]. An empirical study involving 160 children enrolled in the 1st (N = 80, age 6; 7 - 8; 1, M = 7; 3) and the third (N = 80, age 8; 8 - 10; 2, M = 9; 3) classes from two schools in Moscow, was carried out at the second stage. Children solved the original version of the Standard Progressive Matrix test which provided us with the information of their level of fluid intelligence, but also allowed us to mark their wrong responses.
In the Russian Federation, the age norms for SPM for children under 14 years old are not available, therefore, the British norms from 1979. are still used in practice. Taking into account the Flynn effect [15] and the absence of Russian age norms for determining the level of intelligence using SPM, we abandoned the use of British norms in favor of determining percentiles of the sample.
The data were collected in schools. On average, first graders took two, and third graders one school class (45 minutes) to complete the SPM test by writing down their answers on a sheet, according to the instructions of the test itself.
Results
Table 1 shows the results of descriptive statistics of the SPM test performance in two age groups:
Table 1
Descriptive statistics of the SPM test performance
|
Age |
Mean |
Standard deviation |
95% confidence interval |
Range |
Kolmogorov-Smirnov test |
Significance |
|
7 |
34.45 |
9.548 |
32.33 – 36.57 |
13 – 52 |
0.104 |
0.033* |
|
9 |
40.24 |
7.533 |
38.56 – 41.91 |
13 – 55 |
0.103 |
0.036* |
The results show that the compared age groups differ in the level of fluid intelligence measured by the SPM, since the 95% confidence intervals of the means do not overlap. They also show that the distribution of responses in both groups differs from the normal, and that their variances are heterogeneous (F = 6.456, p = .012), therefore, to test the hypothesis about the existence of differences between them we applied Welsh test. The results of the analysis showed that the groups of 7-year-olds and 9-year-olds children really differ in the level of intelligence (t (1) = 18.117, p = 0.000). We can say that the older children, on average, performed better on the test, although for both groups the test was little easier.
An example of one of the SPM test series with coded all
response options according to the Kunda et al.'s manual is presented in table
2.
table 2
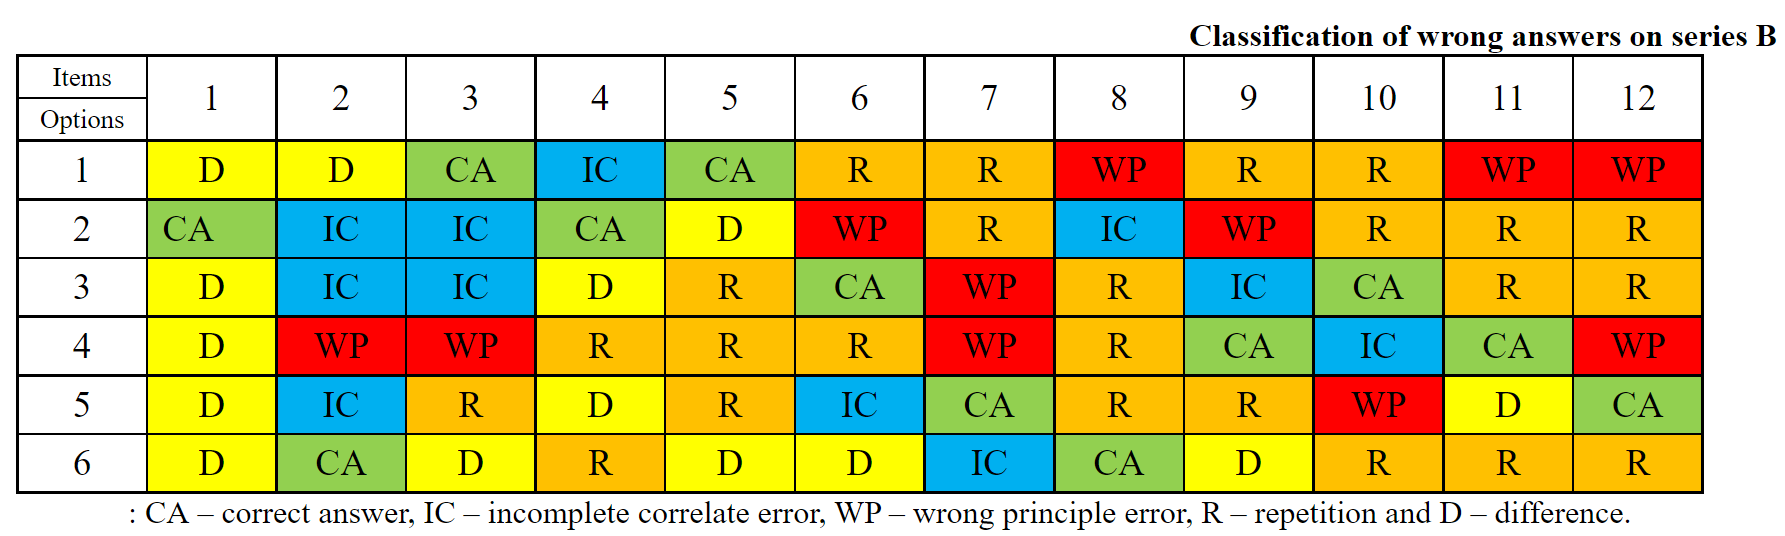
As shown in the table 2, the number of possible wrong responses that belong to the certain type of error is not the same both in the series as a whole and within individual items. Because of this, the following results are obtained after calculating the relative frequency of wrong responses on SPM made by the subjects. The average values of the relative frequencies of different types of errors children of different age made while solving SPM as well as their ranges are presented in table 3:
Table 3
Average values and ranges of the relative frequency of the types of the error
|
|
IC |
WP |
R |
D |
|
|
7 years |
Mean |
13.99 |
35.0 |
35.16 |
15.66 |
|
Range |
3 – 50 |
7 - 60 |
8 – 81.4 |
0 – 50 |
|
|
9 years |
Mean |
16.71 |
42.16 |
25.52 |
14.47 |
|
Range |
0 – 50 |
17 - 70 |
0 – 68 |
0 – 30 |
|
Comparative analysis of different types of errors made by children from different age groups reveals significant differences. Younger children make “wrong principle” and “repetition” errors with equal frequency, while older children make “wrong principle” errors more often. Levene’s test for equality of variances showed that variances are homogeneous for all types of errors, except for the “incomplete correlate” error (IC: F = 5.568, p = .020; WP: F = 2.570, p = .111; R: F = 0.377, p =. 540; D: F = 0.001, p = .982), thus, the between-group differences in the type of errors were tested with the Mann-Whitney test. The results are presented in table 4:
Table 4
Differences in the types of errors between 7- and 9-year-olds (U criterion)
|
Types of errors |
IC |
WP |
R |
D |
|
U-criterion |
2735.0 |
2200.5 |
2017.5 |
3090.5 |
|
Significance |
0.112 |
0.001** |
0.000** |
0.709 |
|
Rank (7 year) |
74.69 |
68.01 |
95.28 |
81.87 |
|
Rank (9 year) |
86.31 |
92.92 |
65.72 |
79.13 |
Note. * - р≤0,05; ** - р≤0,01
The results obtained show that 7- and 9-year-olds really made different number of the following two types of errors - “wrong principle” and “repetition”. The 9-year-olds made more “wrong principle” errors, while the younger ones made more “repetition” errors.
The Kruskal - Wallis test was used to test the significance of differences in the characteristic type of errors between subjects with different levels of fluid intelligence within each age group. Four subgroups of children were identified based on the percentiles of the sample (1 - percentile 95%, 2 - percentile 75 - 95%, 3 - percentile 25 - 75% and 4 - percentile 25%). Differences in the characteristic type of errors in 7-year-old children with different levels of intelligence were found for all types of errors (IC: χ² (3) = 12.067, p = .007; WP: χ² (3) = 12.330, p =. 006; R: χ² (3) = 8.731, р = .033) except for the error "difference" (D: χ² (3) = 3.111, р = .375).
Pairwise comparison of the relative frequency of errors made by 7-year-olds from different groups of intellectual development revealed three significant results. For errors "incomplete correlate" and "repetition", the differences are significant only between subgroups 2 and 4 (the Bonferroni correction is .010 and .032 for these errors, respectively).
Table 5
Comparison of «incomplete correlate error» frequencies between subgroups of 7-year-olds
|
Subgroup |
Criterion |
Significance (Bonferroni correction) |
|
4-3 |
6.547 |
1.000 |
|
4-1 |
22.975 |
.426 |
|
4-2 |
23.739 |
.010* |
|
3-1 |
16.428 |
1.000 |
|
3-2 |
17.197 |
.058 |
|
1-2 |
- .764 |
1.000 |
Data in Table 5 show that 7-year-olds from the 4th subgroup differ from their peers from the 2nd subgroup in the amount of the 2 types of errors they made – they made fewer “incomplete correlate” errors, and more “repetition” errors.
Regarding the error "wrong principle", significant differences are observed only between children from the 1st and 3rd subgroups (Bonferroni correction is .035) - those from the 1st subgroup made fewer errors of this type.
An analysis of differences in the type of errors between 9-year-old children from different subgroups showed that significant differences were found only for the errors of “incomplete correlate” (IC: χ² (3) = 13.866, р = .003) and “repetition” (R: χ² (3 ) = 12.341, p = .006). The results of pairwise comparison analysis of the relative frequency of errors "incomplete correlate" made by 9-year-olds from different intellectual groups are presented in table 6:
Table 6
Comparison of «incomplete correlate error» frequencies between subgroups of 9-year-olds
|
Subgroup |
Criterion |
Significance (Bonferroni correction) |
|
4-3 |
7.088 |
1.000 |
|
4-2 |
19.451 |
.070 |
|
4-1 |
40.232 |
.009* |
|
3-2 |
12.363 |
.438 |
|
3-1 |
33.144 |
.039* |
|
2-1 |
20.781 |
.0657 |
Data in table 6 show that 9-year-olds from the 1st subgroup differ from their peers from the 3rd and 4th subgroups in the amount of “incomplete correlate” errors they made.
With regard to the “repetition” error, significant differences were observed only between children from the 1st and 4th subgroups (Bonferroni correction is .039). Thus, we can say that subjects from subgroup 1 (top 5%) made fewer "repetition" errors than those from subgroup 4 (bottom 25%) and more "incomplete correlate" errors than subjects from subgroups 3 and 4 combined.
Discussion
The results of the study showed that the typical mistakes younger and older children made when solving the SPM test are really different. Having in mind that, as the other authors write, the only thing we really know about solving the intelligence tests is that older children do better than younger [14; 19], this result was expected. At the same time, our result underlines the importance of studying both age-related differences and individual differences in children's responses to the test items.
Our results also showed that the typical mistake 9-year-olds make is “wrong principle”, while for 7-year-olds it is “repetition”. Thus, the first part of our hypothesis was confirmed. At the same time, our results differ from those obtained in foreign studies, which showed that the most common mistake in children aged 8-13 is “repetition” [21; 23; 27], and the second most frequent one is the “wrong principle” error [32]. Our results also partially contradict the ones obtained in the study interested in the changes of certain types of errors through ages [31], in which the authors came to the conclusion that the number of “repetition” errors increases with age, the number of “wrong principle” and “difference” error decreases, while the number of errors “incomplete correlate” does not change. The results of our study are consistent with the data showing that between the ages of 7 and 9, the number of "incomplete correlate" errors does not change, and the number of "wrong principle" errors decrease. However, the number of "repetition" errors in our study decreased significantly with age, while the number of "difference" errors did not change. It is possible that the differences found in the data of our and foreign studies [31] are partly due to the fact that the latter used Coloured Progressive Matrices (CPM), which consists only of two of the simplest series of the SPM test. However, differences in the type of the most common errors in our and other foreign studies were found even though we used the same version of the SPM test. In this case those differences might be explained with the age of the subjects participating in the research. In foreign studies the sample consisted of children aged from 8 to 13 years, while in our study two age groups were identified – 7- and 9-year-olds. It is necessary to note here that for 7-year-olds SPM test items are considered difficult [3]. Another point that, in our opinion, should be taken into account when interpreting the differences in the data obtained is that, despite the fact that all studies analyze the same types of errors, the question of whether all the criteria for attributing the child's answer to this or that classification group coincide among different researchers, remains open. Unfortunately, the agreement of experts in some studies was approximately only 72% [32].
In the study we have also found individual differences in the characteristic types of errors children make while solving the SPM associated with the level of their intellectual development. The second part of the hypothesis about the differences in the most common type of error made by children of the same age, but different levels of intelligence, was also confirmed. Seven-year-olds who completed the SPM tasks at the lowest level (subgroup 4), in comparison with children of the average and above average levels of intelligence, made the “repetition” error most often. This corresponds to the data of foreign studies, in which this error was most frequent in subjects with lower levels of intelligence [23; 27; 32]. Also, this subgroup made "incomplete correlate" errors less than other subgroups and this type is considered to be “the smartest” error, that is, the one closest to the correct answer. An interesting result was also found in the results of the children from subgroup 1, who, in comparison with their peers with an average and lower levels of intelligence, made significantly fewer mistakes "wrong principle", the mistake that shows that they did not understand the essence of the task. In the case of 9-year-olds, the smartest pupils, in comparison with their peers with an average and lower levels of intelligence, again made more “incomplete correlate” errors and fewer “repetition” errors.
Finally, the results of the study showed that finding a way to use the analysis of the wrong responses on the SPM for a differentiated assessment of the development of intellectual abilities at elementary school age can and should be task for future. But, at the same time, it had been shown that Kunda et al.'s classification is not good enough for such analysis. First, the example of the coded responses on the items of series B shows that in most of the items there is not one answer which can be attributed to a certain type of error. As a result, on the same item subjects can make the same type of error, while choosing different response options. For example, both repeat an existing matrix element, but one of them repeats the figure on top of the empty space, and the other repeats the figure on the left. This classification of the responses does not allow us to reveal the difference in the thinking process of these subjects. This clarification is even more important in the case of the "difference" error, to which completely different answers can be attributed - from exaggerating the characteristics of a certain element of the matrix to a completely inappropriate figure. Perhaps that is why no differences were found in the number of this particular type of error both between age groups (7- and 9-year-olds) and between subgroups of children with different intelligence levels within each age group.
Also, it should be mentioned that in some foreign studies authors initially identified 5 types of wrong responses [32], that is, in addition to those already mentioned, there was one more type described: “confluence of ideas” error. This error is a wrong response, which consists of parts of the elements of all the already existing shapes in the matrix. However, researchers later decided not to isolate it but to consider it as a variant of the “incomplete correlate” error. If we bear in mind what was said above, then we can assume that, in fact, this error may be the result of a mental process different from the one responsible for the “incomplete correlate” error, therefore, in future studies it is advisable to consider it as a separate type.
Finally, two main drawbacks of Kunda et al.'s classification have3 to be addressed, especially because they can also be found in all the previous classifications. The first one is that the classification is based on the assumption that the correct thought process is behind the subject's correct answer. Series D is a prime example of this assumption being wrong. Items in this series are often organized in the form of a Latin square and the correct answer is an already existing figure, which does not allow us to distinguish whether the subject understood the principle or made the “repetition” error. This is related to the second drawback - the explanations of the types of errors do not take into account the specifics of individual series of SPM. Each series forms one theme [25]: (A) continuous patterns, (B) analogies between pairs of figures, (C) progressive alteration of patterns, (D) permutation of figures, and (E) resolution of figures into constituent parts. It can be assumed that the same type of error made in different series actually reveals different intellectual levels as well as different qualitative aspects of the subjects' thought process.
Conclusion
Results obtained in an empirical study showed that age-related and individual differences in the nature of errors made by elementary schoolchildren while solving the SPM intelligence test do reflect the qualitative originality of the children’s thinking.
The value of this study lies in the fact that the results obtained underlie the importance of taking into account the age of the subjects and the level of their intellectual abilities in the study of wrong responses on intelligence tests. The results not only showed that 7-year-olds and 9-year-olds really make mistakes in different ways, but also that within these age groups there are significant differences in the type of wrong answers depending on the level of intellectual development. At the same time, results showed that such classification of wrong responses on the SPM test has not been proposed, with the help of which it would be possible to draw a conclusion about the thinking process that led the subject to choose a certain response. This is partly due to the fact that SPM test was not created for such analysis. All the existing classifications of types of wrong responses on the SPM, including the last one, are based on post hoc explanations, which complicates, but does not make it impossible to analyze them.
An important and necessary step towards creating a
conceptual classification is to take into account few important points. First,
it is the unequal distribution of different types of errors in tasks within the
SPM series. Second, it is the existence of two different answers that belong to
the same type of error. In addition, it is important to keep in mind that the
same types of errors made by subjects in each series of Matrices may be due to
different thought processes. Finally, we note the wrong assumption of the
authors of all existing classifications that the correct process of thinking is
responsible for the correct answer. The creation of new classifications that
take into account all of the above problems is of great importance both for
research on the intellectual development of elementary schoolchildren and for
the practical work of psychologists.
[1] To indicate errors further in the text, abbreviations of their names are used: IC - incomplete correlate error, WP - wrong principle error, R - repetition and D - difference.
References
- Donii E.I., Shumakova N.B. Sravnitel'nyi analiz kognitivnykh kharakteristik i kreativnosti mladshikh podrostkov s intellektual'noi i khudozhestvennoi odarennost'yu [Elektronnyi resurs] [Comparative Analysis of Cognitive Characteristics of Young Adolescents with Artistic and Intellectual Giftedness]. Psikhologo-pedagogicheskie issledovaniya = Psychological-Educational Studies, 2020. Vol. 12, no. 3, pp. 110–123. DOI:10.17759/psyedu.2020120307 (In Russ.).
- Kozhurova O.A., Malinina A.A. Osobennosti strutury professional'nogo samoopredeleniya uchashchikhsya starshikh klassov [Features of structure of professional self-determination of senior classes’ pupils]. Vestnik Samarskoi gumanitarnoi akademii. Seriya: Psikhologiya = Bulletin of Samara Academy for the humanities. A series of psychology, 2007, no. 1, pp. 85–93. (In Russ.).
- Raven Dzh.K. Rukovodstvo k progressivnym matritsam Ravena i slovarnym shkalam. Razd. 1. Obshchaya chast' rukovodstva: Per. s angl. [Manual for Raven’s Progressive Matrices and Vocabulary Scales. Section 1. General part]. Dzh.K. Raven, Dzh.Kh. Kurt (eds.). Moscow, Kogito-Tsentr, 1997. 82 p. (In Russ.).
- Sorokova M.G., Ermakov S.S. Gendernye osobennosti razvitiya intellekta uchenikov VI–X klassov [Elektronnyi resurs] [Gender features of intellectual development of students of VI-X classes]. Psikhologicheskaya nauka i obrazovanie psyedu.ru = Psychological Science and Education psyedu.ru, 2014. Vol. 6, no. 4, pp. 56–70. DOI:10.17759/psyedu.2014060406 (In Russ.).
- A latent variable analysis of working memory capacity, short-term memory capacity, processing speed, and general fluid intelligence / Conway A.R.A. [et al.]. Intelligence, 2002. Vol. 30, pp. 163–183. DOI:10.1016/S0160-2896(01)00096-4
- A neural basis for general intelligence / Duncan J. [et al.]. Science, 2000. Vol. 289, no. 5478, pp. 457–460. DOI:10.1126/science.289.5478.457
- Babcock R.L. Analysis of age differences in types of errors on the Raven's Advanced Progressive Matrices. Intelligence, 2002. Vol. 30, no. 6, pp. 485–503. DOI:10.1016/S0160-2896(02)00124-1
- Cairns D., Chekaluk E., Hutchinson T.P. The wrong responses to a very difficult item: A comparison of high-scoring and low-scoring examinees. International Journal of Mathematical Education in Science and Technology, 2002. Vol. 33, no. 6, pp. 839–842. DOI:10.1080/00207390210162494
- Carlstedt B., Gustafsson J-E., Ullstadius E. Item Sequencing Effects on the Measurement of Fluid Intelligence. Intelligence, 2000. Vol. 28, no. 2, pp. 145–160. DOI:10.1016/S0160-2896(00)00034-9
- Carpenter P.A., Just M.A., Shell P. What one intelligence test measures: a theoretical account of the processing in the Raven Progressive Matrices Test. Psychological review, 1990. Vol. 97, no. 3, pp. 404. DOI:10.1037/0033-295X.97.3.404
- Dimensionality of the Raven’s Advanced Progressive Matrices: Sex differences and visuospatial ability / Waschl N.A. [et al.]. Personality and Individual Differences, 2016. Vol. 100, pp. 157–166. DOI:10.1016/j.paid.2015.12.008
- Do Raven's Colored Progressive Matrices function in the same way in typical and clinical populations? Insights from the intellectual disability field / Facon B. [et al.]. Intelligence, 2011. Vol. 39, no. 5, pp. 281–291. DOI:0.1016/j.intell.2011.04.002
- Error patterns on the Raven’s Standard Progressive Matrices Test / Kunda M. [et al.]. Intelligence, 2016. Vol. 59, pp. 181–198. DOI:10.1016/j.intell.2016.09.004
- Explanatory item response modeling of children's change on a dynamic test of analogical reasoning / Stevenson C.E. [et al.]. Intelligence, 2013. Vol. 41, no. 3, pp. 157–168. DOI:10.1016/j.intell.2013.01.003
- Flynn J.R. Requiem for nutrition as the cause of IQ gains: Raven’s gains in Britain 1938-2008. Economics and Human Biology, 2009. Vol. 7, pp. 18–27. DOI:10.1016/j.ehb.2009.01.009
- Garcia-Garzon E., Abad F.J., Garrido L.E. Searching for g: A new evaluation of spm-ls dimensionality. Journal of Intelligence, 2019. Vol. 7, no. 3, pp. 14. DOI:10.3390/jintelligence7030014
- Gunn D.M., Jarrold C. Raven’s matrices performance in Down syndrome: Evidence of unusual errors. Research in Developmental Disabilities, 2004. Vol. 25, no. 5, pp. 443–457. DOI:10.1016/j.ridd.2003.07.004
- Jacobs P., Vandeventer M. Information in wrong responses. Psychological Reports, 1970. Vol. 26, pp. 311–315. DOI:10.2466/pr0.1970.26.1.311
- Keating D.P., Bobbitt B.L. Individual and Developmental Differences in Cognitive-Processing Components of Mental Ability. Child Development, 1978. Vol. 49, no. 1, pp. 155–167. DOI:10.2307/1128604
- Kunda M., McGreggor K., Goel A.K. A computational model for solving problems from the Raven’s progressive Matrices intelligence test using iconic visual representations. Cognitive System Research, 2013. Vol. 22, pp. 47–66. DOI:10.1016/j.cogsys.2012.08.001
- Miller F.M., Raven J.C. The influence of positional factors on the choice of answers to perceptual intelligence tests. British Journal of Medical Psyuchology, 1939-1941. Vol. 18, pp. 35–39. DOI:10.1111/j.2044-8341.1939.tb00706.x
- Qiu C., Hatton R., Hou M. Variations in Raven's Progressive Matrices scores among Chinese children and adolescents. Personality and Individual Differences, 2020. Vol. 164, no. 1, pp. 110064. DOI:10.1016/j.paid.2020.110064
- Raven J.C. The RECI series of perceptual tests: An experimental survey. Psychology and Psychotherapy: Theory, Research and Practice, 1939. Vol. 18, no. 1, pp. 16–34. DOI:10.1111/j.2044-8341.1939.tb00705.x
- Raven J.C., Waite A. Experiments on physically and mentally defective children with perceptual tests. Psychology and Psychotherapy: Theory, Research and Practice, 1939. Vol. 18, no. 1, pp. 40–43. DOI:10.1111/j.2044-8341.1939.tb00707.x
- Raven J.C. Matrix tests. Mental Health, 1940. Vol. 1, no. 1, pp. 10.
- Redick T.S. Working memory training and interpreting interactions in intelligece interventions. Intelligence, 2015. Vol. 50, pp. 14–20. DOI:10.1016/j.intell.2015.01.014
- Sigel I.E. How intelligence tests limit understanding of intelligence. Merrill-Palmer Quarterly of Behavior and Development, 1963. Vol. 9, no. 1, pp. 39–56. DOI:23082735
- Structure and coherence of reasoning ability in Down Syndrome adults and typically developing children / Natsopoulos D. [et al.]. Research in Developmental Disabilities, 2002. Vol. 23, pp. 297–307. DOI:10.1016/S0891-4222(02)00088-4
- Superior fluid intelligence in children with Asperger’s disorder / Hayashi M. [et al.]. Brain and Cognition, 2008. Vol. 66, no. 3, pp. 306–310. DOI:10.1016/j.bandc.2007.09.008
- Thissen D.M. Information in wrong responses to the Raven Progressive Matrices. Journal of Educational Measurement, 1976. Vol. 13(3), pp. 201–214. DOI:1433734
- Van Herwegen J., Farran E., Annaz D. Item and error analysis on Raven's Coloured Progressive Matrices in Williams syndrome. Research in Developmental Disabilities, 2011. Vol. 32, no. 1, pp. 93–99. DOI:10.1016/j.ridd.2010.09.005
- Vodegel Matzen L.B.V., Van der Molen M.W., Dudink A.C. Error analysis of Raven test performance. Personality and Individual Differences, 1994. Vol. 16, no. 3, pp. 433–445. DOI:10.1016/0191-8869(94)90070-1
- Working memory, attention control, and the N-back task: A question of construct validity / Kane M.J. [et al.]. Journal of Experimental Psychology learning Memory and Cognition, 2007. Vol. 33, no. 3, pp. 615–622. DOI:10.1037/0278-7393.33.3.615
- Zhuo T., Kankanhalli M. Solving Raven's Progressive Matrices with Neural Networks. Computer Science, 2020. arXiv:2002.01646.
Information About the Authors
Metrics
Views
Total: 565
Previous month: 15
Current month: 6
Downloads
Total: 177
Previous month: 9
Current month: 3