Social Psychology and Society
2018. Vol. 9, no. 4, 33–46
doi:10.17759/sps.2018090404
ISSN: 2221-1527 / 2311-7052 (online)
Pedestrians’habits while crossing the road at a former zebra crossing
Abstract
This paper presents research results focused on pedestrians’ crossing behaviour, the role of habit and routine route choice, pedestrians’ perceived safety and comfort, preferences, and waiting times. Data was collected and analysed using rapid on-site interviews with pedestrians, on-site observations and video recordings. The results indicate that vulnerable pedestrians choose different crossing strategies: waiting for a driver to give way to them rather than waiting for a safe gap to pass, and require a much more cooperative approach from drivers than other pedestrians. The results of the study lead to the conclusion that the removal of the crossings reduced pedestrians’ perceived safety and comfort, on the other hand, their awareness has been raised. While adult pedestrians can cope with the new situation relatively well and cross the road without major difficulties, the same does not apply to vulnerable road users.
General Information
Keywords: pedestrians; pedestrian crossings; vulnerable road users, pedestrian behaviour; pedestrian safety
Journal rubric: Empirical Research
Article type: scientific article
DOI: https://doi.org/10.17759/sps.2018090404
Funding. This work was supported by financial support for University research, carried out by Ministry of education Czech Republic, project No. FF_2018_019.
For citation: Sucha M. Pedestrians’habits while crossing the road at a former zebra crossing. Sotsial'naya psikhologiya i obshchestvo = Social Psychology and Society, 2018. Vol. 9, no. 4, pp. 33–46. DOI: 10.17759/sps.2018090404.
Full text
1. Introduction
Interaction between drivers and pedestrians is common in urban areas. Both groups’ needs and preferences differ. Pedestrians need and prefer to cross the road quickly, comfortably, and safely, while drivers prefer a fluent drive (avoiding braking and accelerating) and easy-to-read traffic situations. The differences in needs and the perception of the traffic situation (e.g. the lack of anticipation of other road users’ behaviour and the subjectively perceived safety or dangerousness of a situation) are one of the reasons which lead to road accidents, injuries, and deaths (especially among pedestrians).
This paper is based on two main assumptions: first, that road users’ behaviour is a consequence of situation-specific factors (besides human-specific factors such as motivation and personality), i.e. the behaviour can be mediated by shaping the factors which road users (both drivers and pedestrians) are exposed to rather than
influenced by directly; second, that road users, pedestrians in this case, are greatly influenced by habits and other psychological factors connected with routine decision making when making decisions about their choice of route.
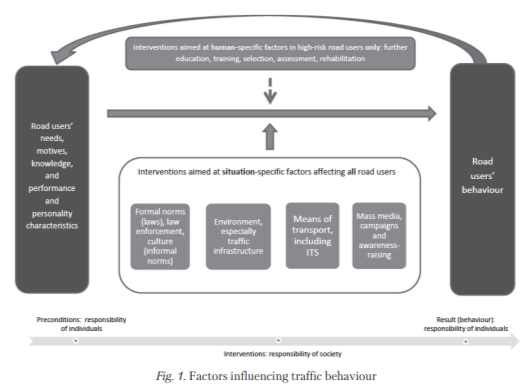
The underlying motives for pedestrians’ and drivers’ behaviour are their respective needs and preferences, including attitudes [19]. The needs and preferences are seen as the underlying motives, i.e. something that is given and highly workable. It is desirable that the needs and preferences are understood and the situation-specific factors are used to ensure that they are satisfied through safe behaviour. The situation-specific factors which we can have a direct influence upon involve the formal rules governing trafficspecific behaviour (laws), the enforcement of such rules, means of transport (vehicles in this case), the traffic environment, and the culture of a country or a region, including informal rules, expectations, conventions, and campaigning. This is illustrated in Figure 1. Given the focus of this paper, the traffic environment is the key factor.
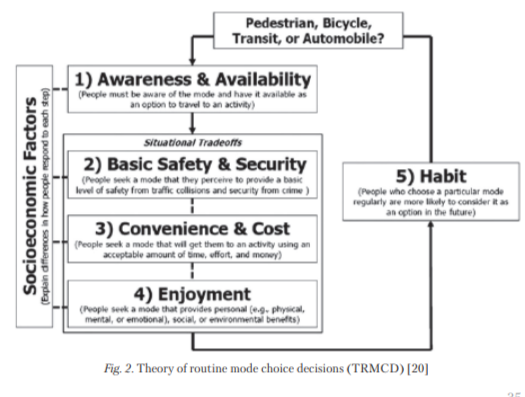
The second approach to decision making concerning routine route choice is explored using the theory of routine mode choice decisions [20], which includes the Awareness and Availability, Basic Safety and Security, Convenience and Cost, Enjoyment, and Habit factors (Figure 2). Given the focus of this paper, habit is the key factor here.
Our research focused on the description of the needs, preferences, and perceived safety, and the role of habits and other factors connected with routine behaviour on the part of pedestrians who cross a busy road in places where there were formerly pedestrian crossings which were removed because they did not conform to the latest safety regulations. We examined the needs and preferences (as underlying motives), the effect of the infrastructure (i.e. the modification involving the removal of the pedestrian crossings), and behaviour (as a consequence). In terms of the TRMCD model, we examined the psychological factors influencing routine route choice, especially the influence of habits.
We build on the theory of human needs and maximum gain, in terms of the structuring of human needs and the effort to maximise gain, the theory of habits and its influence on behaviour and changes in behaviour [7; 16], in terms of the influence of habits which persist despite environmental changes (the removal of crossings in this case), pedestrians’ needs and preferences — safety (subjective), comfort, easiness (flow), aesthetics, and the social environment [6; 12], pedestrians’ preference for the shortest way [4; 10], perception of safety — subjective safety vs. objective safety [1; 25], in terms of pedestrians’ false sense of safety on marked pedestrian crossings, and the risk homeostasis theory and awareness [26], in terms of pedestrians tending to adjust their behaviour in order to set a reasonable level of risk rather than minimising it. In addition, we draw on the information about drivers’ yielding behaviour (factors which have a bearing on drivers’ willingness to give way to pedestrians), waiting times (factors which influence pedestrians’ willingness to wait until it is safe to cross the road), and pedestrians’ comfort (factors which influence pedestrians’ satisfaction) [2; 9; 8; 13; 14; 21].
The present research study seeks to add to the current knowledge and empirical evidence concerning pedestrians’ behaviour in situations involving sudden changes in external conditions, specifically the traffic infrastructure, i.e. the removal of crossings. We attempt to answer the question about the extent to which pedestrians adapt their behaviour in terms of engaging in desired behaviour, i.e. using a crossing at another new location, or the extent to which they keep to their previous behaviour, which can be considered routine or habit-based. Our research pays special attention to vulnerable road users, as they comprise a group of road users who may be particularly jeopardised by the change. In line with the existing literature [3; 11; 23; 24], we hold that all the standards and regulatory measures must be established in such a way as to reflect the needs of those who are most vulnerable. In this particular case, these include those individuals who take the longest to cross the road, need the greatest amount of time to make decisions, and have the smallest range of vision (and are the most difficult to see), i.e. children, older persons, the physically handicapped, or mothers with prams.
In addition to safety, we find the aspect of pedestrians’ comfort and convenience very important. Cities should be good places for living, where all the inhabitants feel comfortable and safe. Moreover, if elements of the traffic infrastructure (pedestrian crossings in our case) are designed in such a way as to meet pedestrians’ needs and make them feel safe, there is a good chance of pedestrians using them and engaging in behaviours which are desired and safe. Therefore, our research also addresses 36
the question of pedestrians’ subjective feeling of safety while crossing the road, both under the new circumstances (after the crossings have been removed) and prior to the removal of the crossings. Also looking into their preferences, we examine whether they preferred the situation before the adjustment, i.e. when there was a crossing on the road (albeit one that was unsuitable and unsafe according to the standard), or after the crossing had been removed.
The outcomes of the research are intended particularly for traffic experts who are concerned with the planning and implementation of traffic infrastructures in urban areas, especially with regard to pedestrians. They can provide useful information about the ways in which to proceed when changes in the infrastructure are required (especially at short notice). Such changes should be introduced in such a way as to ensure that pedestrians choose the desired behaviour and that the adjustment as a whole has no negative impact on traffic safety, i.e. it makes it possible to take account of the influence of the human factor (especially that of pedestrians’ habits and needs in this case) on the prospective effect of the infrastructural modification.
The recent literature [17; 18; 22] and the available empirical data cover especially the technological aspects of pedestrians’ behaviour: i.e. they describe the ways in which the traffic infrastructure influences the behaviour of pedestrians. In order to obtain a more profound understanding of the causes of pedestrians’ behaviour, however, it is necessary to investigate what lies behind specific behaviours, i.e. what the pedestrians’ motives, needs, and preferences are and in what ways their behaviour is influenced by their routines and habits. Only if we understand these aspects can we effectively prepare and implement interventions which will actually lead to a change in pedestrians’ behaviour. In research, these aspects are generally explored using interviews with pedestrians or questionnaires. The present study included interviews with pedestrians.
The basic questions we sought to find the answers to were these:
“What are the needs and preferences of pedestrians, especially vulnerable road users, in this area concerning crossing the road?”
“How do habits and routines influence the choice of crossing behaviour in a situation of a change in the infrastructure, i.e. will pedestrians choose a new route using a new crossing, or will they cross the road at the site of the former crossing?
“Have pedestrians changed their behaviour in response to the change in the infrastructure?
“Do pedestrians feel safer and more comfortable under the new conditions (with the crossings removed) or did they feel safer and more comfortable before the crossings were removed?
Our research focused on pedestrians’ needs, motives, and feelings, both before and after the infrastructural modification (the removal of the crossing). We also described pedestrians’ current behaviour and their choice of the method and place at which they crossed the road (as well as the subsequent behaviour of drivers) under the new conditions following the infrastructural change (the removal of crossings).
The paper is divided into four main sections: Introduction, Methods, Results, and Conclusions and Recommendations. The Results section is broken down into subsections according to the research aims.
2. Methods
In August 2015 the owner of the road (the state administration) removed (at the request of the police) all pedestrian crossings from Hodolanska, a street in the Czech city of Olomouc. Altogether, there were five marked unsignalised pedestrian crossings (the street is approx. 1 km long). The reason was that these crossings were not in line with the applicable safety guidelines, i.e. not safe (and the local municipal authority did not provide funds to renovate them). It was a sudden decision, with no previous (or subsequent) information campaigns. Two weeks later, one signalised (provisional) crossing was set up. Situated in a suburban area, Hodolan- ska is 1 km long, with a high volume of motor traffic, including trams and heavy vehicles. In the last three years two crashes involving pedestrians (no fatalities, one case involving injury and damage) have occurred there.
Data was collected and analysed using rapid on-site interviews [5] with pedestrians crossing the street (focused on their needs, motives, and perceived safety) and video recordings (behaviour and scene: where they crossed, gap/yielding, waiting time, number of cars passed, disturbances — running, braking).
The interviews with pedestrians featured the following questions:
1. Do you feel safe when crossing the road here?
2. Was it a good idea to remove the crossings? Is it better now or was it better when the crossings were here?
3. Did the removal of the crossings mean any change for you? Do you cross the road differently than when the crossing was here? If so, what is the difference?
4. What do you think the municipal authority should do? How should this situation be dealt with?
As part of the interviews, pedestrians were asked to express their opinions about the current situation (after the removal of the crossings) and the situation prior to the removal of the crossings.
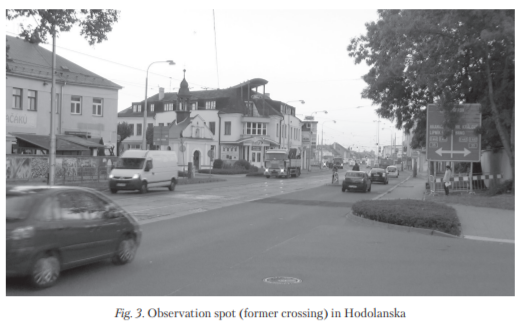
One of the former crossings and its surroundings (» 50m in both directions) was chosen as the observation spot. The new signalised crossing was about 200 metres away (Fig. 3).
The observations took place one month after the change (the removal of the crossings); altogether there were 15 hours of observation (within one week, Tuesday, Wednesday, Thursday, times: 7.00—9.00, 13.00—14.00, 16.00—18.00).
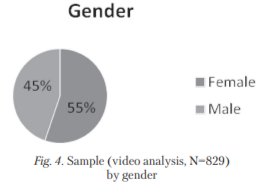
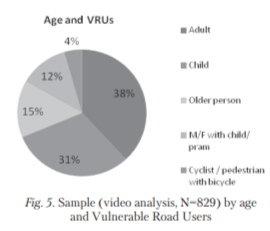
The study sample was defined as including all the pedestrians within the range of the camera recorded during the observation times or all the pedestrians who were willing to give an interview (all the pedestrians within observation time and range were asked to). Overall, the study sample came to N=325 for the interviews (all the pedestrians willing to be interviewed within the time and space under observation, » 1/3 of them all), and N=829 for the video analysis (all the pedestrians captured on camera during the observation times). Children were defined as individuals aged 0—14 and older persons as individuals aged 65 or more. The charts below (Figure 4 and 5) describe the sample by gender, age, and Vulnerable Road Users (VRUs).
The results are presented in five sections: 1. Description of the scene, 2. Waiting time, 3. Crossing behaviour, 4. Potential hazard situations, and 5. Needs and preferences of the pedestrians.
As shown in the tables below (Tables 1—2), most of the pedestrians were on their way to school or work. They cross the street there regularly (87% of them). The mean speed of the passing cars was 28.09 km/h (in both directions, SD 8.65). Within one day (24 hours) 16,344 cars were recorded as passing the observation point in one direction.
The waiting time was measured using a video recording and analysis of the number of seconds pedestrians had to wait before proceeding to cross the road (various alternatives — e.g. no car present, a driver giving way to a pedestrian, waiting for a safe gap, etc.) and the number of cars passing before a pedestrian crossed the road. As shown in Figure 6, in most cases pedestrians did not wait (no car was present); the shares in the chart decline as the waiting time rises. A total of 6% of all the pedestrians under observation waited for more than 21 seconds. Generally, these waiting times (up to 20 seconds) are rather short according to the literature [13, 15]. More importantly, waiting times and drivers’ yielding behaviour differ considerably among different road users, as shown below.
Table 1
Purpose of the trip
|
Where are you going? |
% |
|
Work |
26.19% |
|
School |
42.46% |
|
Leisure/walk |
6.75% |
|
Other |
24.21% |
Table 2
Speed of passing cars
|
Speed |
|
|
Mean speed (km/h) |
28.09 |
|
SD (km/h) |
8.65 |
|
Max. speed (km/h) |
76 |
|
Min. speed (km/h) |
8 |
|
N (number of observations) |
10,114 |
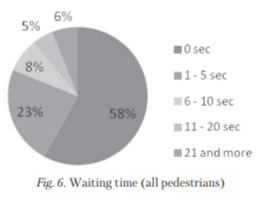
Table 3 shows the waiting times according to different types of pedestrians — adults, children, older persons, mothers (or fathers) with children or prams, and cyclists. We suggest using the mean waiting time for adults and the number of passing cars, i.e. 3.28 seconds (SD 8.86) and 2.01, respectively (SD 2.25), as the baseline. For older persons and pedestrians with children or prams, significantly lower waiting times were observed. This may be due to the fact that drivers tend to be more willing to give way to these groups of pedestrians. On the other hand, children’s waiting times are twice as long as adults’. This can be interpreted by children looking for bigger safe gaps (while drivers are not willing to give way to them as in the case of older persons or pedestrians with children) before crossing because of their lack of experience and lower cognitive abilities.
The observing radius was one of the former crossings and the area within approximately 50 metres in both directions (along the road — to the right and to the left). We found (on-site observations, total number of observations 829) that the majority of the pedestrians in this area crossed the road at the site of the former crossing (N = 498, 60%), about one third (N = 248) crossed the road on their way to the nearby tram stop (i.e. they were heading for the refuge island with the tram stop and did not in fact finish crossing the whole road), and 10% (N = 83) crossed somewhere else. The reason for the majority crossing on the site of the former crossing may have been a habit (they are used to doing it this way) which persists even after the removal of the crossing, and also the infrastructure, which leads pedestrians to this place intuitively (even though the zebra markings have been erased).
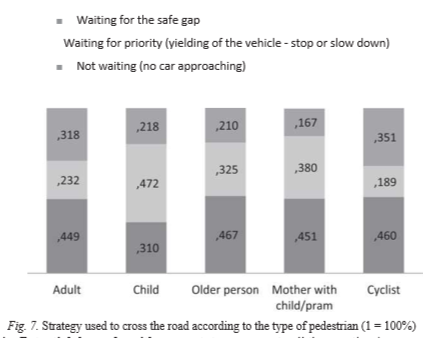
Figure 7 shows different strategies used to cross the road according to who is crossing the road. Taking “adults” as a reference point, we can see that they are most likely to wait for a safe gap (32%), followed by their waiting for a driver to give way (23%). However, this does not hold for other groups of pedestrians: children, older persons, and pedestrians with children are more likely to wait for drivers to give way to them rather than waiting for a safe gap. This makes these groups of pedestrians even more vulnerable, as their safety and comfort is more dependent on the behaviour of drivers (which is often reckless). We can also observe significantly smaller frequencies of not waiting/no car approaching in the group of children. The explanation for this may be that children need bigger safe gaps and more time to make the decision to cross (and feel safe), so the cases when no car is approaching are less frequent (as even when a car is reasonably far away, children wait for the driver to give them priority).
Table 3
Waiting time and number of passing cars according to the type of pedestrian
|
|
No of cars passing (mean) |
SD |
Seconds waiting (mean) |
SD |
N |
|
Adult |
2.01 |
2.25 |
3.28 |
8.86 |
316 |
|
Child |
3.07 |
2.91 |
6.17 |
8.94 |
252 |
|
Older person |
1.85 |
2.24 |
2.86 |
9.32 |
120 |
|
Mother with a child/pram |
1.47 |
1.09 |
1.76 |
3.83 |
102 |
|
Cyclist |
2.02 |
2.7 |
4.37 |
12.49 |
37 |
3.4. Potential hazards with respect to traffic safety
On the basis of all the observed situations, i.e. all the pedestrians crossing the road (within the observation range) during the observation times (n = 829), we identified 52 situations (6.3%) which we evaluated as potential hazards with respect to traffic safety (Figure 8). In most cases, pedestrians had to go very fast or run (to avoid a conflict situation) or cars had to brake suddenly and very hard (to avoid a conflict situation).
3.5. Pedestrians’ needs and preference
The data on the needs and preferences of the pedestrians were collected using rapid on-site interviews. In a five-minute interview, pedestrians were asked about their feeling of safety, their preferences with respect to their comfort and safety when crossing the road, and their opinion about the recent changes (the elimination of the crossings). Out of all the pedestrians asked for an interview (n = 829), 325 agreed (although not all of them provided answers to all the questions).
As shown in Table 4, the great majority of the pedestrians did not feel safe when crossing the road at the selected location. The most common reasons and complaints mentioned were as follows: too many cars,
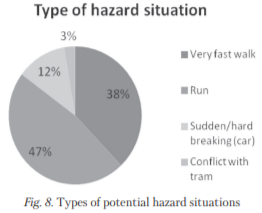
Fig. 8. Types of potential hazard situations
cars not respecting or giving priority to pedestrians....”I feel like an ant about to be smashed by a car”...,”I feel afraid here (e.g. of being hit by a car, being killed)” ...’’People don’t like to cross here, they fear for their lives”., the absence of the crossing, being afraid for others (their children; elementary school nearby)... “I’m afraid for my children who walk here on their way to school”.., dangerous for mothers with prams and disabled persons.. “I walk with crutches and drivers won’t let me cross”.., too wide a road/a long time to get to the other side.
Table 4
Subjective feeling of safety
|
Do you feel safe when crossing here? |
Frequencies |
% |
|
Yes |
18 |
5.54% |
|
No |
303 |
93.23% |
Almost all (320 out of 325) the pedestrians thought it had been safer and more comfortable before the crossings were removed. These were the most common statements: “It was a stupid thing to remove the crossings.”; “It was better with the crossings, I would like to have them back.”; “I’m really afraid here; moreover, a lot of children walk here.”; “People were used to them.”; “I really don’t understand the reason for removing them.”; “Too many cars, drivers don’t give way.”; “I used to let the children go to school here, but now I walk them to school.”, or “I don’t care; it probably had to be done — as those crossings were not safe.”
As for their habits and patterns of crossing the road, 54% of all the pedestrians who were interviewed (N = 176) have not changed their ways of crossing the road — they cross the road at the former crossing, and state that:
• they are used to crossing here and won’t change,
• they feel less safe,
• they wait longer,
• they pay more attention (check carefully for approaching cars, walk more quickly..),
• and hope that cars will give way.
The others (N = 149) have changed their patterns and mostly use the signalised crossing (the new one), which is not far away (200m). Some of them use tram stop islands to cross (segmenting their crossing manoeuvre into several stages). Some stress that they are able to cross even without the crossings, although admitting that it must be complicated for children and older and disabled persons.
The last question focused on the pedestrians’ opinion on what the municipal authority should do to address the issue of pedestrians in this area. The great majority of the respondents just answered that the municipal authority should restore the crossings where they were without any changes (there were no complaints about safety issues when the crossings were at their original locations). Some of them suggested setting up signalised crossings (with traffic lights) or renovating the crossings so that they comply with the norms (“.the municipality should find the money to do that.”), or “.add humps, add additional signs — especially those alerting drivers about the presence of children .”
4. Conclusions and recommendations
The results of the study lead to the conclusion that the removal of the crossings reduced pedestrians’ perceived safety and comfort. On the other hand, their awareness has been raised. We can observe significantly lower waiting times for older persons and pedestrians with children or prams. Drivers seem to be more willing to give way to these groups of pedestrians. On the other hand, waiting times among children are twice as long as those among adults. This can be interpreted as children being less experienced and possessing lower cognitive abilities and thus looking for bigger safe gaps to cross. The most frequent strategy the adults use to cross is to wait for a safe gap, followed by waiting for a driver to give way. This is not true for other groups of pedestrians — children, older persons, and pedestrians with children are more likely to wait for drivers to give way to them rather than waiting for a safe gap. The residents tend to stick to their old patterns and cross on the site of the former crossing, eventually finding an “innovative“ solution (tram stop islands) instead of using the new signalised crossing (too far). The pedestrians do not perceive the (former) non-standardised crossings as having been unsafe. The greatest impact (negative) is on children, the elderly, and disabled persons (Vulnerable Road Users). The main finding of our research is the difference in the perception of safety and the great diversity in the needs of different groups of road users. While adult pedestrians can cope with a new situation (the removal of the crossing) relatively well and cross the road without major difficulties, the same does not apply to vulnerable road users, especially children, older persons, and mothers with prams. Therefore, and following the principle that all the traffic infrastructure should be designed and implemented in such a way as to reflect the needs of the most vulnerable, any measures (the removals of the crossings, in this case) must involve a comprehensive assessment of the situation from the perspective of those with greater needs (i.e. needing the longest time to cross the road or make a decision or having cognitive abilities that are not fully developed yet or have already deteriorated) and those who are the most physically fragile or the most difficult to see because of their small size rather than from the point of view of an “average pedestrian”.
In terms of practical implications, it is recommended that before any change is made tests should be performed of the extent to which the infrastructure under consideration is being used by vulnerable road users, what their needs and capabilities are, and, in particular, the degree to which these differ from the needs and capabilities of “average” road users. It is further recommended that infrastructural measures aimed at ensuring the safety of vulnerable road users should include the strict enforcement of a low speed at the location, the implementation of low-cost measures to enforce giving way (on the part of drivers), and awareness raising (on the part of both drivers and pedestrians).
In addition, it is necessary to provide reasonable notice in the communication of the prospective change and allow for road users keeping to their usual old ways for some time because of their persistent habits. To address the persistent habits and promote the better acceptance of an infrastructural change, we recommend the following specific measures: to provide reasonable notice when communicating the prospective change (three months before the change is carried out) using channels which have the potential to reach all the relevant road users and to get the relevant road users involved in the preparation of the change and decision making. Besides providing factual information (what will be changed), it is also necessary to communicate the desired (safe) behaviour, as well as pointing out the reasons for the change and the benefits it will generate. In the first days following the change, staff (ideally a representative of the implementing agency and a police officer) should be physically present at the location to provide guidance and explanation in relation to the change and the desired behaviour. A certain amount of leeway must be allowed for before road users adopt new behaviour (approximately three months). During that period, transitional safety-enhancing measures, such as a temporary speed limit, may be introduced. After that period (3—6 months) has elapsed, an evaluation study should be conducted to examine the actual behaviour, opinions, and attitudes of road users and evaluate the success of the measure.
Funding
This work was supported by financial support for University research, carried out by Ministry of education Czech Republic, project No. FF_2018_019.
References
- Björklund G. Driver Interaction — Informal rules, Irritation and Aggressive Behaviour. Digital Comprehensive Summaries of Uppsala Dissertations from the Faculty of Social Sciences 8. Sweden: Uppsala Universitet, 2005. 44 p.
- Bjornskau T. Why are the safest norms, attitudes and types of behavior not typical for the safest drivers? Transport Reviews, 1996. Vol. 16, pp. 169—181.
- Borst H.C., Miedema H.M., de Vries S.I., Graham J.M.A., & van Dongen J.E.F. Relationships Between Street Characteristics and Perceived Attractiveness for Walking Reported by Elderly People. Journal of Environmental Psychology, 2008, Vol. 28, pp. 353—361.
- Broach J. Where Do People Prefer to Walk? A Pedestrian Route Choice Model Developed from GPS Data [Electronic resource]. URL: http://activelivingresearch. org/where-do-people-prefer-walk-pedestrian-route-choice-model-developed-gps-data (Accessed 21. 8. 2015).
- Creswell J.W., Hanson W.E., Plano V.L.C., & Morales A. Qualitative research designs: selection and implementation. Counselling Psychology, 2007. Vol. 35, pp. 236—264.
- Dahlstedt S. The SARTRE-tables. Opinions about Traffic and Traffic Safety of Some European Drivers. (VTI Report No. 403/403A). Linkoping, Sweden: VTI, 1994.
- Diaz E.M. Theory of planned behavior and pedestrians’ intentions to violate traffic regulations. Transportation Research Part F, 2002. Vol. 5, pp.169—175.
- Fitzpatrick K., Turner S.M., Brewer M., Carlson P.J., Ullman B., Trout N.D., ... Lord D. Improving Pedestrian Safety at Unsignalized Crossings: Appendices B to O (No. NCHRP Project 3-71). [Electronic resource]. 2006. URL: https://nacto.org/wp-content/uploads/2010/08/NCHRP-562-Improving-Pedestrian-Safety-at-Unsignalized- Crossings.pdf (Accessed 21. 8. 2015).
- Gårder P. E. The impact of speed and other variables on pedestrian safety in Maine. Accident Analysis & Prevention, 2004. Vol. 36, pp. 533—542.
- Griffiths J.D., Hunt J.G., Marlow M. Delays at pedestrian crossings. 1. Site Observations and the Interpretation of Data. Traffic Engineering & Control, 1984. Vol. 25, pp. 365—371.
- Gunnarsson O. Strategies for Creating a Pedestrian-friendly City. Outline to a final report, COST C6 Town and Infrastructure Planning for Safety and Urban Quality for Pedestrians. 2001.
- Hakamies-Blomqvist L. General problems of pedestrians and cyclists. WAL-CYNG Internal report I, No 3. 1997.
- Hamed M.M. Analysis of pedestrians’ behavior at pedestrian crossings. Safety Science, 2001. Vol. 38, pp. 63—82.
- Hydén C., Nilsson A., & Risser R. WALCYNG. How to enhance WALking and CYcliNG instead of shorter car trips and make these modes safer. [Electronic resource]. European Commission, Transport RTD programme, 4th framework. Project WALCYNG. 1998. URL: https://safety.fhwa.dot.gov/ped_bike/docs/walcyng.pdf. (Accessed 21. 8. 2015)
- Knoblauch R., Pietrucha M., & Nitzburg M. Field studies of pedestrian walking speed and start-up time. Transportation Research Record, 1996. Vol. 1538, pp. 27—38.
- Lally P., Van Jaarsveld C.H., Potts H.W., & Wardle J. How are habits formed: Modelling habit formation in the real world. European Journal of Social Psychology, 2010. Vol. 40, pp. 998—1009.
- Øvstedal L., Barham P., Jones S., & Øderud T. Indicators describing the accessibility of urban public transport. D2.2 Mediate project. 2010. [Electronic resource]. URL: http://www.transport-research.info/sites/default/files/project/documents/D2.2%20 Indicators%20for%20accessibility%20of%20urban%20public%20transport_0.pdf. (Accessed 21. 8. 2015)
- PROMISING. Measures for pedestrian safety and mobility problems. Final report of Workpackage 1 of the European research project PROMISING (Promotion of Measures for Vulnerable Road Users). Athens: National Technical University of Athens NTUA, 2001. 97 p.
- Ronis, D.L., Yates, J.F., Kirscht, J.P. Attitudes, decisions, and habits as determinants of repeated behavior. Attitude structure and function, 1989, pp. 213—239.
- Schneider R.J. Theory of routine mode choice decisions: An operational framework to increase sustainable transportation. Transport Policy, 2013. Vol. 25, pp. 128—137.
- Schroeder B., et al. Empirically-Based Performance Assessment & Simulation of Pedestrian Behavior at Unsignalized Crossings. Final report, STRIDE project. 2014. [Electronic resource]. URL: https://ntl.bts.gov/lib/55000/55300/55329/Schroeder_ STRIDE_2012-016S_Final_Report.pdf. (Accessed 21. 8. 2015)
- Steg L., de Groot J., Forward S., Kaufmann C., Risser R., Schmeidler K., Martincigh L., & Urbani L. Assessing Life Quality in Transport Planning and Urban Design. 2007. In: S. Marshall & D. Banister (Eds.), Land Use and Transport — European research towards integrated policies. Oxford: Elsevier, pp. 217—243.
- Steiner R., Cirder L., & Betancourt M. Safe Ways to School — The role in multimodal planning. Florida Department of Transportation Systems Planning Office. 2006. [Electronic resource]. URL: http://www.narc.org/uploads/File/Transportation/ Library/SafeWaystoSchool.pdf. (Accessed 21. 8. 2015).
- Thomas C. (Ed.). Shared Surface Street Design: Report of focus groups held in Holland. Hillfields: The Guide Dogs for the Blind Association. 2006. 44 p.
- Vlakveld W. Subjectieve verkeersveiligheid, wat is het en wat kunnen we ermee? Verkeerskunde, 2009. Vol. 60, pp. 50—53.
- Wilde G.J. The theory of risk homeostasis: implications for safety and health. Risk Analysis, 1982. Vol. 2, pp. 209—225.
Information About the Authors
Metrics
Views
Total: 1284
Previous month: 8
Current month: 3
Downloads
Total: 653
Previous month: 1
Current month: 1