Introduction
Today, both the human factor and the professional training are considered as the main causes of critical situations arising from the work of operators of complex technical systems, including aircraft pilots. In particular, despite the fact that a pilot takes part in the aircraft control process only several minutes during each flight hour on the average, the number of accidents caused by the crew errors is up to 65%. At the same time, their impacts will become even more significant in the future, thanks to a number of trends, such as increasing the level of functionality, automation and aircraft intellectualization.
Up to the present, the human factor and its impacts on the development of critical situations in flight are not sufficiently taken into account during the cockpit design and in flight crew training. The past approach to this factor accounting, as a rule, was based on the analysis of incident statistics only, which is its principal drawback. In its turn, flight training programs have been usually based on subjective observation and post-flight analysis by the instructor to assess proficiency and maneuverability. As a result, existing methods and recommendations which take into account the human factor were focused only at changes in the procedure of flight crew training itself and operation of poorly designed systems and devices that does not allow quantifying the risks in specific flights and detecting critical values of factors that contribute to dangerous flight situations.
However, in recent years, the leading flight simulator manufacturers have begun to develop methods for measuring situational awareness and perception of the pilot cognitive load using biometrics [Borghini, 2014; Tran, 2020]. The goal is to capture what is the pilot response to different scenarios implemented via a flight simulator. Nevertheless, this work is at the initial stage of its development.
Contemporary challenges make it topical to develop the relevant methods for assessing the operator or crew skills and condition. The main activity direction is the assessment based on the results of work on modern simulators and benches, where it is possible to repeat the special conditions of pilots’ work easily enough. The problem to be overcome is, firstly, in the lack of acceptable mathematical models and methods, and, secondly, in the lack of effective and reasonable means of assessing the skill level and conditions of crews, as well as means to reduce the risks caused by these conditions.
Comparing the main currently applied approaches to assessing the conditions of technical system operators (for example, aircraft pilots) using such characteristics as:
— non-invasiveness
— the ability to measure and analyze with reliable diagnostic conclusions
— impossibility of correcting indicators with the help of medications
— sensitivity to changes in the pilot psychophysiological state
— sensitivity to the level of cognitive load
— absence of measurement influence on pilot actions and conditions
— invisibility of measurements for pilots, etc., \
— made it possible to conclude that currently the most promising and valid means of assessing the condition are non-invasive technologies based on the analysis of the characteristics of the distribution of visual attention (video oculography and assessment of parameters of gaze motor activity), with non-contact technical means — eye trackers being used to register the movement of the pilot gaze, which make it possible to exclude subjective assessment of the pilot’s condition indicators [6; 10—13]. To a lesser extent, infrared thermometry and speech analysis may be also included into consideration; however their real practical application looks unpromising.
Considering this area, the complete overview of classical techniques for analyzing video oculography data is presented in [Barabanschikov, 2013], the relevant promising contemporary approaches are considered in [Kuravsky, 2021a1], the promising future ones are given in [Kuravsky, 2021b].
Basing on the results obtained, it was concluded that video oculography data could be used for creating quantitative criteria to reveal dangerous operator states or behavior, with the approaches being discussed and combined. The analysis that was carried out also revealed that:
— There are highly statistically significant integral influences of the stress factor on the relevant observed oculomotor activity primary indices
— The more difficult the flight stage implementation, the stronger the integrated differences in oculomotor activity primary indices and their shifts between the pilot samples of interest.
Nevertheless, given the complexity and features of the problem under consideration, video oculography data are not sufficient to obtain acceptable practical results, and essential involvement of the brain activity characteristics for analysis is desirable. Among the first results in this field are data obtained by A. F. Iznak in the 1970s [Iznak, 1989], but the powerful experimental, mathematical and software tools currently used were not available that time, which gives prospects for continuing such a work now at a significantly higher technical and mathematical level.
Presented here is the approach to assessing the operator condition according to video oculography data and parameters of brain alpha rhythms by modeling the neural activity. It is based on the concept that is in use at the traditional structural equation modelling, viz.: to assess the latent characteristics which are not available for direct measurements basing on the observed ones. Since the simplest connections between latent and observed parameters did not allow solving the difficult problems in question, complex nonlinear models were applied for the first time. These models represent the brain neural activity properly implementing the convoluted dependencies in question in the differential form. As a result, the approach called the advanced structural equation modelling with differential connections between parameters has been formed.
Traditional structural equation modelling and its transformation the concept of the advanced structural equation modelling
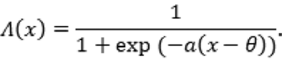
Principal components of the traditional structural equation modelling are presented in Figure 1.
A strictly determined factor model of the phenomenon under study is assumed. A factor model that connects latent and observed parameters is formed using knowledge about the application domain. The hypotheses concerning the model structure have to be based on the analysis of the investigated factors nature (that is to say, both theory and observations are taken into account) [Kuravsky, 2020a]. It is admissible to formulate quantitative assumptions concerning covariances/correlations between latent parameters as well as factor loadings. Free model parameters are calculated to get the best approximation of correlation (covariance) matrices for observed parameters (from the viewpoint of a given criterion).
Objects of the traditional structural equation modelling are correlation or covariance matrices for observed parameters. Analysis purpose is to find model parameters that explain variability of observations with acceptable errors.
Structural equation modelling has the following peculiarities:
-
Nonzero (free) factor loadings in the equations of model and number of investigated factors are defined in advance
-
Nonzero correlations between measurement errors are possible
-
Factor loadings and covariances between latent parameters can be free model parameters or be equal to the given constants
-
The analysis of several model groups is supposed
-
Possibility of checking hypothesises about model properties by selecting optimum values of free parameters
-
Estimations of free parameters can be determined by the maximum likelihood method.
Using the maximum likelihood method, the following statistic is to be minimized as a criterion for selection of free parameters:
F = [ln |Σ| – ln |S| + tr (SΣ–1) – m] (N – 1),
where S — sample covariance matrix for observed parameters, Σ — expected covariance matrix for observed parameters, |Σ| and |S| — determinants of matrices Σ and S, tr (SΣ–1) — trace of matrix SΣ–1, N — size of the sample used to calculate matrix S, m — number of observed parameters [Kuravsky, 2020a].
Elements of the expected covariance matrix are analytical expressions composed of free model parameters. In case of multivariate normalcy of observed parameters, values of the statistic F are described by a χ2 distribution.
Two typical model variants represented by the path diagrams are shown as examples in Figures 2 and 3, where latent parameters are indicated with ovals, and observed parameters are shown in rectangles. The covariance connections between latent parameters as well as their variances are drawn as double-headed arrows. Single-headed arrows represent causal influences of some parameters on others, which are simply summarized at the entry point.
In case of path coefficients factor models, expressions for covariances and variances of observed parameters Wi are non-linear:
Cov (Wi, Wj) = ΣΣ rklukiulj,
k l
Var (Wi) = ΣΣ rklukiulj,
k l
where k and l are factor numbers, u** — path coefficients, r** — correlations between factors. These non-linearities make it impossible to get simple direct unambiguous estimations of free model parameters of interest. As contrasted to this, in case of variance components factor models, similar expressions are linear:
Cov (Wi, Wj) = Σ Ckij,
k
Var (Wi) = Σ Vk + ΣΣ Ckl,
k k l
where k and l are factor numbers, V* — variances, C** and C*** — covariances between factors. Path coefficients in this model are equal to unity.
In case of the path coefficients factor models, to estimate the values of free model parameters it is necessary to solve numerically a sufficiently laborious local multivariate optimization problem by the iteration methods. In general case, this way results in impossibility of the global minimum estimation, since one of the possible local minima depending on its initial approximation is usually found. Consequently, the solution is ambiguous.
In case of the variance components factor models, it is possible to obtain direct estimations of free model parameters using the alternative variant of the structural equation modelling. Corresponding examples can be found in paper [Kuravsky, 2020a].
Simple summarizing parameters multiplied by path coefficients at an observed parameter entry point is a significant simplification that does not take into account the known complexities of human behavior. This argument is an obvious reason for generalizing the mathematical model of the phenomenon in question, one of the variants of which is presented below as the advanced structural equation modelling with the parameters connections described by differential equations.
Advanced structural equation modelling with differential connections between parameters
The model by H.R. Wilson and J.D. Cowan [Wilson, 1972; Wilson, 1974] considers the human brain as a network of neurons connected by synapses. When a neuron fires, a signal is sent to adjacent neurons. Activation of adjacent neurons occurs after synaptic delay. Neurons are divided into “excitatory” ones, giving a positive signal, and “inhibitory” ones, issuing a negative signal. The neuron is activated when the sum of the input values exceeds some threshold value. After “firing”, the neuron is insensitive to input signals for a certain time.
In accordance with the concept of the advanced structural equation modelling, the dependence between latent parameters is expressed with the aid of the following set of differential equations:
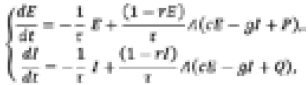
where E(t) is the rate of activation of “excitatory” neurons, I(t) is the rate of activation of “inhibitory” neurons, τ is the synaptic delay, P is the external excitation, Q is the inhibition, r is the insensitivity period, Λ(x) is the logistic function, viz.:
In response to variations of external excitation P and inhibition Q, this dynamical system suffers the supercritical Poincaré—Andronov—Hopf bifurcation. This bifurcation arises at the critical point where the system stability switches to a periodic behavior, or vice versa. In the other terms, it is a local bifurcation in which an equilibrium point in the dynamical system phase space changes stability, since a pair of complex conjugate eigenvalues resulted from this system linearization around the equilibrium point crosses the complex plane imaginary axis [Arnol’d, 1978]. Under reasonably generic assumptions about the dynamical system [Arnol’d, 1978], a limit cycle arises from or transformed to this equilibrium point.
Parameter assignments are the following:
— E(t), I(t), P, and Q are the latent parameters of interest, which represent the brain behavior but cannot be measured, these quantities being observed indirectly via other relevant characteristics,
— ce, ci, ge, gi, r, a, θ and τ are intrinsic parameters of the differential model, which are determined by personal characteristics, and, therefore, should be identified using empirical data for the samples of subjects involved separately.
Taking into account experimentally grounded interpretation of several relevant gaze movement activity primary indices, the latent parameters under study can be observed indirectly with the aid of certain relevant characteristics which are available for measurements, viz.:
— Relative changes of gaze movement entropies rY during the subject transition from calm activity to abnormal stressful response to dangerous circumstances can be used for monitoring external excitation P.
— Relative changes of gaze fixation durations rZ during the subject transition from calm activity to abnormal stressful response to dangerous circumstances can be used for monitoring inhibition Q.
The given relative changes are calculated as rY = Ystress / Ycalm, where Ycalm is the gaze movement entropy during the calm subject activity, Ystress is the same index after the subject transition to the abnormal stressful behavior of interest, and rZ = Zstress / Zcalm , where Z represents the gaze fixation duration in a similar way.
In detail, the choice of the selected indices is determined by the subsequent experimentally established facts. Specifically, the average time of recognition of the situation under study, as experimentally established [Kuravsky, 2021a], is directly proportional to the entropy of the distribution of the gaze in the area of the indicator. A decrease in this indicator indicates an increase in the efficiency of reading information from indicators. In general, the criterion evaluates the duration of reading information from the indicator, taking into account its distribution over areas of interest and the actions of the pilot accompanying the reading, including the decision-making time (as a rule, until the decision is made). As for the gaze fixation durations, in general, this characteristic estimates the duration of reading information from the indicator and the actions of the pilot accompanying the reading, including the time for making decisions (as a rule, until a decision is made) [2—4]. This quantity here is assumed to be proportional to the inhibition.
In its turn, appearance of the bifurcations for the dynamical system under study can be observed directly by monitoring the human brain alpha-rhythm frequencies evaluated with the aid of the available electroencephalography equipment. Thus, the above relative changes of gaze movement entropies and gaze fixation durations as well as the human brain alpha-rhythm frequencies, can be considered as the observed parameters representing the dynamical system behavior in question via the given empirical data.
Some of the above intrinsic parameters represent individual features. Their values can be identified on samples of subjects divided according to various criteria, with revealing their specific levels for each subsample. Such identification can be tied to the alpha-rhythm frequencies of subjects from various subsamples, with are used as empirical data to which latent parameters should be bound. Taking into account non-linearity of the given dynamical system and its resulting complex behavior, the identification in question can be implemented using the exhaustive search method with a specified step for the possible ranges of the relevant parameters.
The human brain alpha-rhythm frequencies are well known to lie in the range from 8 to 13 Hz. The actual typical values for r and a are 1 and 1.7, correspondingly (no need to identify them). If time is measured in seconds, the actual typical ranges of the other parameters to be identified are as follows: 15 ≤ ce ≤ 20, 14 ≤ ci ≤ 30, 19 ≤ ge ≤ 25, 19 ≤ ge ≤ 25, 1.8 ≤ gi ≤ 3.5, 3 ≤ θ ≤ 5, 0.02 ≤ τ ≤ 0.07.
Special software has been developed both for calculating the dynamical system behavior (that is, for calculating E(t) and I(t)) and for identifying its above intrinsic parameters (Figures 4 and 9).
Initially, external excitation P and inhibition Q are to be identified the same way as the above intrinsic parameters for each subject subsample of interest, however then these quantities have to be studied in order to determine their bifurcation values with the aid of the above special software. Simultaneously, the above relative changes of gaze movement entropies and gaze fixation durations, which separate the subjects under study in different circumstances of interest, are determined by means of relevant experiments in relation to the presence or absence of alpha rhythms and their frequencies. These separation points are matched to the bifurcation values of the external excitation and inhibition. In rough approximation, in the vicinity of these bifurcation values, linear dependence between the latent parameters and gaze movement activity primary indices is supposed, viz.:
kYP = rY – 1, when Q = const,
kZQ = rZ – 1, when P = const,
where kY and kZ are empirical factors. Obviously, with the accumulation of empirical data, these dependencies should be clarified and refined.
Dependencies between the latent and observed parameters (parameters) under consideration are given in Figure 5.
According to the experimental data available [Iznak, 1989], the brain alpha-rhythms arise in the occipital region of the head when a subject (more precisely, an operator of a complex technical system, including a pilot) falls into a low efficiency state to be revealed when performing relevant professional activities [Hu, 2020]. So the values of Pb and Qb can be considered as bifurcation values (for P and Q, correspondingly), passing through which leads to the transition to low efficiency subject states.
It is important that the study of alpha-rhythms can be carried out independently of the diagnostics based on the oculomotor activity, which is to be implemented in the process of piloting and is not a distraction for the pilot. This fact makes it possible to calibrate alpha-rhythms as well as the above relative changes of gaze movement entropies and gaze fixation durations in advance, with revealing relevant bifurcation values and their corresponding separation points rY,b and rZ,b (for rY and rZ, correspondingly), and then monitor transitions of these separation points by pilots during a flight in real time using eye-tracking techniques.
After determining bifurcation points Pb and Qb and their
corresponding separation points rY,b and rZ,b for a certain sample of
subjects of interest, factors kY and kZ can be identified as  and
and  , correspondingly, and be thereafter
in use to estimate quantities rY,b and rZ,b through Pb and Qb for other samples
of subjects of interest, correspondingly: rY = kY Pb +1, rZ = kZ Qb +1.
, correspondingly, and be thereafter
in use to estimate quantities rY,b and rZ,b through Pb and Qb for other samples
of subjects of interest, correspondingly: rY = kY Pb +1, rZ = kZ Qb +1.
Figure 6 shows details of the procedure presented above.
To illustrate the above procedure, results of flight experiments based on the Aircraft Cockpit Universal Prototyping Bench developed at GosNIIAS (see Figure 7) [Greshnikov, 2021] are in use.
A mobile software and hardware system has been developed for recording an electroencephalographic signal over one channel. A pair of dry electrodes and one common wire are in use. The hardware part of these facilities is shown in Figure 8. Electroencephalography is a critical element of the technique presented since the relevant measurements and data processing should detect the appearance of alpha rhythms properly. The measurement technology must be very well thought out.
Two samples of pilots were under investigation: subjects from the first sample demonstrated successful piloting during the transition from a calm flight regime to a dangerous one, while subjects from the second sample suffered from an increased stressful response during the transition to dangerous circumstances and made activity mistakes. Presence of the increased stressful response and activity mistakes was revealed by both measuring the brain alpha rhythms and supervising instructor comments.
Accompanying experimental measurements of pilot entropies and durations of gaze movement activity by means of an eye tracker (Figure 10) and the corresponding statistical analysis showed that inhibition Q could be assumed to be constant, whereas external excitation P has undergone significant changes. In more detail, the means related to the samples in question vary significantly during transition from the calm regime and to the dangerous one according to the Cramer-Welch test (p < 0.01) in case of relative changes of gaze movement entropies rY, and the same means do not vary significantly ( p < 0.25) in case of relative changes of gaze fixation durations rZ.
On a phase plane of the considered dynamical system, the spiral sink is transformed to the spiral source with a limit cycle, or vice versa [Arnol’d, 1978; Kuznetsov, 2004]. Figure 11 illustrates qualitatively appearance/disappearance of the bifurcation obtained in response to changes of quantity P when values of magnitude Q are kept constant.
The eigenvalues for the linearized dynamical system under study at the relevant equilibrium point, which are shown as a function of external excitation P, are given in Figure 12. Frequencies of movement along a limit cycle, if there is, on the corresponding phase plane with axes E and I which are shown as a function of external excitation P, are presented in Figure 13. After crossing a bifurcation point, these frequencies stabilize quickly enough in the range of the human brain alpha-rhythms. Characteristic sizes of this limit cycle, which are estimated by the length of the diagonal of a rectangle it is inscribed in, are shown in Figure 14.
Computational experiments revealed bifurcation point Pb for the external excitation, which is equal approximately to 1.75. Corresponding relative entropy change separation point rY,b that is about 1.25 has been determined basing on the available samples of pilots. This separation point can be further used to diagnose easily a pilot condition for the sample of subjects under study: transition through this value, detected as a result of real-time eye-tracking data processing, indicates the presence of the abnormal stressful pilot response to dangerous circumstances. The above factor kY,b = rY,b –1 / Pb equals to 0.135, so the expression 0.135 Pb + 1 can be used to predict separation point rY,b from bifurcation point Pb resulted from computational experiments for other samples of subjects of interest.
It is important to note that similar limit cycles also occur at lower levels of external excitation P and higher levels of inhibition Q, if compared to those discussed. This condition corresponds to disconnection from the external information flow and meets the available experimental data.
The results discussed represent only the first steps in using the bifurcation models for identifying dangerous states of operators of complex technical systems. The revealed facts require further clarification and detailing, which needs new empirical data to be collected.
Principal results and conclusions
1. Developed is the particular form of the approach called the advanced structural equation modelling, in which differential connections between latent parameters are in use, with both the oculomotor activity primary indices and the human brain alpha-rhythm frequencies being observed parameters.
2. The human brain neural activity differential model by H.R. Wilson and J.D. Cowan is applied to connect latent external excitation and inhibition parameters and observed frequencies of brain alpha-rhythms resulted from the Poincaré—Andronov—Hopf bifurcation.
3. Basing on the brain neural activity differential model and empirical information about the observed parameters, the procedure of revealing the presence of the abnormal stressful response to dangerous circumstances has been developed.
4. Electroencephalography is a critical element of the technique presented since the relevant measurements and data processing should detect the appearance of alpha rhythms properly.
5. The results discussed represent only the first steps in using the bifurcation models for identifying low efficiency subject states. The revealed facts require further clarification and detailing, which needs new empirical data to be collected.
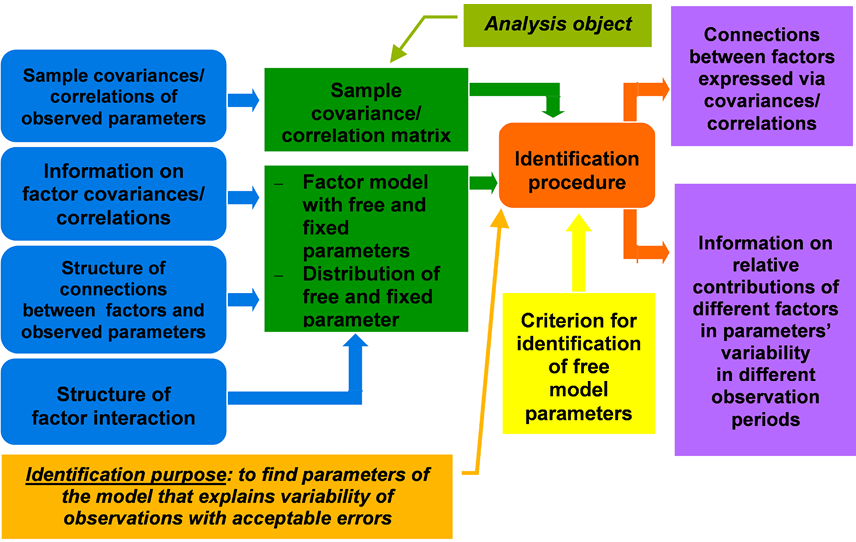
Fig. 1. Principal components of the traditional structural equation modelling
Fig. 2. Path coefficients factor model represented by a path diagram
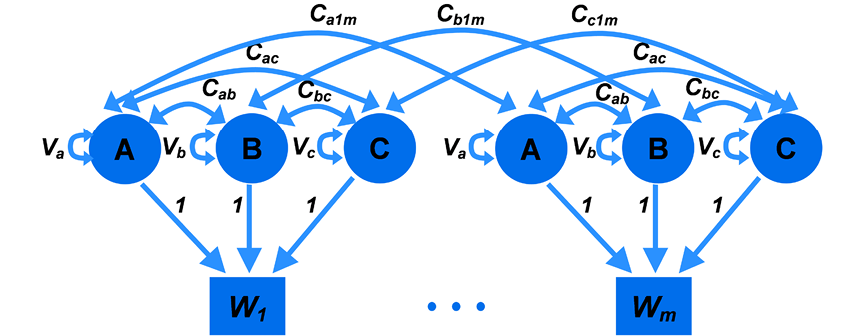
Fig. 3. Variance components factor model represented by a path diagram
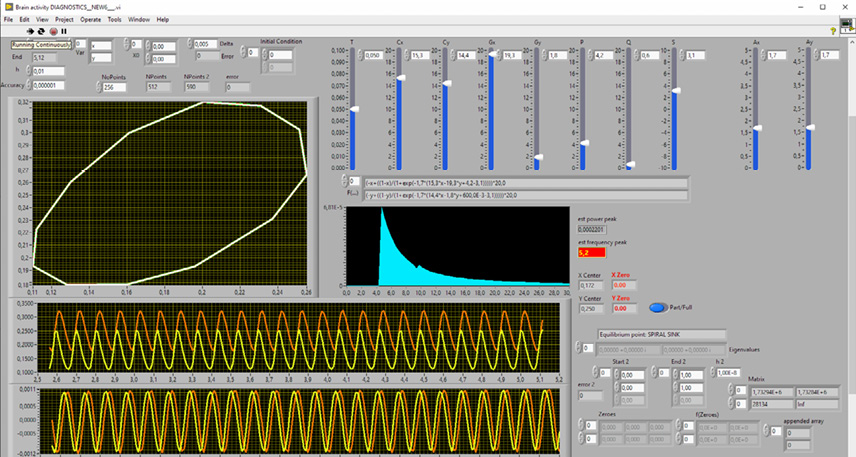
Fig. 4. The program control panel for identifying the dynamical system intrinsic parameters
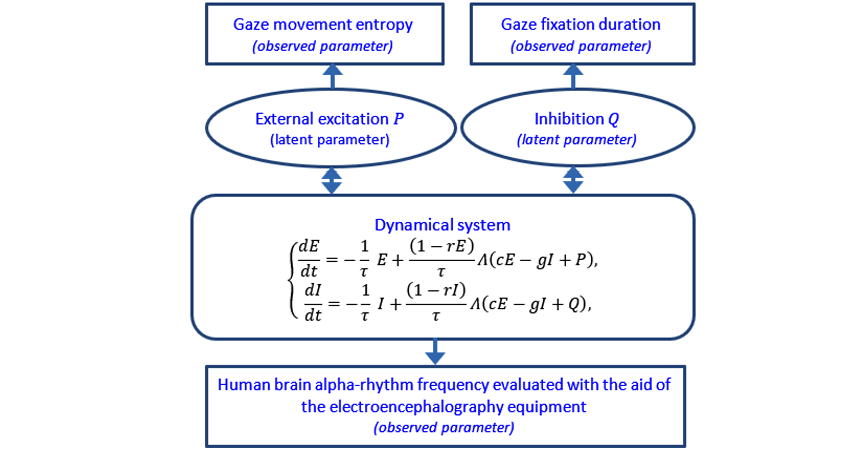
Fig. 5. Dependencies between the latent and observed parameters in question
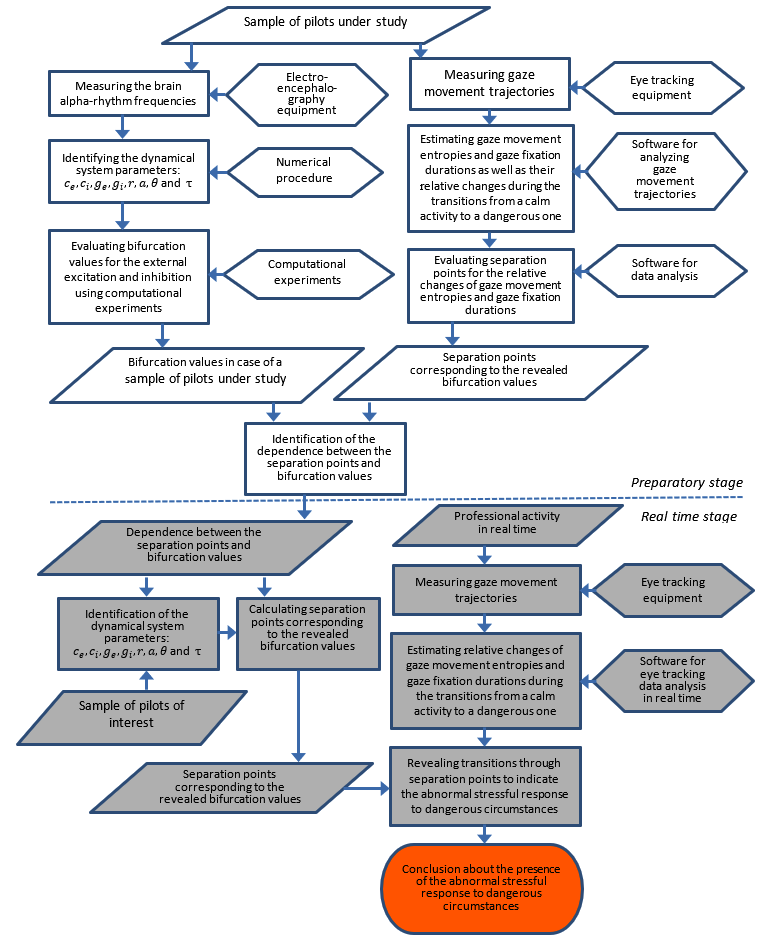
Fig. 6. Procedure of revealing the presence of the abnormal stressful response to dangerous circumstances
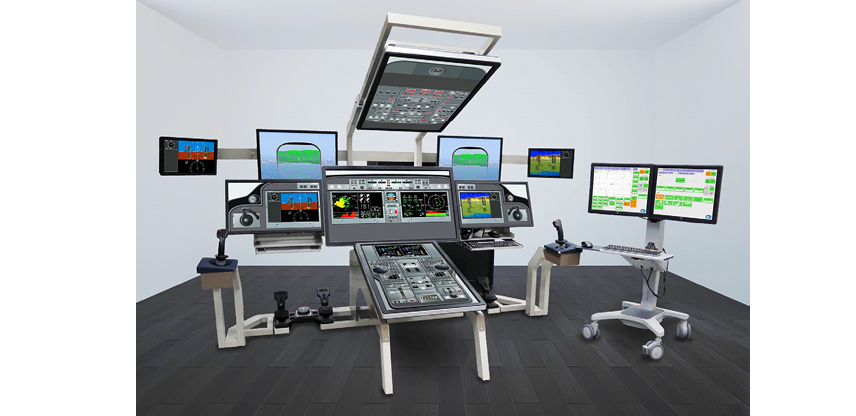
Fig. 7. The Aircraft Cockpit Universal Prototyping Bench of GosNIIAS
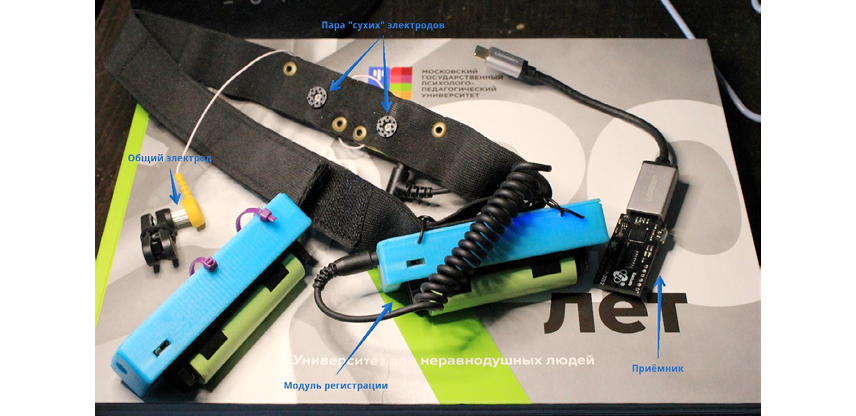
Fig. 8. Facilities for registration of an electroencephalographic signal
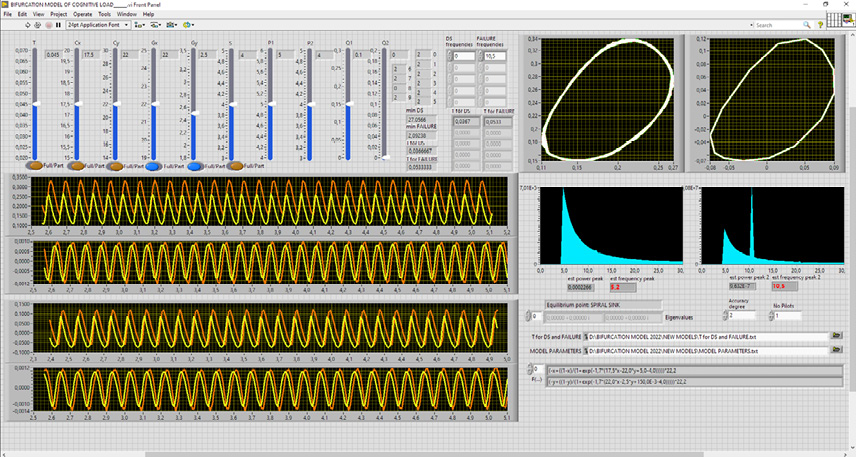
Fig. 9. The program control panel for calculating E(t) and I(t) representing the dynamical system behavior, with the identification results being obtained for two groups of pilots

Fig. 10. The Eye Tracker Used for Recording Video Oculography Data
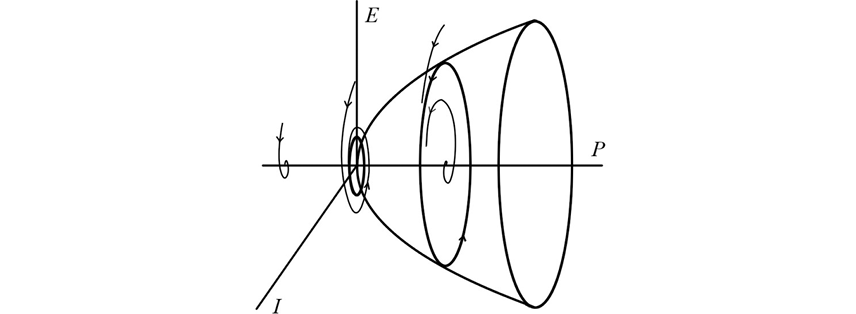
Fig. 11. Appearance/disappearance of the Poincaré—Andronov—Hopf bifurcation in response
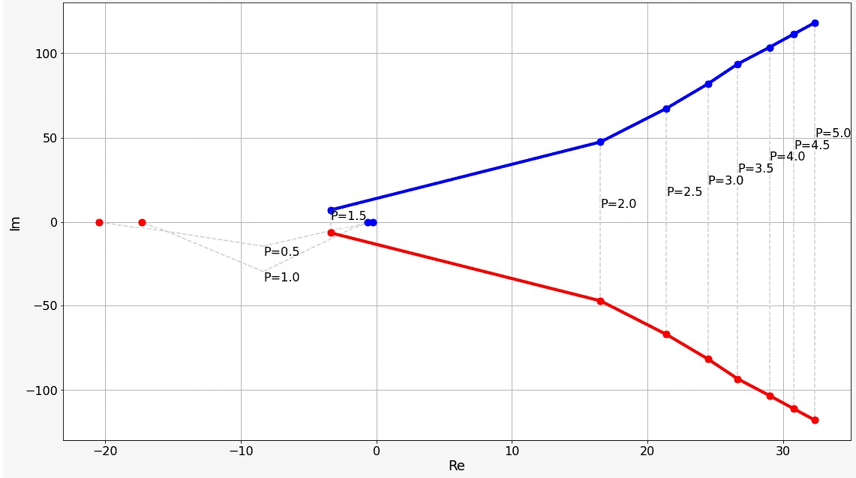
Fig. 12. The eigenvalues for the linearized dynamical system under study at the relevant equilibrium point, which are shown as a function of external excitation P
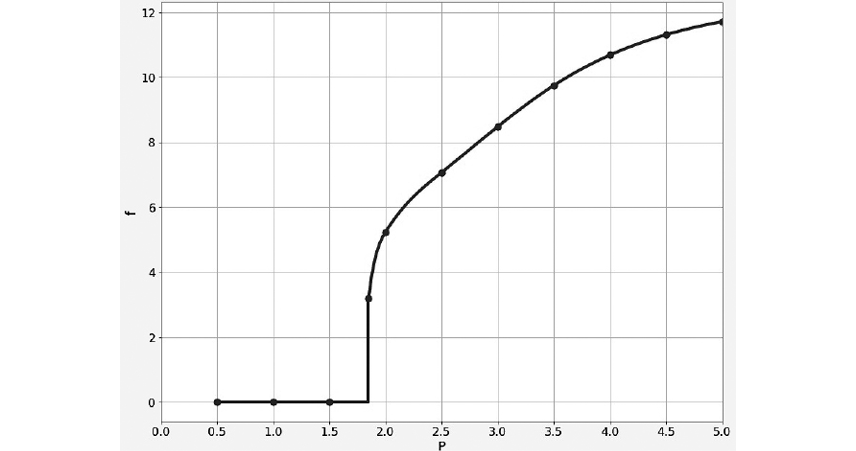
Fig. 13. Frequencies f (in Hz) of movement along a limit cycle, if there is, on the phase plane with axes E and I, which are shown as a function of external excitation P
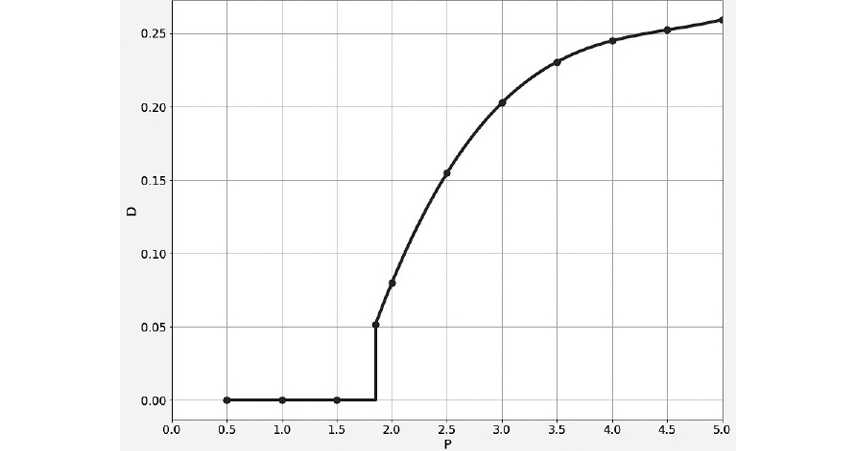
Fig. 14. Characteristic sizes D of a limit cycle on the phase plane with axes E and I , which are estimated by the length of the diagonal of a rectangle it is inscribed in and shown as a function of external excitation P