INTRODUCTION
Schizophrenia (SCZ) is a debilitating mental illness affecting the individual’s thinking, perception, emotional response, as well as daily functioning, in general. Individuals diagnosed with schizophrenia are also at increased risk of somatic comorbidities, such as cardiovascular disease (CVD), type 2 diabetes, and obesity.1,2 It has been estimated that patients with schizophrenia show a two-fold increase in mortality compared to the general population.3 Most of this excess mortality can be attributed to physical illnesses, with CVD being one of the leading causes of death.3–5
Understanding the mechanisms of CVD development in individuals with schizophrenia is of extreme importance for the management and treatment of the disorder. While lifestyle and antipsychotic medication can affect the risk of CVD,5 there seems to be an intrinsic and complex relationship between this physical disorder and schizophrenia. Genetic pleiotropy has been reported for schizophrenia and cardiometabolic abnormalities,6–10 implying shared genetic risk factors for CVD and SCZ. Stratification by genetic susceptibility to cardiometabolic abnormalities has also been proposed to separate SCZ patients into subgroups with differing metabolic profiles.11 At the same time, even though genetic studies show hints of a shared susceptibility towards both SCZ and CVD, the mechanisms linking these two disorders are difficult to untangle from genetic information alone. In this respect, quantifying metabolic profiles of compounds associated with CVD in individuals diagnosed with SCZ can deepen the understanding of this connection by identifying the abnormalities common to the two disorders. Lipids, in particular, have been shown to undergo substantial alterations in schizophrenia.12 Further, genetic variants exhibiting pleiotropic effects in SCZ and CVD are particularly enriched in genes involved in lipid metabolism.9,10
While classical lipid measurements, such as low-density lipoproteins (LDL), high-density lipoproteins (HDL), and total triglycerides, are well known to be associated with both CVD13 and SCZ,14–16 advances in lipidomics have provided the opportunity to expand the scope of metabolic profiling and deepen our understanding of lipid alterations in disease. Ceramides, a class of lipids that consist of a sphingosine backbone connected by an amide bond to a fatty acid (FA) chain of varying length have been shown to predict cardiovascular events more effectively than classical lipid measurements.17 In particular, three lipid species, Cer(d18:1/16:0), Cer(d18:1/18:0), and Cer(d18:1/24:1), have been proposed as promising biomarkers of CVD.18 To assess whether disruption in the metabolism of these ceramides is also characteristic of patients with SCZ, we investigated the levels of these three lipids in 82 patients diagnosed with SCZ in comparison to 138 control (CTL) individuals without a psychiatric diagnosis. We further validated the results on an independent dataset of 26 SCZ patients, and 55 CTL patients, as well as 19 patients exhibiting a first episode of psychosis (FEP).
METHODS
Main sample cohort
Subjects included in this cohort were inpatients recruited from the Mental Health Research Centre, Moscow. The cohort included adult (18 or more years of age) participants with a diagnosis of SCZ (n=82; age 31.2±8.4; 23% female). SCZ status was determined based on the International Classification of Disease (ICD-10). The exclusion criteria were being less than 18 years old, severe somatic and neurological illness, recent surgery, pregnancy, history of substance and alcohol abuse, acute heart failure, severe chronic heart failure, and a diagnosis of CVD. Sample collection was performed at the Neuroimmunology Laboratory of the Mental Health Research Centre, Moscow. The control group (n=138; age 29.5±8.3; 22% female) consisted of healthy volunteers from the Mental Health Research Centre who were showing no signs of psychiatric disorders and met the same exclusion criteria at above (less than 18 years of age, family history of any psychiatric disorder, severe somatic and neurological illness, recent surgery, pregnancy, substance and alcohol abuse acute heart failure, severe chronic heart failure, a diagnosis of CVD). Patients and healthy participants were evaluated by board-certified psychiatrists from the same centre, whilst somatic condition was assessed by internists of the respective specialties. The study was approved by the local ethics committee of the Mental Health Research Centre (Protocol No. 281; 05/05/2016). Informed consent was obtained from all participants. The entire study was conducted in line with the World Medical Association Declaration of Helsinki formulating ethical principles for medical research involving human subjects.
Validation sample cohort
Participants included in the validation cohort were inpatients diagnosed with a first episode of psychosis (FEP, n=19, age 27±7, 53% female) and schizophrenia (SCZ, n=26, age 35±12, 58% female), as recruited at Mental Health Clinic No. 1, named after N.A. Alexeev.
Exclusion criteria for patients were being less than 18 years of age, having a serious medical or surgical illness, any previous episodes of psychosis due to substance abuse, acute heart failure, severe chronic heart failure, and psychotic symptomatology within a clearly diagnosed affective or borderline personality disorder. For healthy controls, the exclusion criteria were being less than 18 years of age, having a current or previous psychiatric disorder, a family history of any psychiatric disorder, head trauma, neurological illness, serious medical or surgical illness, or a history of substance abuse. SCZ status was determined based on the International Classification of Disease (ICD-10). Patients were evaluated using a structured interview for the Positive and Negative Syndrome Scale (PANSS), including the PANSS positive, PANSS negative, and PANSS general psychopathology subscales. The average total PANSS was determined to be 98±24 for women and 91±22 for men. The Russian version of PANSS, with acceptable validity and reliability, was used to evaluate the severity of the symptoms of psychosis in the schizophrenia patients in this study.19
The control group (CTL, n=55; age 32±8, 35% female) consisted of healthy volunteers who had no apparent signs of any psychiatric disorders and met the same exclusion criteria (aged less than 18 years old, family history of any psychiatric disorder, severe somatic and neurological illness, recent surgery, pregnancy, history of substance and/or alcohol abuse, acute heart failure, severe chronic heart failure).
CTL and SZ had no addictions including <80 mg of ethanol equivalent per week and <10 cigarettes per day. Informed consent was obtained from all participants. The protocol for this study was approved by the Interdisciplinary Ethics Committee, Moscow (Protocol No.1, 22/07/2017).
Lipid measurements
Plasma was obtained from peripheral venous blood in the morning from individuals that had undergone an overnight fast. Plasma samples were collected in 4 ml Vacutainer tubes containing the chelating agent ethylenediaminetetraacetic acid (EDTA) (BD Vacutainer, Franklin Lakes, NJ, US). Tubes were centrifuged at 4°C at 1100g for 15 min. The supernatant was stored immediately in 500 μl aliquots at -80°C. We collected the blood plasma samples from the main cohort comprising 82 SCZ and 138 CTL individuals (SCZ: age 31±8, 23% female; CTL: age 30±8, 22% female). We further collected a validation cohort including samples from 26 SCZ, 19 FEP, and 55 CTL individuals (SCZ: age 35±12, 58% female; FEP: age 27±7, 53% female; CTL: age 32±8, 35% female). Studies on the validation of the data obtained were conducted using the blind method, i.e., during the measurement of the lipid profile, the experimenter did not know which sample (patients or controls) he/she was measuring. We randomized the plasma samples with respect to the diagnosis and extracted lipids from them following the same standardized extraction procedure. We then measured lipid abundances using liquid chromatography coupled with mass spectrometry (LC-MS) in negative ionization mode for the main dataset and validation dataset in two distinct experimental runs. Sample processing, LC-MS measurements, and data preprocessing were performed as described elsewhere.48 We determined the molecular ions corresponding to Cer(d18:1/16:0), Cer(d18:1/18:0), and Cer(d18:1/24:1) based on their initial molecular ion masses, chromatography retention time, and their fragmentation profiles (LC-MS2) by the presence of characteristic sphingoid base fragments.
To simplify the normalization of lipid abundances between the main and validation datasets, 20 demographically representative reference samples from the main dataset were remeasured together with the validation dataset. The mean abundances of these samples in the validation and main datasets were used to normalize the abundances in the validation dataset: for each lipid, the differences between these means were subtracted from the abundances of each sample in the validation dataset to produce normalized abundances.
Statistical analysis
Statistical tests were performed on the base-two log transformed abundances to ensure normal distribution. The Welch t-test of unequal variance was used to assess statistical differences. However, bar plots were visualized on the original scale.
Analysis, including statistical analysis, performance calculation for naïve classifiers, and logistic regression, was performed using the publicly available python libraries “scipy” and “sklearn”. The prediction models were trained using the main dataset, and tested on both the main and validation datasets.
RESULTS
The statistical analyses of the lipids extracted from main cohort SCZ and CTL samples demonstrated that all three ceramides of interest, Cer(d18:1/16:0), Cer(d18:1/18:0), and Cer(d18:1/24:1), displayed statistically significant differences in abundance between the SCZ and CTL groups, with all three compounds showing a higher abundance in SCZ (Welch t-test, p<0.0001) (Figure 1; Table 1). Similarly, the intensities of all three ceramides were elevated in SCZ and FEP patients compared to CTL individuals in the validation cohort. Further, despite reduction in statistical power due to smaller sample size, abundance of all three ceramides differed significantly between FEP and CTL samples (Welch t-test, p=0.0125, 0.000005, and 0.0255, respectively), as well as for Cer(d18:1/18:0), between the SCZ and CTL samples (Welch t-test, p=0.0012; Figure 1; Table 1).
Figure 1. The median and interquartile ranges in sample groups for each of the ceramides’ abundances: Cer(d18:1/16:0), Cer(d18:1/18:0), and Cer(d18:1/24:1). The median abundances in each sample group correspond to the bar heights, and the interquartile range is indicated by the error bars. For each of the ceramide, sample groups are indicated on the bottom, from left to right: CTL main cohort, SCZ main cohort, CTL validation cohort, SCZ validation cohort, FEP validation cohort. The p-values of the Welch t-test and the fold-changes in abundances for the comparisons between the psychiatric and CTL groups are indicated on the plots.
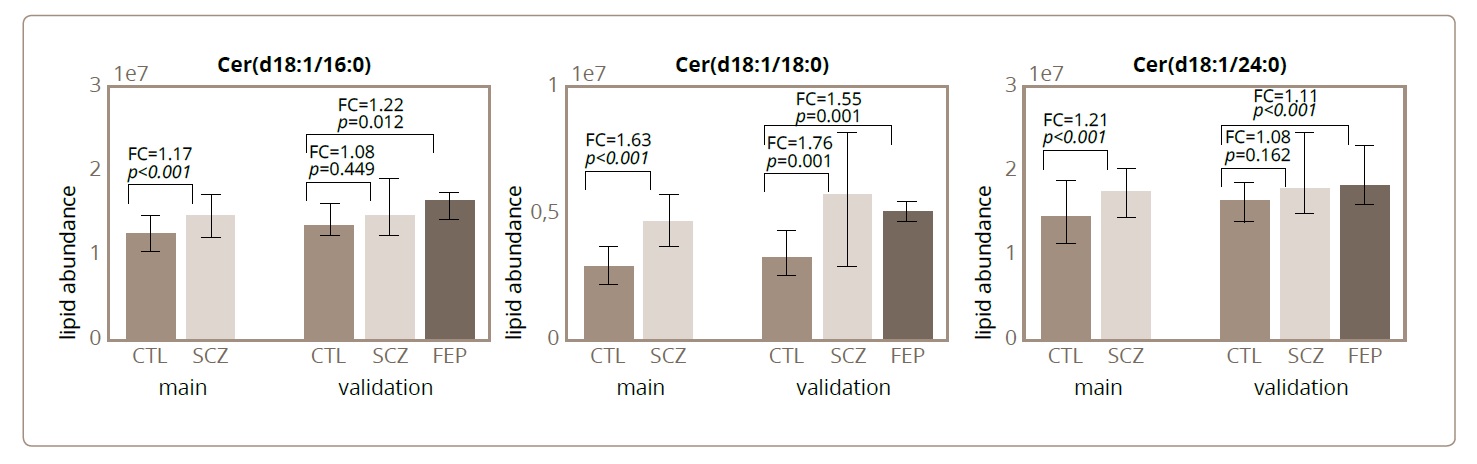
Table 1. p-values, fold-changes, and ROC AUC values for the comparisons between the psychiatric and CTL groups.
|
Ceramide spices |
Cer(d18:1/16:0) |
Cer(d18:1/18:0) |
Cer(d18:1/24:1) |
|
|
p-values |
SCZ vs CTL, main |
<0,001 |
<0,001 |
<0,001 |
|
SCZ vs CTL, validation |
0,44 |
0,001 |
0,16 |
|
|
FEP vs CTL, validation |
0,012 |
<0,001 |
0,02 |
|
|
Fold-changes |
SCZ vs CTL, main |
1,17 |
1,63 |
1,21 |
|
SCZ vs CTL, validation |
1,08 |
1,76 |
1,08 |
|
|
FEP vs CTL, validation |
1,22 |
1,55 |
1,12 |
|
|
ROC AUC |
SCZ vs CTL, main |
0,67 |
0,81 |
0,66 |
|
SCZ vs CTL, validation |
0,57 |
0,73 |
0,61 |
|
|
FEP vs CTL, validation |
0,68 |
0,81 |
0,67 |
We then tested the possibility of being able to discriminate between the two groups of individuals, psychiatric patients and controls, based on the abundances of each of the three ceramides. The abundances of each compound, in conjunction with an abundance threshold, represented a naive classifier, with individuals with abundances higher than the cutoff threshold classified as the psychiatric patient group, and individuals with abundances lower than the cutoff as the CTL group. To assess the predictive power of these naive classifiers, we used Area Under the Curve of the Receiver Operator Characteristic (AUC ROC), which reflects, for the different cutoff thresholds, the relationship between the ratio of false positive and true positive classifications. A large AUC (with a maximum of 1) corresponds to a classifier for which, with an appropriate cutoff threshold, the ratio of true positives is higher, while the ratio of false positives remains low. Of the three ceramides, Cer(d18:1/18:0) showed best performance, as indicated by the fact that it had the highest ROC AUC score (Cer(d18:1/16:0): AUC = 0.68; Cer(d18:1/18:0): AUC=0.81; Cer(d18:1/24:1): AUC=0.61; Figure 2; Table 1). We then assessed the performance of these same classifiers when applied to the classification of psychiatric patients versus CTL in the validation cohort. For the three ceramides, the separation of SCZ and CTL was slightly worse than in the main cohort (Cer(d18:1/16:0): AUC=0.57; Cer(d18:1/18:0): AUC=0.73; Cer(d18:1/24:1): AUC=0.61; Figure 2; Table 1). The classification of FEP versus CTL individuals, however, displayed no decline in accuracy compared to the main cohort performance (Cer(d18:1/16:0): AUC=69; Cer(d18:1/18:0): AUC=81; Cer(d18:1/24:1): AUC=67; Figure 2; Table 1), indicating the good generalization capabilities of the separation models.
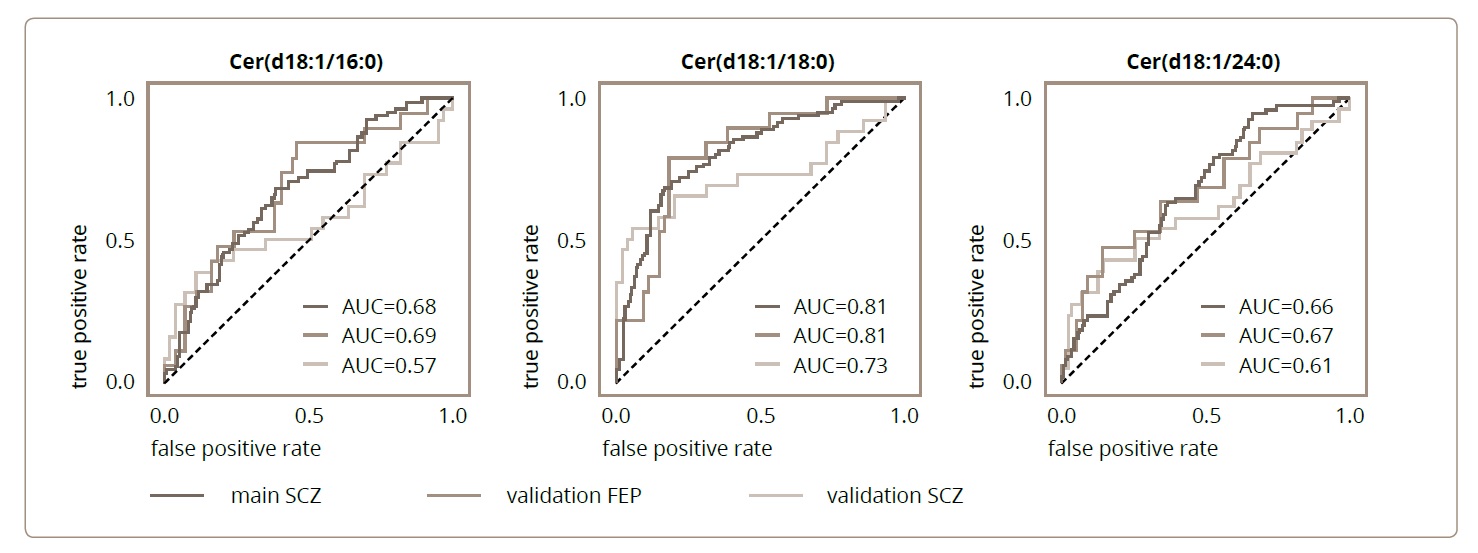
Figure 2. The receiver operating characteristic (ROC) curves for the naïve classifiers that were based on each of the ceramides’ abundances: Cer(d18:1/16:0), Cer(d18:1/18:0), and Cer(d18:1/24:1). Each ceramide species, in conjunction with an abundance threshold, represents a naive classifier, with individuals with abundances higher than the cutoff threshold classified as the psychiatric patient group, and individuals with abundances lower the cutoff – as CTL group. For each ceramide, the ratio of the true positive classifications is plotted against the ratio of false positive classifications for the different cutoff thresholds. Colours correspond to the different classification tasks: main cohort SCZ vs. CTL (dark red), validation cohort FEP vs. CTL (red), validation cohort SCZ vs. CTL (orange). The corresponding areas under the curves (AUCs) are indicated on the plots.
We next used the abundances of the three ceramides together to construct a logistic regression model separating psychiatric patients from CTL individuals. The model trained on the samples from the main cohort showed a similar accuracy to the best-performing individual ceramide, Cer(d18:1/18:0), but its accuracy in the validation dataset was, in fact, higher (main cohort, SCZ vs CTL: AUC=0.82; validation cohort, SCZ vs CTL: AUC=0.81; FEP vs CTL: AUC=0.83).
DISCUSSION
Schizophrenia (SCZ) is burdened by a range of metabolic abnormalities. In this work, we have assessed the abundances of three ceramide species, Cer(d18:1/16:0), Cer(d18:1/18:0), and Cer(d18:1/24:1), in the blood plasma of patients suffering from SCZ and in control individuals with no psychiatric diagnosis. These ceramide species were chosen on account of their emerging role as biomarkers of cardiovascular disease (CVD).18 Our results demonstrate that ceramide alterations might be an abnormality common to both SCZ and CVD.
While CVD progression can be affected by environmental factors such as lifestyle, weight, and smoking,5 there is evidence for a genetic basis of CVD.19 There are also reports of shared genetic risk factors for both SCZ and CVD,6–8 with lipid-related genes being highlighted in the literature.9,10 Likewise, while ceramides can be affected by lifestyle, diet, and other environmental factors, the human plasma lipidome, and ceramides in particular, were found to have a marked genetic component.20–22 The identifications of genes, such as SPTLC3, that show association with both CVD and blood plasma ceramide levels,20 but that were also reported in connection to SCZ,23,24 demonstrates the possibility of an intrinsic connection between SCZ, CVD, and ceramide metabolism abnormalities beyond the superficial influences of environmental factors.
Ceramides are structural elements of eukaryotic cell membranes. They also have signalling functions, being involved in processes such as apoptosis and inflammation.25,26 Moreover, ceramides are enriched in neural tissues and are vital for the normal functioning of brain cells, in particular.27-29 While the exact role of ceramides is not fully elucidated, perhaps the most convincing evidence of their important functional role is the numerous reports of ceramide alterations in various disorders besides CVD, such as diabetes, insulin resistance, neurodegenerative disorders, and multiple sclerosis.30,31 In a similar manner to CVD, specific ceramide lipid species quantified in blood plasma, including the Cer(d18:1/18:0) compound assessed in this study, have been proposed as biomarkers of depression.32 In schizophrenia, ceramide alterations have been reported in the brain,33 and mechanisms linking metabolic abnormalities and SCZ through sphingolipids have been proposed.12,34
While ceramides in blood plasma have been extensively studied as biomarkers of depression,32 surprisingly, we have not been able to find any studies that explicitly focused on ceramides in the blood plasma of SCZ patients. Nevertheless, alterations in the blood plasma of SCZ patients were investigated and reported for other lipid classes.35–47 In our work, we demonstrated that the abundance of one particular ceramide previously reported as a reliable depression and CVD biomarker – Cer(d18:1/18:0)18,32 – was sufficient to distinguish SCZ from CTL with an AUC higher than 0.8, where this result was further reproduced in an independent cohort of first psychotic episode patients. We also found that the discriminatory power of the other two assessed ceramides, Cer(d18:1/16:0) and Cer(d18:1/24:1), was lower, but the associated differences in abundance between the SCZ and CTL groups was nonetheless statistically significant. We found that the combination of the abundances for the three ceramides in a single model produced moderate improvement in the classification performance compared to the single compound Cer(d18:1/18:0). The model performance achieved in this study is not, however, the best reported for SCZ and CTL group separation – models based on other lipid classes allegedly reached AUC=0.98,43 indicating extensive disruption of lipid metabolism in SCZ.
The limitation of this study was that only three ceramides were identified, whereas there are several hundred different kinds of lipids in an organism. Environmental factors such as lifestyle, weight, and smoking were also not taken into account. This will be pursued in following studies, where more patients will be recruited, and more lipids will be investigated.