Introduction
Ethiopia's economy is based primarily on agriculture. According to the US Agency for International Development (USAID), agriculture continues to be a major driver of the economy, accounting for 40% of GDP, 80% of exports, and employing over 75% of the labor force. Predicting yields for staple cereal crops such as teff, wheat, barley, maize, sorghum, finger millet, and oats is not just a scientific endeavor but also a pragmatic necessity. By examining the complex interactions between climatic factors and agricultural practices, this paper This paper serves as a foundational exploration into predicting the yields of important cereal crops in Ethiopia. We use a visual analytic approach to identify patterns in annual temperature, precipitation, area harvested, production, and yield data from 1995 to 2021 by integrating climate factors and agricultural practices. By examining these Agricultural variables, we hope to build links between shifting climatic conditions, agricultural decisions, and crop production, providing indispensable insights for stakeholders, farmers, and policymakers.
Data and Methodology
The Central Statistics Agency of Ethiopia (CSA) provided information on the area harvested, production, and yield of cereal crops at the national level in Ethiopia during the "Meher," or main rainy season. The data covered the years 1994/95 to 2020/21. The Food and Agriculture Organization (FAO) and the World Bank provide meteorological and pesticide usage statistics, which we have combined into our dataset.
This dataset contains important factors related to cereal crop yields, including Teff, Maize, Sorghum, Millet, and Oats/Aja. A record of the data's annual temperature (in °C), precipitation (in mm), pesticide usage (in tons), Area harvested(ha), production (t) and crop yields (100 g/ha) are all included. A26-year dataset of cereal harvest data was subjected to time series analysis using Jupiter Notebook. We use a multi-step approach in our methodology that includes data cleaning and preprocessing, statistical analysis, and the application of advanced data visualization techniques.
These visualization tools help us to understand the complex dynamics that affect cereal crop yields, paving the way for the development of accurate and insightful machine learning models. Table 1 shows the total annual cereal crops data and climate data in Ethiopia between 1995 and 2021.
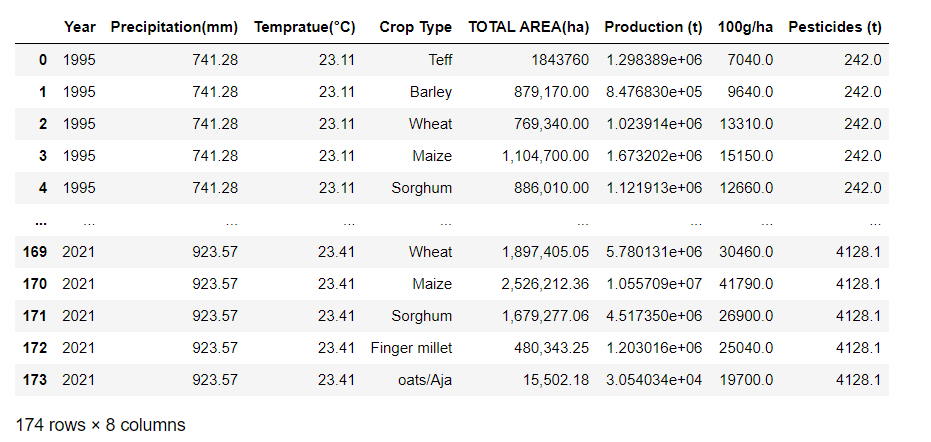
Table 1. Crop and Climate Data: Ethiopia (1995–2021)
Visual Analysis
Visual 1: Temporal Trends in Precipitation, Temperature and pesticides
A detailed examination of the temperature and precipitation patterns from 1994 to 2021 is shown in Figure 1. Essential insights into the climatic factors influencing Ethiopia's yields of Teff, Maize, Sorghum, Millet, and Oats/Aja are shown by this graphic.
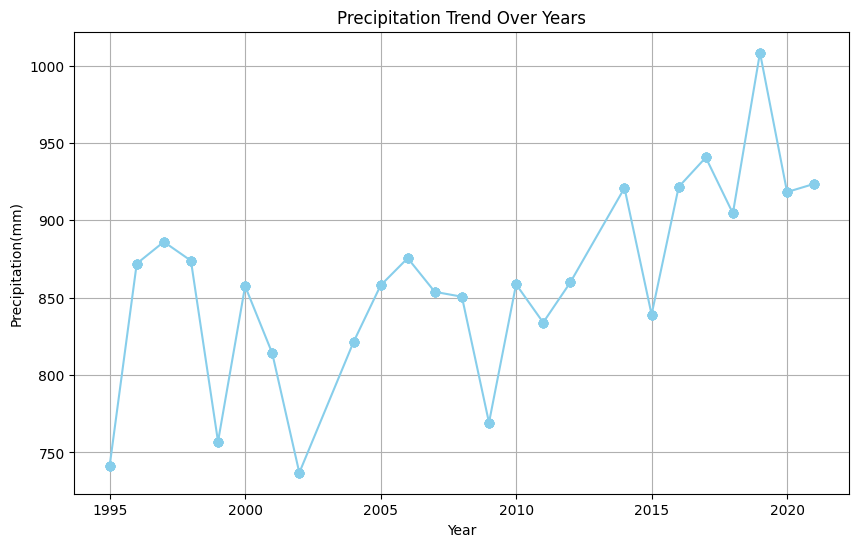
a) Precipitation trend over years
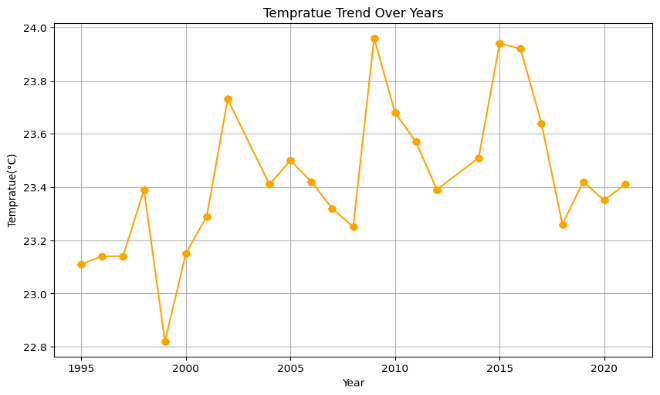
b) Temperature trend over years
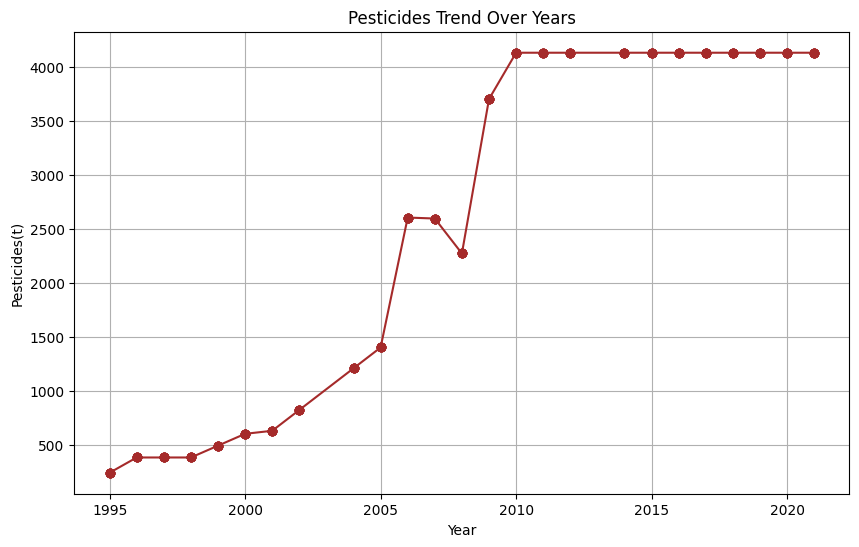
c) pesticides trend over years
Fig.1. Temporal Trends in Precipitation, Temperature and pesticides
The study examines temporal trends in precipitation, temperature, and pesticides over the years. Precipitation levels show some variation, with a notable spike in 2019 reaching 1008.31 mm. The average temperature remains within the range of 23-24 degrees Celsius, with minor fluctuations. The year 2019 corresponds to the highest precipitation and slightly elevated temperature of 23.42 degrees Celsius. The consistent temperature range suggests stability in climatic conditions, while variations in precipitation may impact agricultural practices and water availability.
Pesticide application remained relatively stable from 1995 to 2002, with a gradual increase. A significant spike in 2003 nearly doubled pesticide use from the previous year. The application reached its peak in 2007 at 2593.9 tones. A sudden drop in 2008 brought pesticide use back to 2002 levels. From 2010 onwards, there was a remarkable rise in pesticide application, reaching a plateau at 4128.1 tons from 2011 to 2021.
The trend analysis highlights key shifts in pesticide usage over the years, with early years showing stability, followed by a significant surge, a subsequent decline, and a steady increase in later years. Further investigation into these factors would provide a more comprehensive understanding of the observed trend.
Visual 2: Longitudinal Crop Yield Analysis
Figure 2 shows the actual yields of selected cereal crops over the years, making it possible to see trends and possible relationships with the climate.
Top of Form
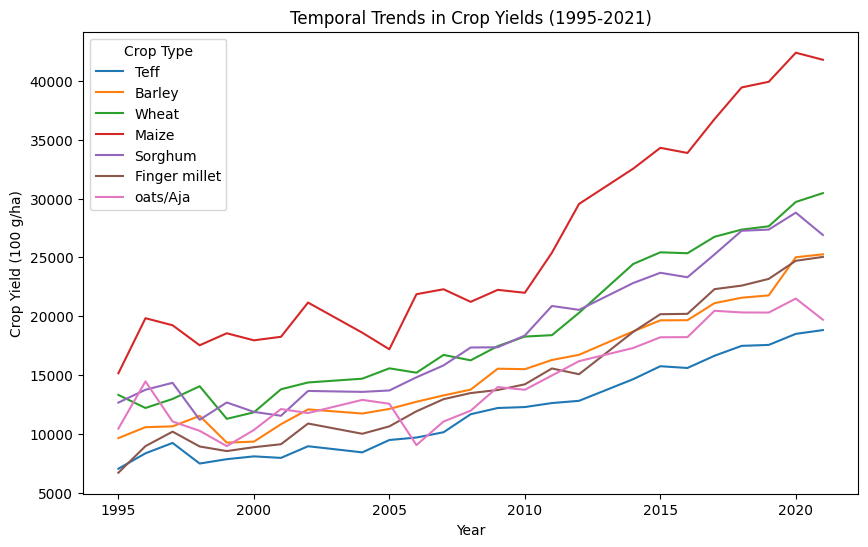
Fig.2. Temporal trends in cereal crops yield (1995-2021)
Top of Form
The temporal trends in cereal crop yield from 1995 to 2021 reveal variations among different crop types. Teff, a staple cereal in the region, shows a steady increase in yield from 1995 to 2021, with a peak around 2021. Barley, another important crop, shows fluctuations in yield, reaching higher values in recent years. Wheat exhibits a general upward trend, with sporadic fluctuations, while Maize demonstrates a steady rise in yield over the years. Sorghum and Finger Millet show fluctuations in yield, with some years experiencing a significant increase. Oats/Aja demonstrates a mixed pattern with alternating peaks and troughs. Understanding these temporal trends is crucial for developing sustainable agricultural strategies and ensuring food security in the region. Teff yield increased significantly from 1995 to 2008, with a peak in 2019. Barley showed a consistent upward trend, reaching its highest yield in 2021. Wheat displayed fluctuations, with occasional declines in yield. Finger Millet and Oats/Aja showed positive trends, with relatively stable or increasing yields over the years.
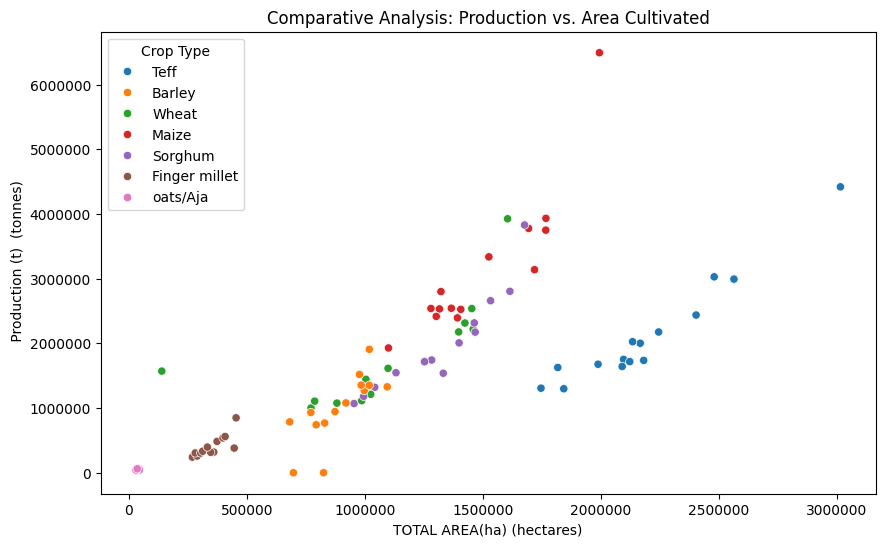
Fig.3. a scatter plot comparing the area cultivated and productivity of the main cereal crops.
A scatter plot shows the relationship between the amount of land harvested and the total amount of agricultural production (in tons). Some of the observations include that each crop shows a different pattern; some show a positive relationship between increased area and production, while others show fluctuations and outliers.
Visual 3: Correlation Between Precipitation, Temperature, and Crop Yields
Figure 3 illustrates the correlation between temperature, precipitation, area cultivated, number of pesticides and crop yields. The heatmap in the figure showing correlation matrix helps to understand how these variables relate to each other and affect cereal crops yield.
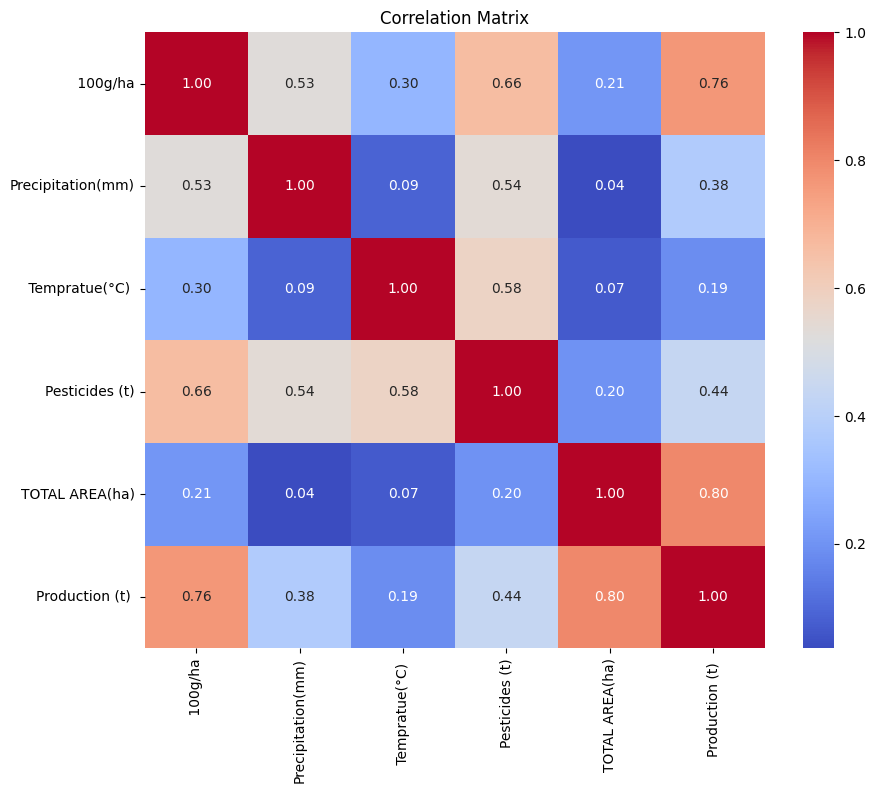
Fig.4. a heatmap which shows the correlation matrix between all variables
The correlation matrix in our agricultural dataset shows a strong positive correlation between crop yield and production (0.76), indicating that higher yields lead to increased overall production. Pesticide use also shows a significant positive correlation with both crop yield (0.69) and production (0.44), highlighting its influence on agricultural outcomes. Precipitation has a moderate positive correlation with crop yield (0.55) and pesticides (0.57), suggesting that adequate rainfall positively affects both crop yield and the need for pesticides. Temperature has a weaker positive correlation with crop yield (0.36) and pesticides (0.63). Total area harvested has a modest positive correlation with crop yield (0.21) and a stronger positive correlation with production (0.8)., suggesting that the size of the cultivated area significantly contributes to overall production. The matrix also reveals patterns in the relationships between key variables, with crop yield showing a strong positive correlation with itself (r = 1).
Visual 4: Distribution of each variable
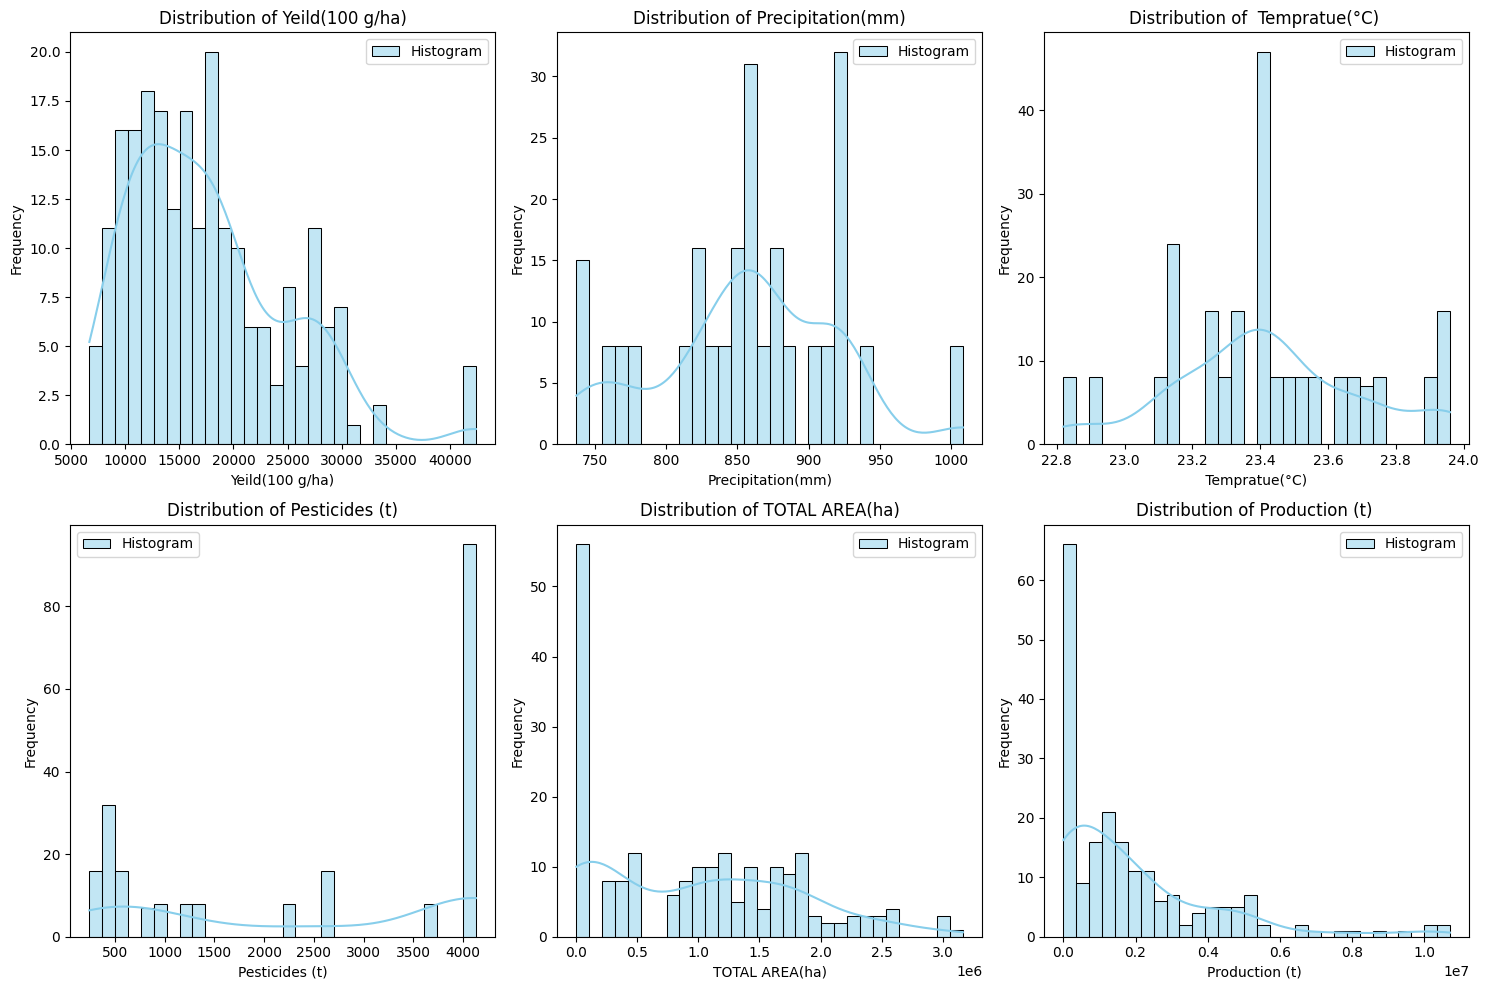
Fig. 5. histograms for various agricultural variables distribution over the years
Figure 5 shows the temporal evolution of key agricultural variables from 1995 to 2021, revealing significant trends. Key trends include a significant concentration of yield between 15,000 and 20,000 100g/ha, precipitation peaks at 850 mm and around 920 mm, temperature at 23.4 degrees Celsius, and pesticide usage peaks at 4,000 tons. Total area harvested shows a peak at lower values, suggesting agricultural activity in smaller areas. The production histogram shows a substantial peak at the beginning of the timeline, reflecting higher production levels in earlier years. This graphical representation provides a clear overview of distributional shifts and frequency in these variables, providing insights for further analysis and decision-making in crop management. The findings can inform further analysis and decision-making in the realm of crop management.
Conclusion
This study explores the dynamics of staple crops in Ethiopian agriculture, focusing on key crops like Teff, Maize, Sorghum, Millet, and Oats/Aja. The dataset, collected from Ethiopian Statistical Agency yearly reports from 1995 to 2021, provides insights into historical trends and predictive models, contributing to the resilience and sustainability of Ethiopian agriculture. Visual graphs reveal temporal trends in precipitation, temperature, and pesticide usage, while longitudinal analysis reveals evolving dynamics. The scatter plot highlights patterns in the relationship between area harvested and production, while the correlation matrix heatmap explains how various factors interact to influence crop yields. Distribution histograms visually represent frequency and patterns within the dataset, facilitating clear interpretation. This research is a crucial step in understanding and predicting cereal crop yields in Ethiopia, providing a foundation for informed decision-making in agricultural management and holds transformative potential for the future of Ethiopian agriculture. The visualizations enhance the clarity and applicability of the findings, setting the stage for further research and practical implementations to optimize staple crop production in the region.
Future Directions
This research aims to develop machine learning models that can accurately predict cereal crop yields in Ethiopia based on historical and environmental factors. Future studies should expand the dataset to include soil health and socioeconomic factors, enriching predictive capabilities and providing a holistic understanding of crop production. Collaboration with local agricultural stakeholders and policymakers is crucial for integrating these predictive insights into real-world decision-making processes. This research opens avenues for implementing precision agriculture practices, optimizing resource allocation, and enhancing productivity in Ethiopian agriculture. The ongoing synergy between academia, agriculture, and policy will play a pivotal role in shaping a more resilient and sustainable future for Ethiopia's agricultural landscape.