Introduction
The education process identified some important abilities called either “key competences” or “21st century skills” [World Economic Forum, 2018], the mastery of which is necessary for successful realization in life. Creativity, or creative thinking, is one of these skills. While computers and various artificial intelligent systems are now replacing workers for many standard tasks [Autor], the ability to think creatively and solve problems, complex communications, and social skills are becoming increasingly significant skills in the labor market. This requirement forces teachers to consider how to develop these skills and psychometricians to consider how best to assess these skills.
In the field of creativity assessment in the educational sphere, there is a widespread approach representing four main categories of creativity definitions and research areas known as the 4Ps: product, process, person, and press of the environment [Rhodes]. In the following, we will review the instruments for measuring cognitive processes related to creativity and creative products or outcomes.
The process approach to measuring creativity focuses on specific cognitive processes that contribute to creativity. Traditional tests developed under this approach involve open-ended or poorly structured tasks that require the production of as many responses as possible, which are then assessed to determine various creativity factors, usually including fluency (number of responses), originality (statistical rarity), flexibility (number of different categories), and elaboration (number of details). The main idea of assessment is not only to consider the quantity of answers, but also their quality.
A major contribution to the assessment of creative abilities was made by Gilford [Guilford], who developed the Structure of the Intelligent (SOI) model and divergent thinking tests, which is considered an important element of creativity. It is also worth noting that the most used creativity tests are the Torrance Tests of Creative Thinking (TTCT) [Torrance], which have been translated into more than 40 languages. Torrance designed 12 tests for different ages, grouped into a verbal, visual, and audio battery. However, Torrens tests are labor-intensive in terms of training experts and administering testing. In addition, the tests do not measure all aspects of creativity, but they do not claim to do so either. In the field of creativity assessment, there is a position that no cognitive test is a predictor of creativity if it does not include affective and motivational factors [Sternberg].
The newer creativity tests for schoolchildren are most valuable as indicators of potential creativity assessment (The Evaluation of Potential Creativity, EPoC), which are developed as procedures that assess the "overlap area". The test consists of a series of subtests that were designed to measure both general and specific creative abilities in two areas - verbal/literary and graphic [Barbot]. The EPoC subtests measure two key models of creative cognition - divergent and convergent thinking. Divergent thinking tasks involve creating as many drawings as possible using a simple abstract shape or familiar object. Verbal thinking tasks involve creating several simple story endings in response to a unique story beginning or, conversely, several plot twists in response to a unique denouement. In convergent thinking tasks in the graphic domain, test takers create a completed original drawing using at least four of the eight abstract shapes or familiar objects that serve as the basis for their composition. In the verbal/literary domain of the convergent thinking task, test takers are required to create a completed story based on either a given title or given fictional characters.
However, traditional approaches to creativity testing, such as paper-and-pencil testing, are already outdated and have several disadvantages. First, they require experts for assessment, which creates a high testing workload due to the complexity of administration and introduces the effect of subjectivity of experts into the final scores. In addition, traditional tests have psychometric problems, such as inconsistent evidence of reliability and validity of instruments in different samples, the influence of the test environment on test results, and outdated psychometric analyses [Said-Metwaly].
In this regard, the assessment of complex skills requires using not only traditional testing formats, but also more modern formats. One such format is digital tasks containing interactive elements that often resemble games in their form of presentation [Kim]. Examples include a instrument for assessing convergent thinking - BuzzWords [Howell], divergent thinking - Immune Defence [Krebs], convergent and divergent thinking simultaneously - Crea.blender [Rafner]. Often, instruments in digital environments not only have automatic scoring rules without expert involvement, but also collect data about the process of task performance.
Task process data refers to data collected from respondents interacting with the computerized assessment element. This is recorded in computer log files and is often represented as sequences of events (specific actions in the test environment) with time stamps [Griffin, 2014]. Such data is collected and analyzed in the assessment of complex skills, such as collaborative problem solving [30], as well as in modern task formats that simulate video games [Kerr].
For example, in the framework of the Programme for International Student Assessment (PISA) in 2012, students' problem-solving skills were assessed using a set of interactive test items [OECD (2013), “Problem-Solving]. The test is designed to measure individuals' ability to cognitively process information to understand and solve problem situations where the method of solution is not immediately obvious. By exploring the problem situation and interacting with the computer environment, students found pieces of information that would be useful for solving the problem at hand. In addition to the answers to the test questions, students' behavioral data is also recorded to have an insight into their problem-solving strategies. For PISA problem-solving tasks, the learner's explicit answers to each question are product data, and the series of clicks and inputs made during his or her interaction with the questions, as well as the timestamps associated with each action, are process data of the task. Different methods for analyzing process data in relation to one of the 2012 PISA tasks were shown in [Qiao X and], whose findings suggest that the choice of data analysis methods for analyzing the process of task performance in a saturated digital environment depends on the purpose of the analysis and the structure of the data.
The aim of the study is to determine the possibilities of using data on the task performance process in the framework of evaluating creative thinking using an instrument in a digital environment. Based on the indicators in the instrument, we get information about the level of creativity skill development, so we can compare the processes of solving a task among students with different levels of creativity skill development. In this instrument, described in detail in the next section, not only creativity but also critical thinking is assessed using the same format tasks.
Thus, in the study, we want to answer the following research questions regarding the data on the task process:
- What actions distinguish the process of performing a creative thinking task for students with a high level of creative thinking from performing it for students with a low level?
- What actions distinguish the process of performing a creative thinking task from the process of performing a critical thinking task?
Methods
The instrument
This study analyzes one of the tasks of the instrument “4K” for 21st-century skills assessment among fourth-grade schoolchildren, developed by the Centre for Psychometrics and Measurements in Education (Laboratory for New Constructs and Test Design) of Institute of Education of HSE University. The instrument consists of several scenario-type tasks that evaluate four skills: creative and critical thinking, communication, and cooperation. Moreover, most tasks allow to measure several skills.
The instrument is presented to students in computerized form. The task screen is interactive: the test taker clicks on an area of his/her choice and then sees a pre-prepared specific response from the testing system. This format allows for the demonstration of complex skills, as well as keeps test takers motivated and reduces test anxiety. At the same time, the simulation of a real environment allows for more accurate recording of observed behavior, i.e., evidence that the test taker possesses a specific skill.
This paper considers the task «Monster», which is aimed at assessing creative and critical thinking. The general context of the task is imaginary and consists in the fact that the test taker found himself at a holiday performance in the City of Monsters. The task consists of description screens and a constructor (Figures 1-2) with which the test taker creates images.
In the first part of this task, aimed at assessing creative thinking, each test taker creates three monsters for the performance poster, which should be surprising and unusual and different from the locals. The interface of this part of the task is shown in Fig. 1. The constructor consists of a canvas in the center on which elements from the bottom panel can be placed. All elements are divided into categories (torso, arms, various, etc.) and can be used an unlimited number of times (except for the torso, which must necessarily be one and is fixed in the center of the canvas). On the right side of the screen was a local resident, which was considered a reference for the purpose of originality scoring. Also, on the screen above the reference and on the right side of the bottom panel are instructions for completing the task.
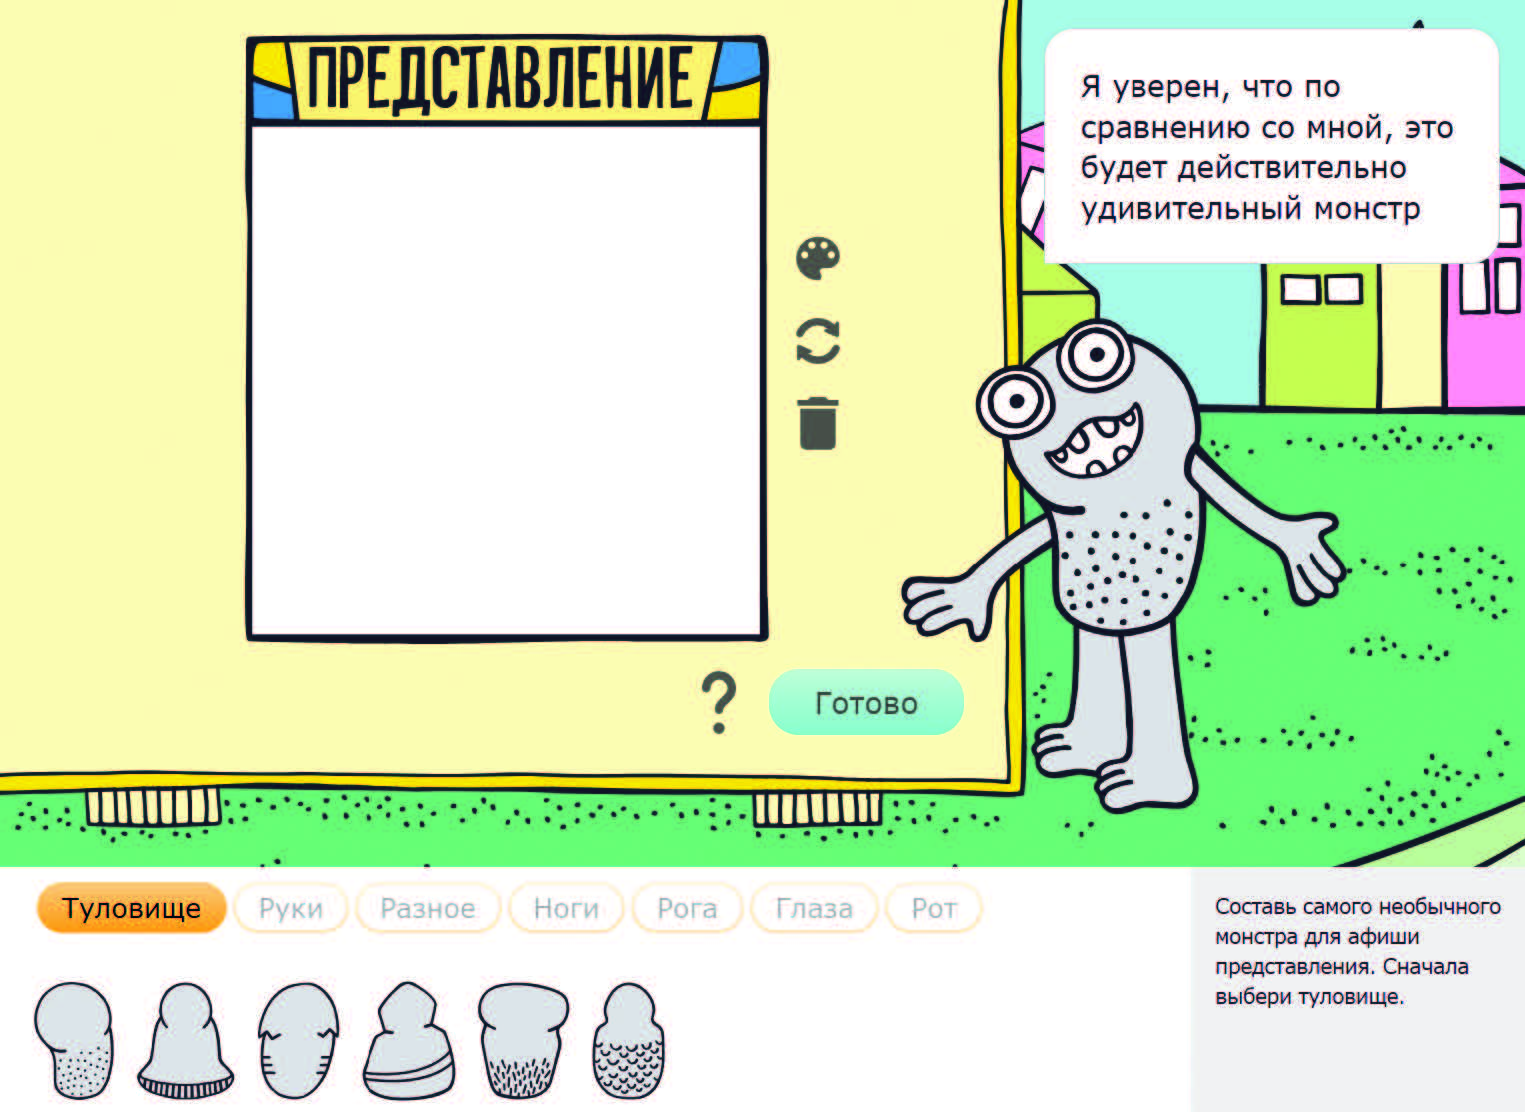
Fig. 1. Interface of the task «Monster» for evaluating creative thinking
In the second part of the task, it turns out that an emergency incident occurred during the performance and the test taker must draw up a sketch of the criminal based on a short description. The interface of this part of the task is not much different from the interface of the previous part and is shown in Fig. 2. The main difference lies in the instructions, according to which the test taker must create a sketch of a criminal monster, and not an unusual monster.
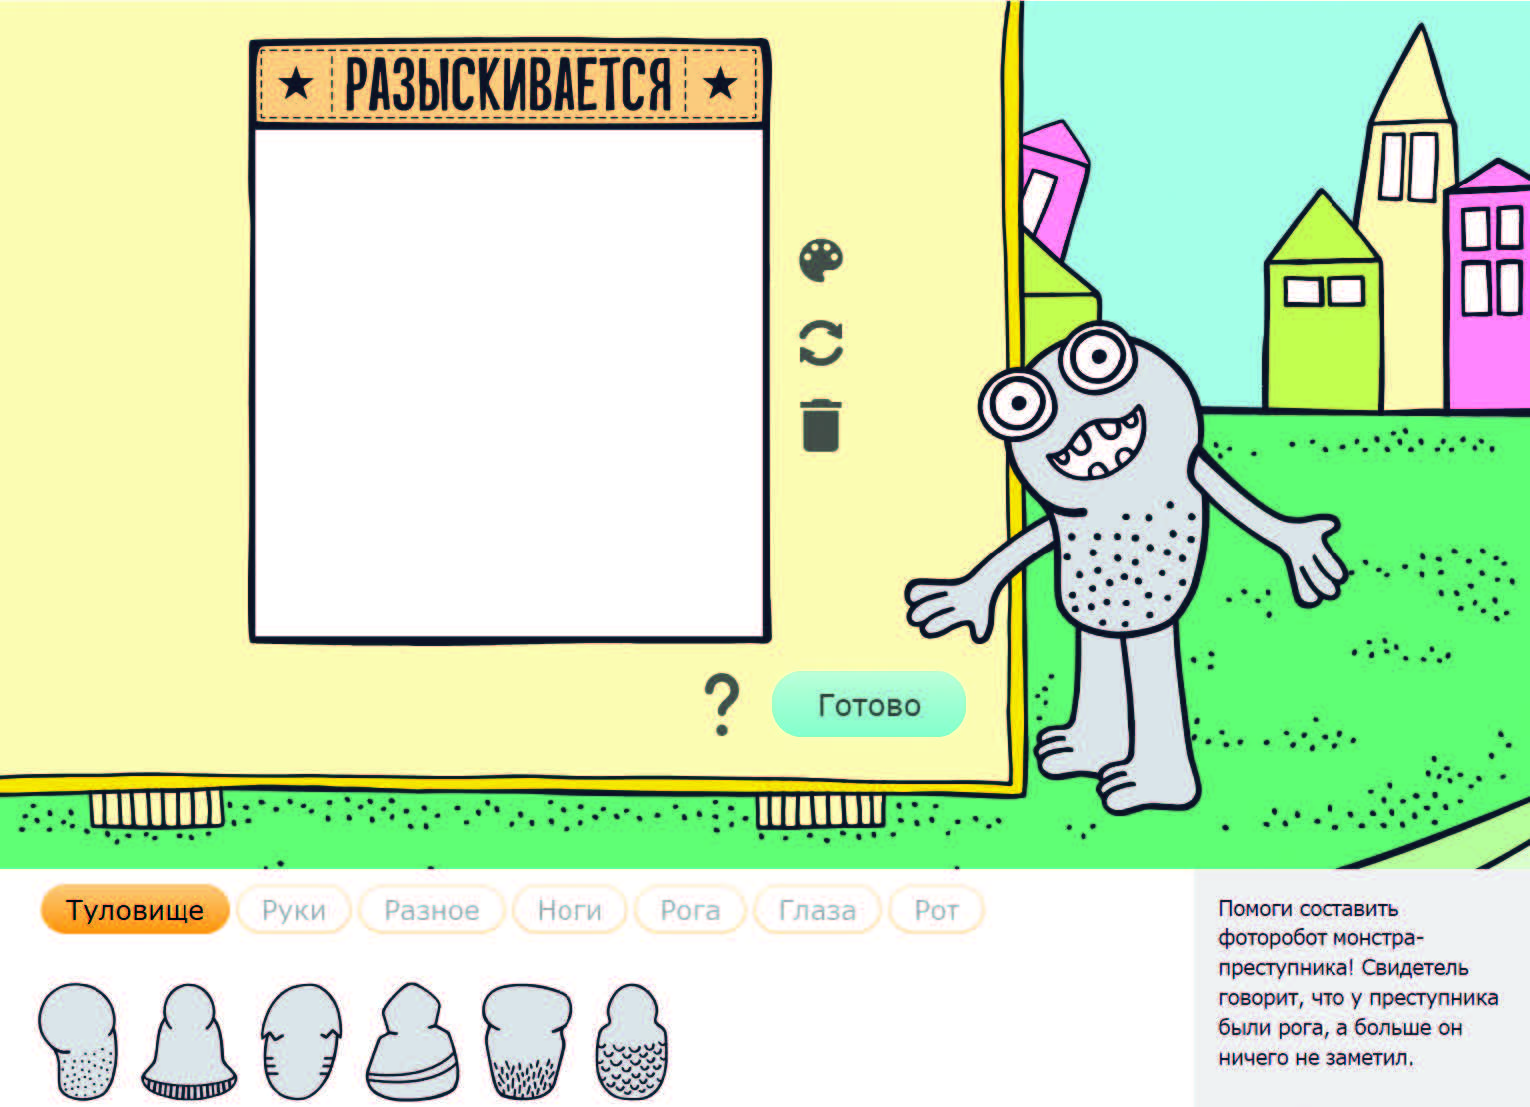
Fig. 2. Interface of the task «Monster» for evaluating critical thinking
Construct operationalization
To create the measurement instrument, we defined the theoretical framework of the creativity construct [Uglanova, 2020], which is based on both the cognitive approach [10, 27] and the concept of structured imagination [Ward]. Creativity within this instrument includes two sub-constructs:
1. Originality – the ability to generate new ideas and problems solutions, which can be expressed as new ideas and construct unobvious relations between existing ideas.
To evaluate the originality of the image constructed by the test taker, we compare it with the reference image. A reference is a proxy image that reflects the image that is most frequently found in the sample. When creating a reference for a task, we identify the most typical elements and their number through cognitive interviews and quantitative research at the pilot stage. The focus of the task on creativity is determined by the fact that as part of the task, test takers are asked to create a new image that should differ from the original one.
2. Elaboration – the ability to work out the proposed idea in depth, with a high degree of detail.
Similar to the measurement in the cognitive approach, in our study, elaboration is measured as the number of elements that are used in the solution, and their functional diversity.
Sample and procedure
Testing was conducted in the spring of 2022 in several cities of Russia. From all the samples, students were selected who fully completed the task «Monster» (each image contains at least 2 elements). Thus, the base for the analysis consisted of 823 fourth grade students.
The average task completion time is 15 minutes. Testing took place in schools under the supervision of a teacher with the consent of parents in accordance with research ethics. The results of the students were anonymized for analysis purposes.
Indicators
In scenario tasks of the instrument “4K”, skills are evaluated using indicators. Indicators are defined as the behavioral manifestations of a skill that were included in the scenario set by the developer, for example, test taker chosen or did not choose the correct behavior in the situation that arose. Behavioral display of creativity and critical thinking in the task «Monster», we consider the features of images created by test takers. These image features (indicators) have predefined scoring rules, shown in Table 1. The scoring rules were applied to each image separately. Below are the scoring rules based on the indicators of originality and elaboration.
Table 1. Scoring rules for creativity assessment in the task «Monster»
|
Indicator |
Scoring rules |
|
Originality |
|
|
origin1 |
1 - number of elements from the category Legs is different from 2 0 - number of elements from the category Legs is equal to 2 |
|
origin2 |
1 - number of elements from the category Hands is different from 2 0 - number of elements from the category Hands is equal to 2 |
|
origin3 |
1 - number of elements from the category Mouth is different from 1 0 - number of elements from the category Mouth is equal to 1 |
|
origin4 |
1 - number of elements from the category Eyes is different from 2 0 - number of elements from the category Eyes is equal to 2 |
|
symmetLegs1 |
1 - lack of symmetry for elements from the category Legs 0 - there is symmetry for elements from the category Legs |
|
symmetHands1 |
1 - lack of symmetry for elements from the category Hands 0 - there is symmetry for elements from the category Hands |
|
position1 |
1 - at least one element from the category Legs is not in the leg’s slots 0 - all elements from the category Legs are in the leg’s slots NA - elements from the category Legs are not used at all |
|
position2 |
1 - at least one element from the category Hands is not in the hand’s slots 0 - all elements from the category Hands are in the hand’s slots NA - elements from the category Hands are not used at all |
|
position3 |
1 - at least one element from the category Mouth is in the upper part of the torso 0 - all elements from the category Mouth are at the top part of the torso NA - elements from the category Mouth are not used at all |
|
position4 |
1 - at least one element from the category Eyes is in the upper part of the torso 0 - all elements from the category Eyes are at the top part of the torso NA - elements from the category Eyes are not used at all |
|
Elaboration |
|
|
nElements |
2 = 9 and more elements 1 = 5 to 8 elements 0 = 0 to 4 elements except elements from the category Various |
|
nVarious |
2 = 2 or more elements from the category Various 1 = 1 element from the category Various 0 = elements from the category Eyes are not used at all |
|
color |
1 - changed the color of the monster at least once 0 - did not change color |
|
turn |
1 - turned any element at least 1 time 0 - did not turn elements |
In addition to the indicator, the image creating process was recorded for each test taker in the form of a comma-separated record of all actions, for example, "Start, Add_Torso, Add_Hands, Add_Hands, Add_Legs, Add_Legs, Add_Mouth, Color, Add_Eyes, Finish". All possible actions are described in Table 2.
Table 2 Actions in the Action Log
|
Action log entry |
Action |
|
Start |
Beginning of the task |
|
Finish |
End of the task |
|
Color |
Changing the monster color |
|
Add_X, where X can be: Torso Hands Legs Horns Eyes Mouth Various |
Adding an element from the corresponding category |
|
Tur_X, where X is same as the case with Add, except Torso, because the torso is always located in the center of the canvas and does not rotate |
Rotate an element from the corresponding category |
|
Del_X, where X is same as the case with Add |
Delete an element from the corresponding category |
|
Que |
Using help by clicking on the question mark |
Data analysis methodology
To assess the level of creativity, the methodology of confirmatory factor analysis (CFA) on ordinal variables was used [Bock]. We use the weighted least squares method using the polychoric correlation matrix (WLSMV) for reliable estimation due to the categorical order of the data [Brown, 2012]. The model's fit to data was determined based on the comparative fit index (CFI), Tucker-Lewis index (TLI), and the root mean square error of approximation (RMSEA). The first two indexes show the distance of the constructed model from the null model, in which no variable is associated with another [Bentler], and the last one is based on the analysis of model residuals [Shi]. We used the following critical values of the coefficients, following the generally accepted cut-offs (Yu, 2002): CLI>0.95; TLI>0.95; RMSEA≤0.06. To improve the quality of the model, modification indices based on the analysis of model residues were used.
The unit of analysis in models is the indicator. The relationship between the indicator and the factor can be described based on the factor loading of the indicator in the CFA model. A statistically significant and positive factor loading indicates the presence of this relationship, and a higher value of the factor loading indicates a higher relationship of the indicator with the studied factor.
Factor scores from the CFA model calculated using the regression method are used to assess the level of ability formation [for more information, see 8]. Factor scores are a standardized continuous scale with a mean of 0 and a standard deviation equal to the root of the square of the multiple correlation between all indicators and the factor. Thus, the obtained factor scores can be used for further ranking of test takers.
To work with data from the task performance process, the recorded variables were divided into N-grams,small sequences of certain actions, where N is the number of actions in this sequence. The shortest sequences are unigrams, i.e. sequences of one action. Bigrams and trigrams are also used in the work - sequences of two and three actions, respectively. If the test taker performs 16 actions while completing the task, then this sequence contains 16 unigrams, 15 bigrams, and 14 trigrams. N-grams can be repeated both between different test takers and within the process of a task performed by one test taker. Based on the Table 2 we can assume that there will be 24 unique unigrams in the task, and the "Start" and "Finish" unigrams must occur in all tasks. Due to the different frequency of occurrence, certain sequences make a different contribution to distinguishing groups of test takers, so the accepted practice when working with N-grams is to weigh them [He, a] according to the formula:
where i,j is a certain action i (N-gram) in a certain sequence j,
N is the total number of sequences,
ni,j – frequency of action i in the sequence j,
ni - frequency of action i in all sequences.
To compare the task performance process, we calculate the weighted frequency of N-grams in different subgroups to determine how much one group differs from another in terms of action frequencies. According to the null hypothesis, two sets are randomly equivalent, so the distribution of their actions is proportional to each other. To assess the deviation from this null hypothesis, the chi-square criterion (χ2) is calculated [for more information, see 2]. N-grams with higher values of χ2 are the sequences of actions that distinguish the task performance process in the selected subgroups. At the significance level of 0.05, the critical value of χ2 is 3.84. That is, if the observed value exceeds it, then we can be 95% sure that the action occurred more often in one of the two subgroups. The higher the value of χ2, the greater the differences between the subgroups.
All calculations were performed using the programming language for statistical data processing R version 4.3.1 using the lavaan package [Rosseel] for evaluating CFA models and the ngram package [Schmidt D, Heckendorf] for calculating N-grams.
Results
Assessment the level of creativity
First, models of confirmatory factor analysis were constructed to determine the level of creativity according to the indicators included in the task. Two separate models were constructed for the Originality and Elaboration. The fit indexes of both models are presented in Table 3 and indicate that both models fit well to the data.
Table 3. Indicators of compliance данным with the CFA model dataей КФА
|
Index |
Originality |
Elaboration |
|
CFI |
0.980 |
0.973 |
|
TLI |
0.979 |
0.961 |
|
RMSEA |
0.039 |
0.045 |
Figure 3 shows the factor structure of the model for the Originality. For all three images of monsters, correlations between indicators of symmetry and hand position, symmetry and the original number of hands, symmetry and the original number of legs were added to the model to better match the data.
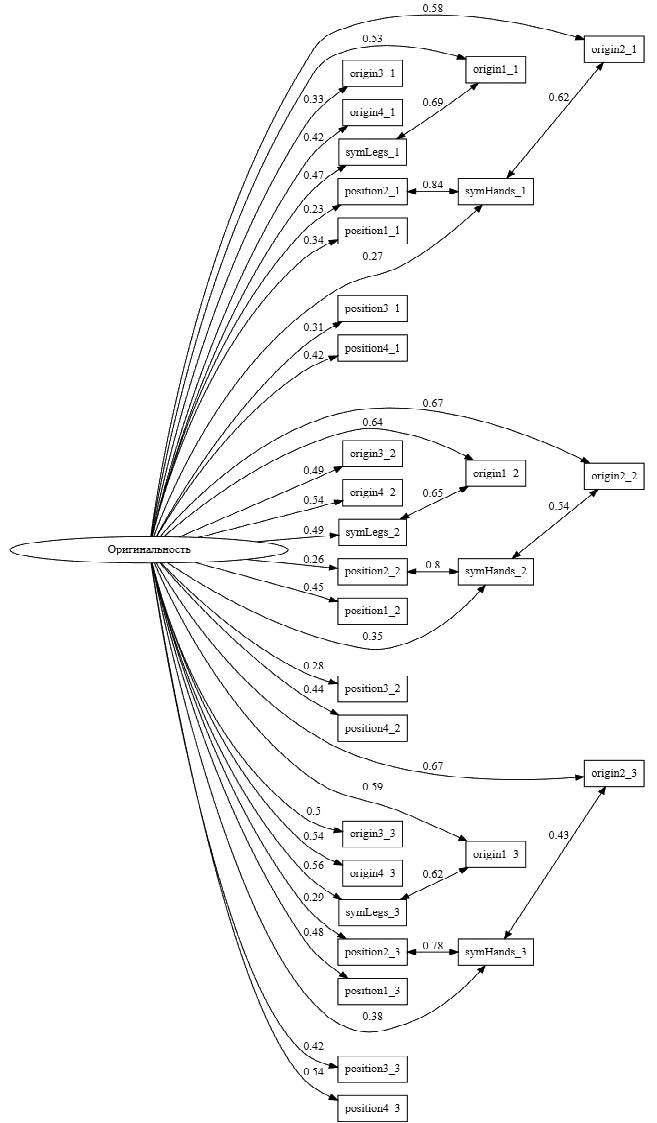
Figure 3. Factor structure of the Originality
All standardized factor loadings are significant (p < 0.05) and range from 0.22 to 0.67 with an average value of 0.45, which is an acceptable value.
Figure 4 shows the factor structure of the model for the Elaboration. In this model, correlations were also added between related indicators, namely rotation, the number of elements except the category Various, and the number of elements from the category Various.
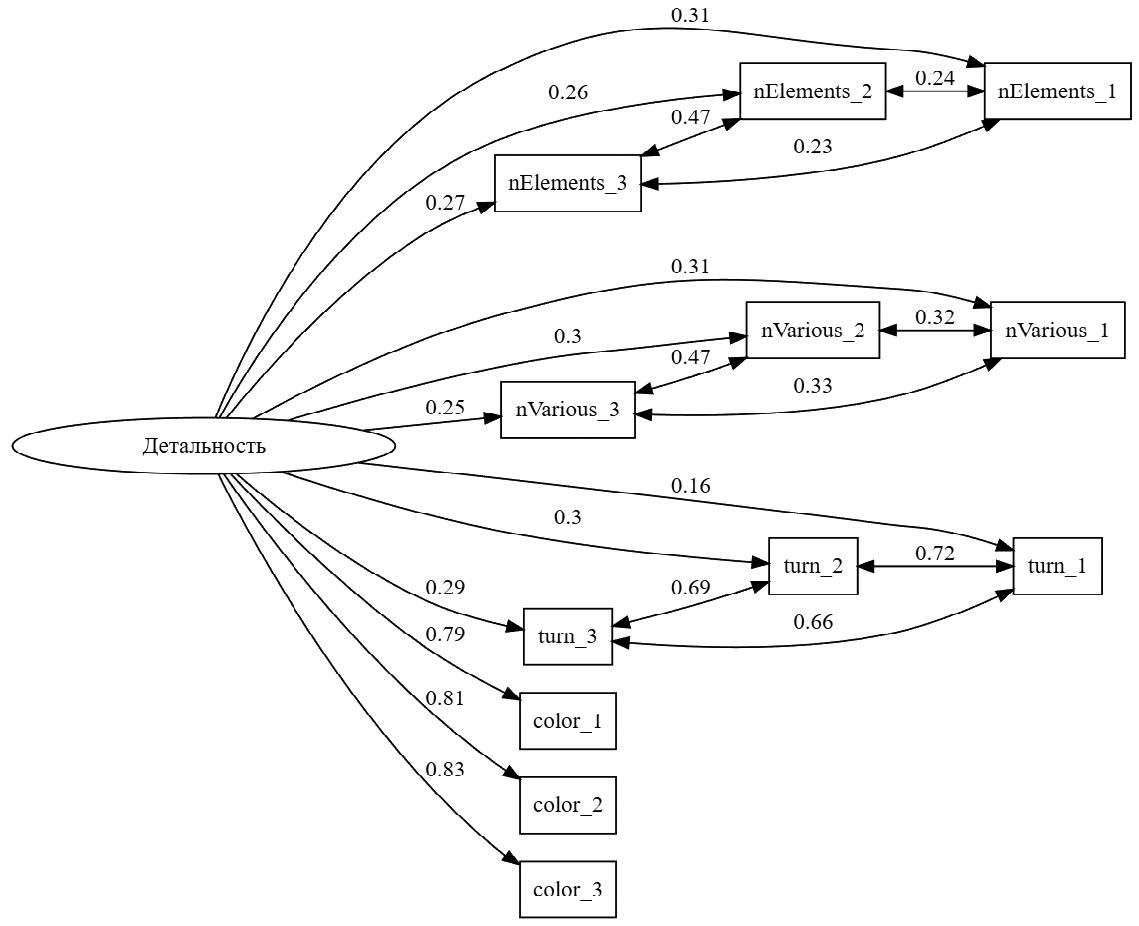
Figure 4. Factor structure of the Elaboration
All standardized factor loadings are significant (p<0.05) and range from 0.16 to 0.83 with an average value of 0.41.
Comparison of the process of performing a creative thinking task by students with high and low levels of creative thinking
To answer the first research question, we looked at the first images of a monster that were created by test takers when solving a task aimed at assessment creative thinking. Unigrams, bigrams, and trigrams were constructed, since longer sequences do not have a high frequency in the data and are difficult to interpret. Table 4-5 shows the chi-square value when comparing two groups of test takers by the level of formation of two creativity sub-constructs (originality and elaboration), and 200 students with the highest factor score for the corresponding substructure were selected in the high - level group, and 200 students with the lowest factor score were selected in the low-level group.
Table 4. Difference in the frequency of N-grams in the process of performing tasks for creative thinking in students with high and low levels of originality
|
High level |
Low level |
||
|
Action |
χ2 |
Action |
χ2 |
|
unigrams (χ2 > 5) |
|||
|
Tur_Various |
5,3 |
Del_Mouth |
8 |
|
|
|
Tur_Legs |
6,7 |
|
|
|
Tur_Mouth |
6,5 |
|
bigrams (χ2 > 10) |
|||
|
Add_Various Add_Eyes |
26,1 |
Tur_Hands Color |
17 |
|
Add_Various Add_Various |
17,1 |
Add_Eyes Add_Eyes |
14,6 |
|
Add_Mouth Add_Mouth |
15,1 |
Add_Mouth Tur_Mouth |
12,9 |
|
Del_Legs Add_Eyes |
15,1 |
Tur_Mouth Tur_Mouth |
12,9 |
|
Add_Horns Add_Legs |
14,8 |
Color Add_Horns |
11,3 |
|
Add_Legs Finish |
14,2 |
Tur_Horns Add_Various |
10,8 |
|
Add_Various Del_Hands |
10,3 |
Tur_Hands Add_Mouth |
10,2 |
|
Color Del_Legs |
10,3 |
|
|
|
Del_Horns Add_Various |
10,3 |
|
|
|
Del_Horns Finish |
10,3 |
|
|
|
Del_Legs Color |
10,3 |
|
|
|
Tur_Horns Add_Legs |
10,3 |
|
|
|
trigrams (χ2 > 20) |
|||
|
Add_Hands Add_Hands Add_Hands |
33 |
Add_Mouth Add_Eyes Add_Eyes |
24,5 |
|
Add_Eyes Add_Eyes Add_Eyes |
27,1 |
Add_Eyes Add_Eyes Finish |
20 |
|
Add_Hands Add_Legs Finish |
27,1 |
Del_Torso Add_Torso Add_Legs |
20 |
|
Add_Legs Add_Various Add_Hands |
27,1 |
|
|
|
Add_Mouth Add_Legs Finish |
23,3 |
|
|
Among unigrams, there are no significant differences between students with a high and low level of originality. Based on bigrams, we can conclude that high-level students are more likely to use elements from the category Various, which is logical, since this category contains unique elements that responsible for originality of the final image. Students with a high level of originality also have bigrams that include the action of deleting an element, which can indicate a creative process when the student tries different elements to create an original image. Among the trigrams, the greatest difference between students with different levels of originality is observed in the sequences of adding three elements from the category (hands and eyes). This confirms the existing scoring rules for originality, since for these categories the number of elements in the reference is two, and if the test taker adds three elements at once, this is associated with a high score for originality.
Table 5 Difference in the frequency of N-grams in the process of performing tasks for creative thinking in students with high and low levels of elaboration
|
High level |
Low level |
||
|
Action |
χ2 |
Action |
χ2 |
|
unigrams (χ2 > 4) |
|||
|
Color |
64,4 |
Del_Torso |
18,1 |
|
Tur_Horns |
27 |
Que |
18 |
|
Tur_Eyes |
9,4 |
Add_Mouth |
5,9 |
|
Tur_Various |
8,6 |
Del_Eyes |
4,8 |
|
Tur_Legs |
7,2 |
Del_Hands |
4,6 |
|
bigrams (χ2 > 35) |
|||
|
Add_Torso Color |
75,8 |
Add_Torso Add_Mouth |
75,5 |
|
Color Color |
59,6 |
Add_Torso Add_Eyes |
73 |
|
Color Finish |
47,1 |
Add_Torso Add_Hands |
70.7 |
|
Color Add_Eyes |
44,9 |
Add_Legs Finish |
65 |
|
Color Add_Legs |
43,4 |
Add_Hands Finish |
62,2 |
|
Color Add_Hands |
40.9 |
Add_Hands Add_Legs |
58,4 |
|
Add_Horns Tur_Horns |
39,5 |
Add_Eyes Finish |
57 |
|
Color Add_Various |
39,2 |
Add_Torso Add_Legs |
47.9 |
|
Color Add_Mouth |
35.6 |
|
|
|
trigrams (χ2 > 25 for high level and χ2 > 45 for low level) |
|||
|
Start Add_Torso Color |
72,8 |
Start Add_Torso Add_Mouth |
88,9 |
|
Add_Torso Color Color |
42,6 |
Start Add_Torso Add_Hands |
83,6 |
|
Add_Horns Tur_Horns Tur_Horns |
37,2 |
Add_Hands Add_Hands Finish |
74,3 |
|
Color Add_Legs Add_Legs |
35,9 |
Add_Torso Add_Hands Add_Hands |
72,4 |
|
Color Add_Hands Add_Hands |
34 |
Start Add_Torso Add_Legs |
66,7 |
|
Tur_Horns Tur_Horns Tur_Horns |
32,5 |
Start Add_Torso Add_Eyes |
61,9 |
|
Add_Horns Add_Horns Tur_Horns |
30 |
Add_Torso Add_Legs Add_Legs |
59 |
|
Add_Torso Color Add_Legs |
30 |
Add_Hands Add_Hands Add_Legs |
55,8 |
|
Color Add_Eyes Add_Eyes |
30 |
Add_Mouth Add_Eyes Finish |
51,2 |
|
Add_Torso Color Add_Eyes |
26,7 |
Add_Torso Add_Mouth Add_Hands |
51,2 |
|
Color Color Color |
26,7 |
Add_Legs Add_Legs Finish |
50,6 |
|
|
|
Add_Torso Add_Eyes Add_Eyes |
48,9 |
Students with a high level of elaboration are significantly more likely to change the color of the monster and rotate elements from different categories. This is consistent with the scoring rules for elaboration, as these actions are associated with higher scores for elaboration indicators. At the same time, students with a low level of elaboration remove items from different categories, which reduces the total number of monster items and indicates a low level of elaboration of the test taker. In addition, it is observed that unigram addressed to help button is more common in students with a low level of elaboration. This can be explained by the fact that such students may not have understood how to work in the constructor and therefore could not create a monster and show their creativity.
Comparison of the process of completing tasks for creative and critical thinking
To answer the second research question, the first image of the monster was taken each, which were created by test takers while solving two parts of the task: to assess creative and critical thinking. As in the previous section, unigrams, bigrams, and trigrams were constructed, but among the trigrams, we selected those that occur at least 10 times in all solutions to remove very rare sequences, even if they allow us to distinguish solutions. Table 6 shows the chi-square value when comparing two groups of monsters (N-grams with the highest chi-square value in each group were selected).
Table 6. Difference in the frequency of N-grams in the process of performing tasks for creative and critical thinking
|
Creative thinking |
Critical thinking |
||
|
Action |
χ2 |
Action |
χ2 |
|
unigrams (χ2 > 15) |
|||
|
Del_Legs |
101,8 |
Add_Horns |
73,8 |
|
Del_Hands |
52,5 |
Tur_Hands |
50,6 |
|
Del_Mouth |
38,5 |
Tur_Horns |
23,1 |
|
Del_Eyes |
34,2 |
Add_Mouth |
21,9 |
|
Del_Torso |
30,3 |
Add_Eyes |
20 |
|
Del_Horns |
27,6 |
Add_Hands |
18,3 |
|
Del_Various |
24 |
Add_Legs |
17,2 |
|
bigrams (χ2 > 60) |
|||
|
Del_Hands Add_Hands |
111,1 |
Add_Torso Add_Horns |
238,4 |
|
Del_Legs Add_Legs |
96,6 |
Add_Torso Add_Eyes |
88,7 |
|
Add_Legs Del_Legs |
88,2 |
Add_Eyes Finish |
83,1 |
|
Color Color |
79,4 |
Add_Horns Finish |
72,1 |
|
Del_Legs Del_Legs |
78,2 |
Add_Legs Finish |
70,6 |
|
Add_Hands Del_Hands |
64,7 |
|
|
|
trigrams (χ2 > 60) |
|||
|
Add_Torso Color Color |
106,1 |
Start Add_Torso Add_Horns |
187,8 |
|
Del_Legs Add_Legs Add_Legs |
103,9 |
Add_Torso Add_Horns Add_Horns |
109,9 |
|
Add_Hands Del_Hands Add_Hands |
99,4 |
Add_Torso Add_Horns Add_Mouth |
100 |
|
Add_Legs Add_Legs Del_Legs |
85,5 |
Start Add_Torso Add_Eyes |
79 |
|
Del_Hands Add_Hands Add_Hands |
78,6 |
Add_Torso Add_Horns Add_Legs |
74,6 |
|
Add_Legs Del_Legs Add_Legs |
77 |
Add_Legs Add_Eyes Finish |
68,4 |
|
Del_Hands Add_Hands Tur_Hands |
66,2 |
|
|
|
Add_Torso Color Add_Legs |
63 |
|
|
|
Tur_Legs Tur_Legs Tur_Legs |
60,9 |
|
|
|
Color Add_Legs Add_Legs |
60,8 |
|
|
Among unigrams there are clear differences between the solutions. In the creative thinking task, test takers are significantly more likely to delete elements in all 7 categories. In the critical thinking task, test takers significantly more often add elements from the category Horns, which is explained by the task, because when compiling a sketch of a criminal, who according to eyewitnesses had horns, the addition of elements from this category shows that the test taker has correctly understood the task and has shown critical thinking. But at the same time, in the critical thinking task, test takers are more likely to add elements from other categories as well and turn hands and horns. Based on bigrams and trigrams, we can say that in the creative thinking task, students more often change the color of the monster, while in the critical thinking task, students leave its original color (gray). They also remove and rotate elements from different categories, which indicates a creative process, while in the critical thinking task test takers try to simply assemble the monster from parts, so after weighing, actions related to adding elements prevail in the process of completing the critical thinking task.
Discussion of the results and conclusion
The purpose of this work was to determine the possibilities of using process data of the task performance in the framework of assessment creative thinking. Using instrument is implemented in a digital environment and consisting of two parts: for evaluating creative and critical thinking.
At the first stage of the analysis, CFA models were constructed to obtain test takers' scores for creative thinking. Further, these scores were used to identify groups of test takers with high and low levels of originality and elaboration.
At the next stage, the method of N-grams, small sequences of actions extracted from the test takers' action log, was chosen to analyze data about the task performance process. Sequences from one to three actions were used.
We used the χ2 criterion to compare the frequency of occurrence of different N-grams in students with high and low levels of creative thinking. As a result, a few N-grams were identified that are associated with different levels of creative thinking. For example, using an item from the category Various indicates a high level of originality, and deleting an item from the category Torso indicates a low level of elaboration.
In the second research question, we compared the performance of creative and critical thinking tasks implemented in the same constructor. Based on the frequency of occurrence of certain N-grams, we found out that different tasks work accordingly. So, in the creative thinking task, students are more likely to delete and rotate elements, change the color of the image, and in the critical thinking task, students are more likely to add those elements that are necessary for the correct solution of the task.
As a conclusion, it can be noted that the chosen method of analyzing data on the task performance process turned out to be useful and can be used to understand the behavior of test takers with different levels of skill development (in this study, creative thinking), it can also be usedin order to check the quality of tasks.
Using data about the task performance process can also enrich the scoring system and feedback on test results. For example, when analyzing students with a high and low level of originality, we found a correlation between the presence of bigrams in the test taker's profile(deleting and then adding elements), and a high level of originality. This relationship is not considered in the current scoring system. However, special attention should be paid in order to better understand the intended use of such data. This is important because expanding towards the accumulation of more complex data can challenge traditional approaches to scaling assessment results in educational testing and can be handled inadequately by test users [Rupp].
Based on the analysis of the task performance process, we found that other characteristics of the test takers, such as their level of digital literacy, can also influence the result of the creative thinking task. This can be supported by the fact that students with a low level of elaboration more likely refered to the task reference, which contained on working with the constructor, than students with a high level. It can be assumed that due to the low level of digital literacy, they did not understand how to perform the task of evaluating creative thinking in a digital environment. This observation describes one of the limitations of modern assessment instruments, namely the possible interference of other factors.
The limitations of this study include a small sample for analysis, which is why some N-grams were very rare in the aggregate of solutions. For this reason, during the analysis stage, we combined actions by category (for example, adding or turning a hand), and did not consider specific elements within the category (adding hand #1 or turning hand #2). Analysis at the level of individual elements is part of our plans to refine the constructor test takers use to create images. There is a hypothesis that certain elements within categories may be associated with the level of creativity, for example, test takers with a high level of originality will tend to add hand #3 than other hands.
Further areas of research include analyzing data on the task performance time, namely, the time between certain actions in the task execution sequence, as well as using other approaches to analyze data on the task solving process in a digital environment. One of these approaches is the Longest Common Sequence method [He], a sequence analysis method used in natural language processing and biostatistics in order to understand the strategy of test takers when solving digital problems. This approach can be applied to the task «Monster» considered in the article, since among the solutions you can select non-original solutions (repeating the reference) and calculate how much the students' solutions will differ from such a solution. It is also possible to calculate the proximity of decisions made by different students, which will allow us to identify certain clusters of decisions that can be used to draw conclusions about the creative thinking of test takers.