Introduction
Despite the continuing interest of modern scientists in the topic of migration, the problem of migrant typology remains underdeveloped (
Luthra, Platt, Salamońska, 2018). The development of migration typology is currently mainly based on general criteria: crossing a state border (internal and international), stationarity (temporary, permanent), conditions of movement (voluntary, forced), purposes of stay (labor and economic, family, climatic), legal status (legal, illegal migrants) (
Petrov, 2009). Even though the following typology is based on sociological characteristics, it has also become widespread in psychological sciences.
The most common typology nowadays is that of J. Berry (
Abu-Rayya et al., 2023; Berry, 2017). It is based on the type of ethnic identity of the migrant (acceptance or non-acceptance of one's ethnic identity) and the interaction of the migrant with the host society (inclusion or isolation). Thus, four migration profiles are formed: assimilation (displacement of the native culture by a foreign one), integration (mutual coexistence of cultures), marginalization (alienation from both one's own and the foreign culture) and separation (isolation of one's own culture from the foreign one).
The given classification is confirmed by numerous studies. However, the explanation of the typology is based on ideas of adaptation processes in the pre-digital era and does not take into account all modern realities, and, therefore, needs to be rethought considering new data related to multiculturalism, digitalization of social contacts and the mobility of migration flows.
In the meantime, the digitalization of social life takes the concept of migration to a new level. This particular state is also evident at the methodological level, when the individual as a social construct is studied not only through belonging to real groups, but also as a multitude of digital avatars, presented in real and digital spaces (
Bahri, 2024;
Kumar, Shankar, 2024;
Mahalakshmi, Bharath, Kautish, 2024). As noted in the earlier publications describing the previous stages of the current study, the problem of the nature of the socio-psychological adaptation of migrants has been presented, which takes modern ideas about migrants’ integration to a new society beyond the ideas of acculturation stress or the inevitability of assimilation (Mironova, Ruonala. 2024; Mironova, Ruonala, 2023).
Issues related to digitalization have become especially evident since the pandemic, with the growth of opportunities for remote work, the emergence of digital nomads who can work in one country, live in another, communicate in the language of a third country, and be in relationships with a representative of a fourth culture (Yang, Shao, Zhao, 2025).
Another interesting development in the field of migrant typology is the work of V.V. Konstantinov, who views migration as a more complex, nonlinear process. Thus, the identification of migration profiles can be associated with the mechanisms of their adaptation (idealization, imitation and psychic identification, selective adaptation, social identification, rationalization and compensation, sublimation and intellectualization) and the psychological conditions for mutual adaptation of migrants and the host society (objective and subjective adaptation criteria) (
Konstantinov, 2018).
This concept does not only consider the two-way direction of migration processes, taking into account the mutual influence of the migrant and society (objective criteria) but also draws attention to personal characteristics of individuals, such as the structure of the migrant's psychological defenses.
It should be noted that there is a lack of research devoted specifically to the psychological aspects of migration (
Zaitseva, 2024;
Chumak, 2021), namely, the internal characteristics of a person that influence the decision to move, expectations from a new country and the process of socio-psychological adaptation, as well as the typology of migrants based on the study of a migrants' personality or their behavior as members of various social groups. At present, when studying the characteristics of the socio-psychological adaptation of migrants, scientists most often pay attention to the obvious, superficial processes that migrants face, such as difficulties in finding work, learning the language of a new country, and assistance from the diaspora (
Bhandari, 2024;
Caidi, Muzaffar, Kalbfleisch, 2024, Foged M. et al., 2024).
A solution to the mentioned problems is necessary for a better understanding of the processes occurring with migrants and providing them with qualified psychological support in adapting to the conditions of a new country, taking into account not only external but also internal factors.
The presented paper is the final stage of a large-scale research of the socio-psychological adaptation of women who married foreigners. Within the framework of this study, the focus of the study of adaptation is the personality of individuals belonging to a certain social group.
The selection of this study group is not coincidental. As members of the so-called "prosperous migrants" category, marital migrants, who relocate to join their spouses and therefore also move to their culture, are less affected by adverse factors such as economic pressure to work or significant loss of social status. They are also less affected by traumatic circumstances such as forced displacement from conflict zones, PTSD, or depression during the adaptation process. Consequently, in this group, psychological factors directly associated with the dynamics of integration into the host society take precedence (Mironova, Ruonala, 2024).
In previous stages of this research, the specific psychological difficulties faced by marital migrants during relocation were analyzed (Mironova, Ruonala, 2023), and the model of successful socio-psychological adaptation within this group were identified (Mironova, Ruonala, 2023). Furthermore, a theoretical model of successful socio-psychological adaptation for women who married foreigners was proposed. Empirical findings from studies conducted on the same sample discussed in this paper have also been published. These include a qualitative study featuring content analysis of respondents' answers to open-ended questions about their adaptation experiences (
Ruonala, 2024).
The purpose of the present paper is to identify and study types of socio-psychological adaptation of women who married foreigners, depending on the indicators of their adaptability and maladaptation.
Methodology
The sample of this study is 154 women, 80 of whom moved to Russia and the remaining 74 moved from Russia to other countries. According to social characteristics, the vast majority of the sample belongs to the middle class and has higher education. The sample itself, methods and results of the adaptability and maladaptation profile of the studied group are described in more detail in the previous stages of the dissertational research (
Ruonala, 2024). The survey was conducted anonymously on a voluntary basis.
To achieve the objectives of this study, reliable and valid methods were carefully selected and implemented. The level of socio-psychological adaptation among the respondents was assessed using the “Social and Psychological Adaptation Test-Questionnaire” edited by A.K. Osnitskiy.
The type of attachment to a partner was identified through the “Attachment to Close People Questionnaire” edited by N.V. Sabelnikova and D.V. Kashirskiy.
Interpersonal communication characteristics, including expected and actual behaviors toward oneself and others, were evaluated using the “Interpersonal Relations Questionnaire” edited by A. Rukavishnikov.
To examine respondents’ attitudes toward time, the “Zimbardo Time Perspective Inventory” was employed.
The level of tolerance for uncertainty was measured using the “Badner’s Scale of Tolerance for Uncertainty” as adapted by G.U. Soldatova.
Factors influencing aspiration levels were identified using the “Assessment of the Level of Aspirations” by V.K. Gerbachevskiy.
Differences between respondents' real and ideal self-concepts were explored through the “Self-Concept Clarity Scale” by J. Campbell, adapted by V.V. Vdovenko and S.A. Shchebetenko.
Finally, the level and characteristics of psychological well-being were assessed with the “Psychological Well-Being Scale” developed by K. Ryff and adapted by T.D. Shevelenkova and P.P. Fesenko.
The study also incorporated a questionnaire addressing the social characteristics of respondents, including length of residence in the new country, age, presence of children, level of education, employment status, proficiency in the host country's language, and income level.
The basis for dividing the participants into groups was the results of using the “Social and Psychological Adaptation Test-Questionnaire” method. In this work, the level of socio-psychological adaptation is calculated through the ratio of the results of the adaptability and maladaptation scales of the above-mentioned questionnaire. The results of the participants were divided into groups in accordance with the range of values in which their indicators fall on the "adaptability" and "maladaptation" scales, namely: optimal values, below optimal values, above optimal values (9 groups in total). As a result, a matrix of adaptability values was compiled, presented in Table 1.
Table 1 / Таблица 1
Adaptation matrix of respondents (number of people)
Матрица адаптации респондентов (количество человек)
|
Level /
Уровень
|
Adaptability / Адаптивность
|
|
High / Высокая
|
Optimal / Оптимальная
|
Low /
Низкая
|
|
Maladaptivity / Дезадаптивность
|
High / Высокая
|
3
|
1
|
0
|
|
Optimal / Оптимальная
|
25
|
70
|
1
|
|
Low / Низкая
|
34
|
16
|
2
|
According to the data obtained, the questionnaire results are significantly biased towards high adaptation rates (i.e. high adaptability values and low maladaptation values). This may indicate both the presence of false adaptation in the sample studied and the fact that this questionnaire, widely used in research, might require revision.
When forming the final sample of the study, it was decided to exclude small groups from the analysis, since their values may act as “outliers” and negatively affect the quality of the data obtained. Thus, the sample in the second and third stages consisted of 145 women.
Further, the results of the questionnaire survey in these groups were analyzed using the methods of mathematical statistics, namely, to identify statistically significant differences between groups, the nonparametric Kruskal-Wallis test was used, as well as a correlation analysis within each of the groups using the nonparametric Spearman test to identify adaptability and maladaptation profiles for each of the groups.
To illustrate the data obtained, a semi-structured interview was conducted with four women belonging to different groups.
Let us consider the results obtained in more detail.
Research results
The study was carried out in three stages. In the first stage, the sample was tested for homogeneity in order to exclude the influence of social characteristics on the results of the study. Since women from different countries, with different living standards, education and other social characteristics took part in the study, it was necessary to exclude the influence of these factors on the results of the questionnaires. For this purpose, all values were converted to nominal scales.
At the second stage of the study, the presence of statistically significant differences between the samples on the scales of the methods used was studied.
The third stage of the current study was devoted to identifying the profiles of the socio-psychological adaptation of the sample group by studying the correlations between the indicators of adaptability and maladaptation and the quantitative indicators of the personality of the subjects.
To solve the tasks set at the first and second stages of the study, the nonparametric Kruskal-Wallis criterion was used, and at the third stage, the Spearman correlation criterion was used. These criteria were chosen based on the fact that the distribution of the subjects on a number of scales may differ from normal. Let us consider the results of each stage in more detail. The results of checking the sample for homogeneity by social indicators are presented in Table 2.
The weight of answers in Tables 3-10 is gradiently color coded with white representing a low average score in the group and dark green indicating a very high average score in the group. The results will be further explored upon in the discussion below.
Table 2 / Таблица 2
Differences in groups by social indicators
Различия в группах по социальным показателям
|
Social indicators /
Социальные показатели
|
Kruskal-Wallis test / Критерий Краскела—Уоллиса
|
Level of statistical significance / Уровень значимости
|
|
Age / Возраст
|
3,622
|
0,305
|
|
Education level / Уровень образования
|
1,758
|
0,624
|
|
Residence period in a new country /
Срок жизни в новой стране
|
3,351
|
0,341
|
|
Command of language of a new country / Владение языком новой страны
|
1,263
|
0,738
|
|
Martial satisfaction /
Удовлетворенность браком
|
2,293
|
0,514
|
|
Having children / Наличие детей
|
3,910
|
0,271
|
|
Living with children / Проживание с детьми
|
1,817
|
0,611
|
|
Work situation satisfaction / Удовлетворенность ситуацией с работой
|
2,115
|
0,549
|
|
Level of income / Уровень доходов
|
6,627
|
0,085
|
As can be seen from the data presented in Table 2, there are no statistically significant differences between the groups studied, thus it can be concluded that the final results of the study are not influenced by the social characteristics of the respondents.
Let us consider in more detail the differences in the questionnaire indicators, as well as the differences in the social indicators of the identified groups sequentially. The data are presented in Tables 3–10. For clarity, the data are divided into groups. The main tables present the average values for the samples.
Table 3 / Таблица 3
Comparison of group indicators according to “Social and Psychological Adaptation
Test-Questionnaire” (average values by group and the Kruskal-Wallis test)
Сравнение показателей групп по методике оценки социально-психологической адаптации (средние значения по группам и критерий Краскела-—Уоллиса)
|
Scales of the questionnaire / Шкалы опросника
|
Group 1 / Группа 1
|
Group 2 / Группа 2
|
Group 3 / Группа 3
|
Group 4 / Группа 4
|
Kruskal-Wallis test / Критерий Краскела—Уоллиса
|
Level of statistical significance / Уровень значимости
|
|
Adaptability / Адаптивность
|
42,26
|
121,04
|
48,91
|
109,14
|
105,789
|
0,000*
|
|
Maladaptivity / Дезадаптивность
|
98,94
|
24,21
|
40,78
|
87,36
|
84,932
|
0,000*
|
|
Self-acceptance / Самопринятие
|
43,75
|
119,51
|
98,66
|
75,22
|
81,762
|
0,000*
|
|
Acceptance of others / Принятие других
|
45,63
|
115,24
|
92,53
|
79,7
|
68,273
|
0,000*
|
|
Emotional comfort / Эмоциональный комфорт
|
50,19
|
116,94
|
79,38
|
73,02
|
58,286
|
0,000*
|
|
Internality / Интернальность
|
44,63
|
121
|
94,03
|
73,7
|
80,486
|
0,000*
|
|
Striving for dominance / Стремление к доминированию
|
59,03
|
106,31
|
66,22
|
71,16
|
29,620
|
0,000*
|
|
Escapism / Эскапизм
|
88,08
|
41,31
|
48,84
|
89,34
|
37,601
|
0,000*
|
Note: * — p ≤ 0.05, there are statistically significant differences between the groups; the weight of answers in the table is gradiently color coded with white representing a low average score in the group and dark green indicating a very high average score in the group.
The obtained analysis shows the presence of statistically significant differences in the groups on all scales of the questionnaire. Thus, it can be said that the identified groups are indeed different in terms of adaptability, maladaptation and other characteristics describing social and psychological adaptation.
Table 4 / Таблица 4
Attachment to close people questionnaire
(average values by group and the Kruskal-Wallis test)
Опросник привязанности к близким людям
(средние значения по группам и критерий Краскела—Уоллиса)
|
Scales of the questionnaire / Шкалы опросника
|
Group 1 / Группа 1
|
Group 2 / Группа 2
|
Group 3 / Группа 3
|
Group 4 / Группа 4
|
Kruskal-Wallis test / Критерий Краскела—Уоллиса
|
Level of statistical significance / Уровень значимости
|
|
Avoidance / Избегание
|
90,77
|
48,15
|
69,25
|
59,44
|
27,187
|
0,000*
|
|
Anxiety / Беспокойство
|
88,11
|
44,51
|
44,59
|
87,62
|
35,069
|
0,000*
|
Note: * — p ≤ 0.05, there are statistically significant differences between the groups; the weight of answers in the table is gradiently color coded with white representing a low average score in the group and dark green indicating a very high average score in the group.
As can be seen from Table 4, all four groups have statistically significant differences in the characteristics of attachment to loved ones.
Table 5 / Таблица 5
Interpersonal relations questionnaire (average values by group and the Kruskal-Wallis test)
Опросник межличностных отношений
(средние значения по группам и критерий Краскела—Уоллиса)
|
Scales of the questionnaire / Шкалы опросника
|
Group 1 / Группа 1
|
Group 2 / Группа 2
|
Group 3 / Группа 3
|
Group 4 / Группа 4
|
Kruskal-Wallis test / Критерий Краскела—Уоллиса
|
Level of statistical significance / Уровень значимости
|
|
Expressed behaviour in the area of “inclusion” / Выраженное поведение в области «включения»
|
73,07
|
83,74
|
56,81
|
68,56
|
5,199
|
0,158
|
|
Required behaviour in the area of “inclusion” / Требуемое поведение в области «включения»
|
72,99
|
83,37
|
58,72
|
68,06
|
4,563
|
0,207
|
|
Expressed behaviour in the area of “control” / Выраженное поведение в области «контроля»
|
73,79
|
82,74
|
56,19
|
68,32
|
5,078
|
0,166
|
|
Required behaviour in the area of “control” / Требуемое поведение в области «контроля»
|
73,79
|
82,74
|
56,19
|
68,32
|
5,078
|
0,166
|
|
Expressed behaviour in the area of “affect” / Выраженное поведение в области «аффекта»
|
75,09
|
80,81
|
61,44
|
63,92
|
4,693
|
0,196
|
|
Required behaviour in the area of “affect” / Требуемое поведение в области «аффекта»
|
66,65
|
83,87
|
68,63
|
78,8
|
5,790
|
0,122
|
Note: the weight of answers in the table is gradiently color coded with white representing a low average score in the group and dark green indicating a very high average score in the group.
According to the study, no differences were found between the groups on the interpersonal relations questionnaire. This may indicate that this topic is significant for all respondents, regardless of their adaptability profile.
As can be seen from Table 6, statistically significant differences were revealed between the indicators of time perspective on the scales of “negative past”, “future”, “positive past”, “fatalistic present”. The absence of differences on the scale of “hedonistic present” shows that all survey participants evaluate their situation in the present in the same way. This may indicate that in all groups, respondents feel their “separation” from the past and future and do not think about the consequences and are guided by the sensations of “here and now”.
As can be seen from Table 7, the analysis did not reveal any statistically significant differences between the groups on any of the scales of the uncertainty tolerance questionnaire.
Table 6 / Таблица 6
Time perspective inventory method (average values by group and the Kruskal-Wallis test)
Опросник временной перспективы
(средние значения по группам и критерий Краскела—Уоллиса)
|
Scales of the questionnaire / Шкалы опросника
|
Group 1 / Группа 1
|
Group 2 / Группа 2
|
Group 3 / Группа 3
|
Group 4 / Группа 4
|
Kruskal-Wallis test / Критерий Краскела—Уоллиса
|
Level of statistical significance / Уровень значимости
|
|
Negative past / Негативное прошлое
|
86,4
|
48
|
63
|
75,88
|
20,270
|
0,000*
|
|
Hedonistic present / Гедонистическое настоящее
|
68,51
|
79,66
|
67,47
|
80,04
|
2,641
|
0,450
|
|
Future / Будущее
|
61,37
|
97,6
|
68,16
|
75,2
|
17,369
|
0,001*
|
|
Positive past / Позитивное прошлое
|
60,12
|
90,62
|
73,28
|
84,92
|
14,643
|
0,002*
|
|
Fatalistic present / Фаталистическое настоящее
|
81,82
|
57,1
|
61,94
|
77
|
9,353
|
0,025*
|
Note: * — p ≤ 0.05, there are statistically significant differences between the groups; the weight of answers in the table is gradiently color coded with white representing a low average score in the group and dark green indicating a very high average score in the group.
Table 7 / Таблица 7
The level of tolerance of the respondents to uncertainty questionnaire
(average values by group and the Kruskal-Wallis test)
Опросник толерантности к неопределенности
(средние значения по группам и критерий Краскела—Уоллиса)
|
Scales of the questionnaire / Шкалы опросника
|
Group 1 / Группа 1
|
Group 2 / Группа 2
|
Group 3 / Группа 3
|
Group 4 / Группа 4
|
Kruskal-Wallis test / Критерий Краскела—Уоллиса
|
Level of statistical significance / Уровень значимости
|
|
Intolerance to uncertainty / Интолерантность к неопределенности
|
74,62
|
72,79
|
69,59
|
70,92
|
0,273
|
0,965
|
|
Novelty / Новизна
|
69,2
|
78,78
|
68,31
|
78,78
|
1,913
|
0,591
|
|
Complexity / Сложность
|
81,34
|
64,93
|
67,94
|
63,88
|
5,457
|
0,141
|
|
Unsolvability / Неразрешимость
|
66,14
|
86,34
|
73,63
|
73,66
|
5,424
|
0,143
|
Note: the weight of answers in the table is gradiently color coded with white representing a low average score in the group and dark green indicating a very high average score in the group.
Table 8 / Таблица 8
The factors influencing the level of aspirations questionnaire
(average values by group and the Kruskal-Wallis test)
Опросник оценки уровня притязаний
(средние значения по группам и критерий Краскела—Уоллиса)
|
Scales of the questionnaire /
Шкалы опросника
|
Group 1 / Группа 1
|
Group 2 / Группа 2
|
Group 3 / Группа 3
|
Group 4 / Группа 4
|
Kruskal-Wallis test / Критерий Краскела—Уоллиса
|
Level of statistical significance / Уровень значимости
|
|
Internal motive / Внутренний мотив
|
61,49
|
92,54
|
74,66
|
77,6
|
13,135
|
0,004*
|
|
Cognitive motive / Познавательный мотив
|
59,31
|
95,43
|
61,19
|
88,4
|
22,039
|
0,000*
|
|
Avoidance motive / Мотив избегания
|
78,04
|
57,56
|
87,22
|
70,78
|
7,578
|
0,056
|
|
Competitive motive / Состязательный мотив
|
71,29
|
75,79
|
75,44
|
72,44
|
0,328
|
0,955
|
|
Motive for change of activity / Мотив смены деятельности
|
78,22
|
66,56
|
63,47
|
73,24
|
2,733
|
0,435
|
|
Self-esteem motive / Мотив самоуважения
|
65,43
|
85,91
|
66,91
|
80,54
|
6,714
|
0,082
|
|
Result significance / Значимость результатов
|
83,06
|
53,5
|
75
|
70,06
|
11,622
|
0,009*
|
|
Task complexity / Сложность задания
|
83,74
|
55,65
|
66,56
|
70,64
|
10,974
|
0,012*
|
|
Volitional effort / Волевое усилие
|
67,61
|
81,4
|
63,81
|
82,56
|
4,642
|
0,200
|
|
Assessment of the level of achieved results / Оценка уровня достигнутых результатов
|
58,64
|
100,44
|
72,72
|
76,06
|
23,592
|
0,000*
|
|
Assessment of one’s potential / Оценка своего потенциала
|
56,61
|
107,65
|
66,63
|
75,86
|
34,603
|
0,000*
|
|
Targeted level of mobilization of efforts / Намеченный уровень мобилизации усилий
|
59,74
|
96,99
|
69,5
|
79,74
|
19,019
|
0,000*
|
|
Expected level of results / Ожидаемый уровень результатов
|
69,63
|
91,69
|
62,72
|
63,6
|
9,715
|
0,021*
|
|
Pattern of results / Закономерность результатов
|
59,73
|
92,72
|
67,34
|
86,96
|
17,864
|
0,000*
|
|
Initiative / Инициативность
|
53,15
|
108,32
|
73,34
|
80,32
|
41,061
|
0,000*
|
|
Self-esteem / Самоуважение
|
65,43
|
85,91
|
66,91
|
80,54
|
6,714
|
0,082
|
Note: * — p ≤ 0.05, there are statistically significant differences between the groups; the weight of answers in the table is gradiently color coded with white representing a low average score in the group and dark green indicating a very high average score in the group.
Table 9 / Таблица 9
Self-concept clarity scale questionnaire (average values by group and the Kruskal-Wallis test)
Опросник «Ясность Я-концепции»
(средние значения по группам и критерий Краскела—Уоллиса)
|
Scales of the questionnaire / Шкалы опросника
|
Group 1 / Группа 1
|
Group 2 / Группа 2
|
Group 3 / Группа 3
|
Group 4 / Группа 4
|
Kruskal-Wallis test / Критерий Краскела—Уоллиса
|
Level of statistical significance / Уровень значимости
|
|
Self-concept clarity scale / Ясность Я-концепции
|
83,16
|
47,53
|
60,59
|
87,14
|
20,892
|
0,000*
|
Note: * — p ≤ 0.05, there are statistically significant differences between the groups; the weight of answers in the table is gradiently color coded with white representing a low average score in the group and dark green indicating a very high average score in the group.
The analysis showed the presence of statistically significant differences between the groups on the scales of “internal motive”, “cognitive motive”, “result significance”, “task complexity”, “assessment of the level of achieved results”, “assessment of one’s potential”, “Targeted level of efforts implementation”, “expected level of results”, “pattern of results”, “initiative”.
As can be seen from Table 9, the indicators of self-concept clarity differ between the groups of respondents. It should be noted that in this questionnaire, high scores correspond to low self-concept clarity.
Table 10 / Таблица 10
Psychological well-being scale (average values by group and the Kruskal-Wallis test)
Опросник «Шкала психологического благополучия»
(средние значения по группам и критерий Краскела—Уоллиса)
|
Scales of the questionnaire / Шкалы опросника
|
Group 1 / Группа 1
|
Group 2 / Группа 2
|
Group 3 / Группа 3
|
Group 4 / Группа 4
|
Kruskal-Wallis test / Критерий Краскела—Уоллиса
|
Level of statistical significance / Уровень значимости
|
|
Positive relationships / Позитивные отношения
|
55,83
|
110,28
|
79,59
|
66,16
|
39,630
|
0,000*
|
|
Autonomy / Автономия
|
50,09
|
103,26
|
96,25
|
81,12
|
44,432
|
0,000*
|
|
Personal environment
management / Управление средой
|
53,54
|
114,59
|
74,59
|
69,92
|
48,710
|
0,000*
|
|
Personal growth / Личностный рост
|
56,97
|
107,41
|
81,59
|
65,58
|
34,549
|
0,000*
|
|
Goals in life / Цели в жизни
|
54,59
|
106,65
|
80,88
|
73,74
|
35,900
|
0,000*
|
|
Self-acceptance / Самопринятие
|
53,17
|
117,22
|
76,94
|
65,86
|
54,258
|
0,000*
|
|
Psychological well-being / Психологическое благополучие
|
50,91
|
114,81
|
83,81
|
71,08
|
54,187
|
0,000*
|
|
Balance of affect / Баланс аффекта
|
92,65
|
28,03
|
64,25
|
84,74
|
56,992
|
0,000*
|
|
Understanding of the meaning of life / Осмысленность жизни
|
54,39
|
110,19
|
70,59
|
76,08
|
40,636
|
0,000*
|
|
Individual as an open system / Человек как открытая система
|
57,27
|
101,76
|
78,72
|
74,26
|
26,120
|
0,000*
|
Note: * — p ≤ 0.05, there are statistically significant differences between the groups; the weight of answers in the table is gradiently color coded with white representing a low average score in the group and dark green indicating a very high average score in the group.
The analysis revealed the presence of statistically significant differences between the groups on all scales of the questionnaire studying the psychological well-being of respondents.
In order to more thoroughly and clearly reveal the differences in the structure of the components influencing the socio-psychological adaptation of women who married foreigners and to identify the factors influencing its success, a correlation study was conducted. For this purpose, within each of the groups, using the non-parametric Spearman test, the relationships between the scales of the applied methods were identified. The average values for the scales of the questionnaires used within each of the groups were used as data.
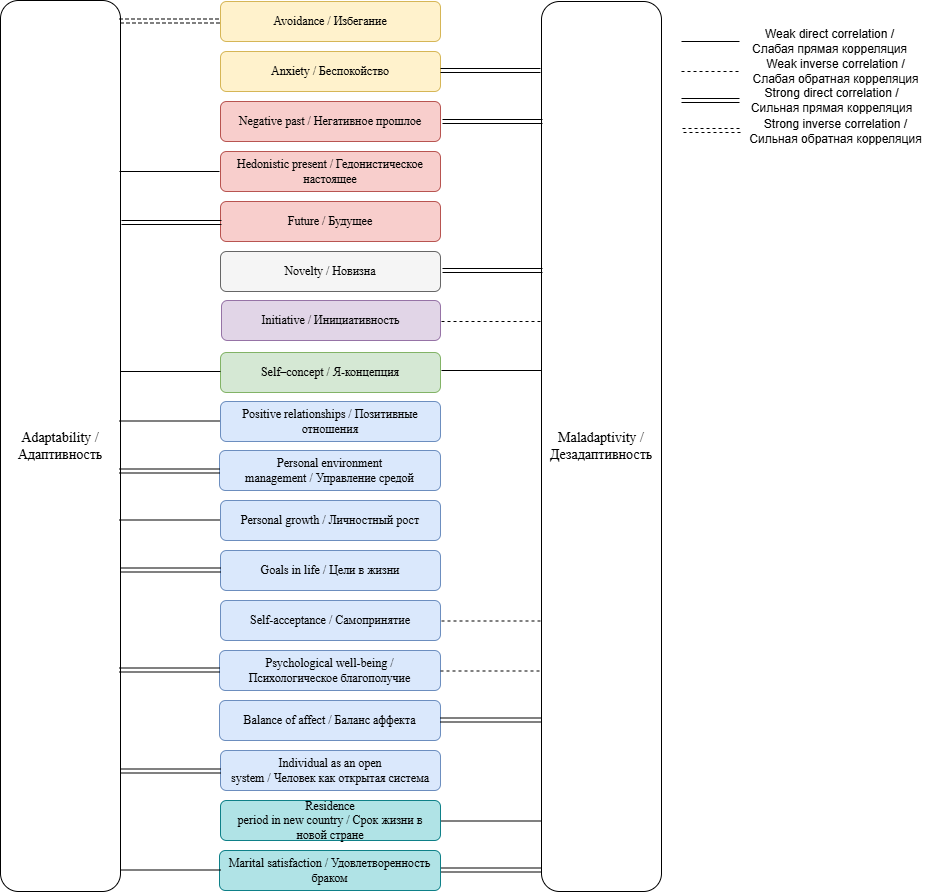
Adaptability and maladaptation profiles were identified for each of the groups. The results of the analysis are clearly presented in the form of correlation pleiades in Figs. 1–4.
Fig. 1. Group 1 adaptation profile
Рис. 1. Профиль адаптации группы 1
In the profile of this group, there are equally present connections between the scales of the questionnaire and the indicators of both adaptation and maladaptation.
As can be seen from Fig. 1, the correlations for adaptability and maladaptation in the group differ. Adaptability is interconnected (strong direct connection) with such indicators as “future”, “personal environment management”, “goals in life”, “psychological well-being” and “individual as an open system”, (strong feedback) “avoidance”, (weak direct connection) “hedonistic present”, “self-concept”, “positive relationships”, “personal growth”, “marital satisfaction”. The following indicators are associated with maladaptation: a strong direct connection is demonstrated by the scales “negative past”, “novelty”, “balance of affect”, “marital satisfaction”, a weak direct connection is demonstrated by the scales “anxiety”, “self-concept”, “residence period in a new country”, a weak negative connection — “initiative”, “self-acceptance”, “psychological well-being”.
It should be noted that the indicators “self-concept” and “marital satisfaction” demonstrate a direct connection with both adaptability and maladaptation in the sample. It can be assumed that, due to the fact that these parameters have a complex structure, their various components will interact differently with the parameters of adaptability.
Thus, in this group, during psychological support, it will not be enough to work with clarifying the self-concept or pay attention to working with relationships in a couple without additionally studying the characteristics of representatives of this profile.
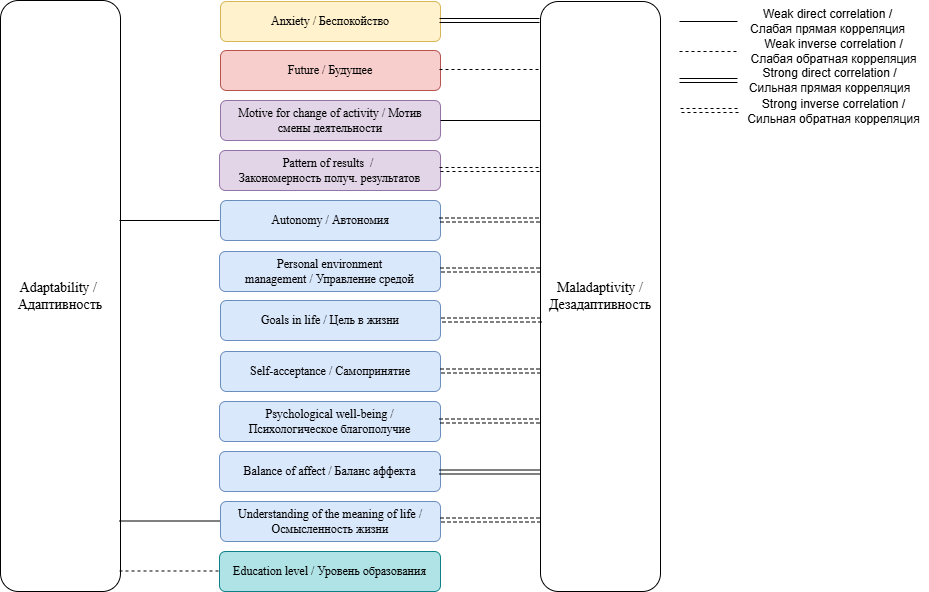
Fig. 2. Group 2 adaptation profile
Рис. 2. Профиль адаптации группы 2
As the correlation constellation clearly shows, the profile of this group mainly shows the presence of correlations of questionnaire scales with maladaptation.
The analysis revealed the presence of a weak direct connection between adaptability and the indicators of "autonomy" and "understanding of the meaning of life", as well as a weak feedback with the level of education.
As for maladaptation, a strong direct connection with the scale of “anxiety”, strong feedback with the scales of “pattern of result”, “autonomy”, “personal environment management”, “goals in life”, “self-acceptance”, “psychological well-being”, “understanding of meaning of life”, a weak direct connection with the “motive for change of activity” and a weak feedback with the “future” was revealed.
In this group, unlike the previous one, the scales that showed a correlation with both adaptability and maladaptation are linear. That is, with a decrease in maladaptation, maladaptation will proportionally increase.
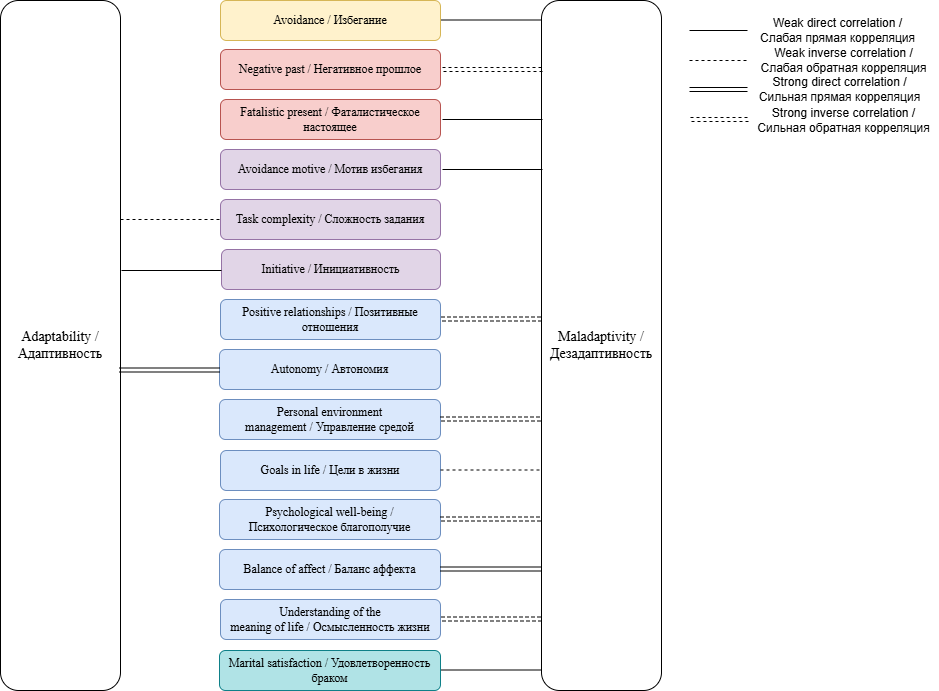
Fig. 3. Group 3 adaptation profile
Рис. 3. Профиль адаптации группы 3
This group also demonstrates more connections with maladaptation.
According to the analysis, such indicators as “autonomy” (direct strong connection), “initiative” (direct weak connection), “task complexity” (inverse weak connection) correlate with adaptability.
The level of maladaptation demonstrates the presence of strong direct connections with the scale “affect balance”, strong inverse connections with the indicators “negative past”, “positive relationships”, “environmental management”, “psychological well-being”, “meaning of life”, weak direct connections with “avoidance”, “fatalistic present”, “avoidance motive” and “satisfaction with marriage”, as well as a weak negative connection with the parameter “goals in life”.
It is interesting that in this group, none of the scales showed correlations with either adaptability or maladaptation.
Fig. 4. Group 4 adaptation profile
Рис. 4. Профиль адаптации группы 4
The profile of this group, as well as group 1, also contains links with both adaptation and maladaptation indicators.
Adaptability demonstrates the presence of a strong direct link with the “initiative” indicators, direct weak links with the scales “volitional effort”, “assessment of one's potential”, “intended level of implementation of efforts”, “autonomy”, weak feedback links with “avoidance” and “presence of children”.
As for maladaptation, strong negative links were found with the parameters “volitional effort”, “assessment of one's potential”, “environmental management”, “goals in life”, “self-acceptance”, “psychological well-being”, “meaning of life”, and a weak positive link with “affect balance”.
As in the second group, the correlations showed a linear dependence of the scales that correlate with both adaptability and maladaptation.
Discussion
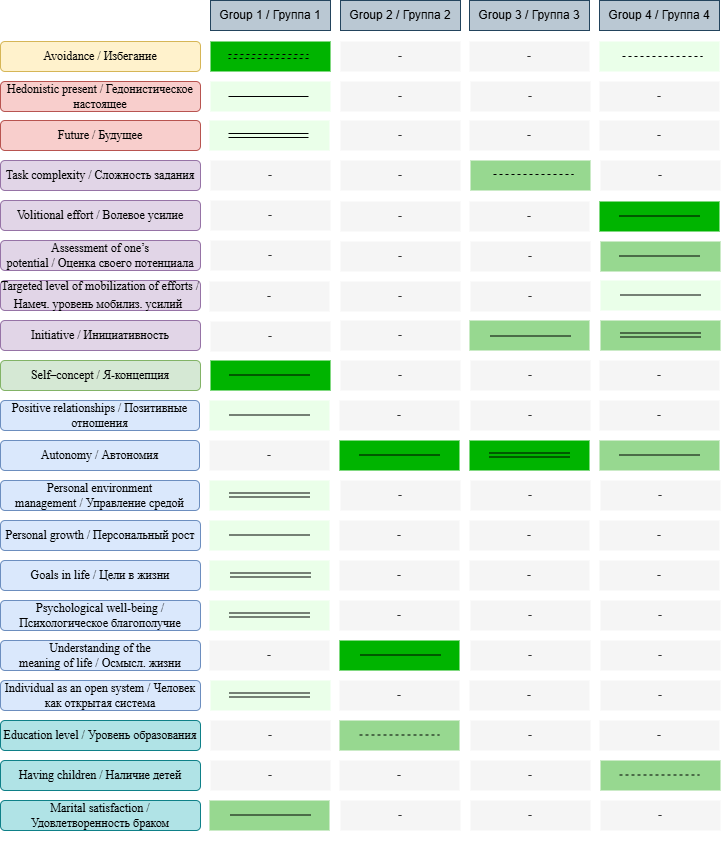
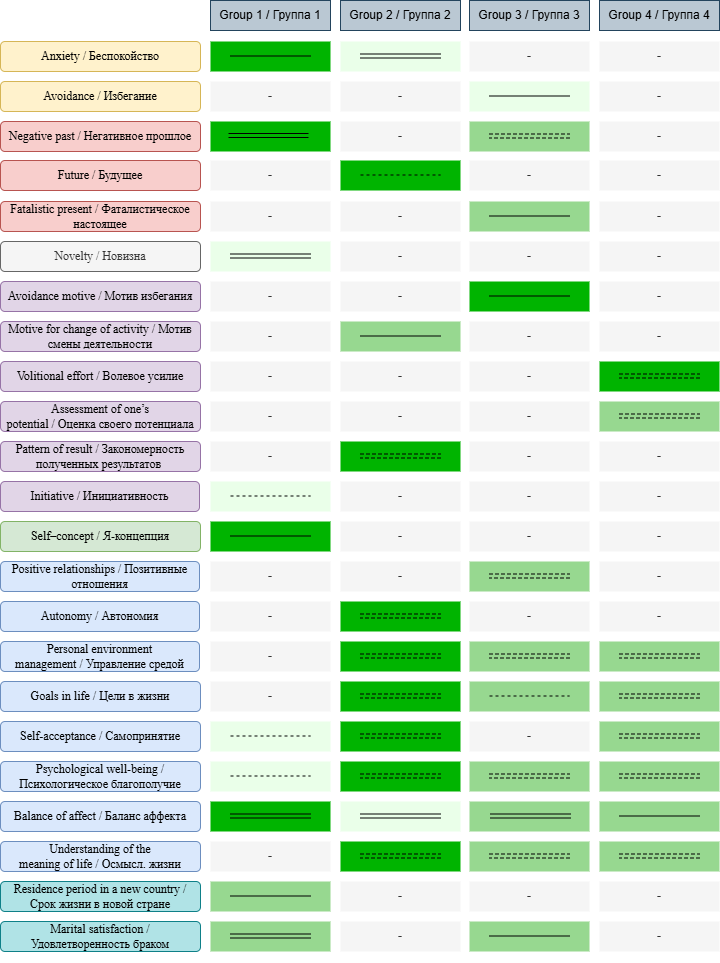
To facilitate analysis of the obtained data, the results are presented in Figs. 5 and 6, combining all stages of the conducted research, the correlations are presented and the level of average values of the questionnaire scales for each of the groups is marked in color. The resulting summary tables help to see the differences in the structure of adaptability and maladaptation of groups. The text first presents the summary data itself, and then the results will be interpreted.
To clarify the assumptions associated with the analysis of the obtained data, semi-structured interviews were conducted with representatives of each of the groups who took part in the main study and agreed to answer additional questions after processing the results.
Before moving on to describing specific types and especially using quotes from interviews with the study participants, it is important to emphasize that none of these types are good or bad, right or wrong. Behind each of these profiles is the real life of each woman, her personal experience, her life path.
Each of the types shows those important aspects of human existence that can be seen through the prism of migration and serve as an impetus for reflection not only on what happened retrospectively to women who moved to a new country due to marriage (the answer to the question “why did this happen?”) but also prognostic reflections on which tasks are being solved at the current stage of life, which life difficulties set the psyche in motion (the answer to the question “where does this lead a person in his development?”).
As the comparison of the characteristics related to adaptability in different profiles shows, the nature of low or high adaptation in the given profiles varies significantly between the groups. It can be said that representatives of different types (especially Group 1 and Group 2) “live in different worlds”.
Adaptability in Group 1 has the most unique correlations with the indicators of both understanding of time perspective and psychological well-being scales, the highest values of the level of avoidance and anxiety, and low values of experiencing a negative past and future, as well as the absence of correlations with the autonomy scale in the only one of the studied groups.
The maladaptation of this group is associated with a high level of anxiety, a high level of negative representation of the past (which, in turn, is associated with impulsivity and depression), a low level of tolerance for novelty, a low level of clarity of the self-concept, a high emotional assessment of oneself and one's ability to maintain relationships with others, along with disappointment in behavior in one's own past.
In the interview, representatives of this group draw attention to two turning points that influenced adaptation in a new country. The first is the birth of children and the need to solve problems associated with them – that is, the need to leave the comfort zone to solve problems: "Once they forgot to give me an interpreter for an appointment with a doctor, and I had to explain the medical history of my family and myself using my fingers, pantomime and drawings. We had a great time, laughed a lot and eventually wrote down everything that was needed. Since then, my English has significantly improved and has begun to be used actively. However, Australia is a country of migrants, and here they are calm about accents and speech errors."
Fig. 5. Comparison of adaptability characteristics in profiles
Рис. 5. Сравнение характеристик адаптивности в профилях
Fig. 6. Comparison of maladaptation indicators in profiles
Рис. 6. Сравнение характеристик адаптивности в профилях
Another important situation is the description of a conflict with a representative of the diaspora who was arguing with the interviewee: “This really helped me to get rid of my dependence on other people’s opinions.”
As for the issues of ethnic identity, the perception is based on the opposition and the sense of oneself through the concepts of “friend or foe”: “Everything changed after a trip to Russia. I realized how much I had changed, the country and the people in it had changed. I was already a stranger there. Things that I had not even noticed before had become an eyesore. Everyday rudeness everywhere, the lack of personal boundaries, the habit of always defending "friends" had unexpectedly alienated me.”
It seems that the representatives of this group are focused on their experiences in a situation of frustration, which challenges their self-concept and time perspective. Thus, life looks like a series of challenges and iterations between an individual and society, within the framework of which certain decisions are made.
In group 2, as the results show, there is a noticeable connection between adaptability and the search for the meaning of life. Representatives of this group demonstrate a high level of autonomy. Correlations with indicators of understanding of life and level of education indicate that these women are looking for answers to internal questions related to the value sphere of the individual.
The maladaptation of the second group is associated with a low level of anxiety, an average level of motive for changing activities, a low level of emotional perception of oneself in interaction with others, and is inversely associated with a low level of impulsivity and conscientiousness, the significance of the result obtained, and high indicators of meaningfulness of life and life values.
Describing her experience of adapting to a new country, a representative of this group rather philosophically reflects on the fact that the same problems are everywhere, the main thing is who and in what company solves them: “The main thing is not to forget to switch languages. I am included in life in Russia and in life in Greece. It feels like the same people, they just speak a different language. The problems are the same – prices are rising, how to build relationships with children. Like everywhere, issues of fathers and children. Perhaps, if I had ended up in a different family, things could have been different. But my husband and I are close in our way of life, in our values.”
As for motivation for development, it is more connected with internal needs, and not with external tasks or conflicts: “The past is forgotten, the future is closed, the present is given. I am happy with my life. Now I have managed to do many things that I could not do before. For example, I started drawing. I got a new profession. Maybe I gained some wisdom, I stopped racking my nerves on what used to worry me. Now I like it more than before. And how it will be – we'll see.”
The resulting profile does indeed correlate with a low level of maladaptation, since the focus of attention of women from this group is not on external frustration, but on solving other problems. At the same time, there is a feeling that there are no differences in the identity of the old and new countries, and frustration is perceived as a natural part of life.
An interesting feature of the story of the representative of this group was the absence of the idea of the path forward. Life in this way is more like contemplation of the inner world than as a reflection of the outer world.
Group 3. The adaptability of group 3 is built around motivation for action. This conclusion is due to the fact that this group has correlations with such a scale of the motivational profile as task complexity, there is a direct strong connection with autonomy (while this scale demonstrates very high values), and there is also a correlation with initiative.
The indicators of the third group show the presence of internal and external complexity in the structure of both adaptability and maladaptation. Low levels of avoidance, a balanced time perspective, and indicators of psychological well-being indicate this. As for the motivational sphere, maladaptation in this group is associated only with a high level of the avoidance motive.
These assumptions are confirmed by the respondent’s answers. They contain many ideas about achieving goals regardless of what others think: “Challenging tasks motivate me. I am so happy, I like it so much. I had plans to achieve this by 30, and that by 40. I was also told that I was winding myself up, that I needed to relax and wait. But I approach life from the position that “Nothing ventured, nothing gained”. I saw this as a devaluation of my experiences. I wanted to be someone myself. Although the Spaniards asked me why I didn’t go to work as a waitress. Wait, what? I studied for 5 years!”
To achieve the set goals, the woman went to study, visited a psychoanalyst, and sought support from loved ones.
A representative of this group describes the feeling of her identity in the context of development: “Initially there was a question – am I not like them? Then joy – and thank God I am not like them. Then came the understanding that they are like this, and I am like this.”
We can say that this group demonstrates a clearly expressed idea of development, changes in accordance with a precisely formulated image of the future and the search for solutions that contribute to the achievement of the set goals.
As for group 4, adaptability is associated with such characteristics as will, planning, reliance on one's own decisions, low levels of avoidance, and the fact that this is the only group for which having children is significant. Perhaps solving external problems is an important driver of adaptability for this group.
As for the maladaptation of the fourth group, it, being in the same range as the maladaptation of the first group, looks simpler and more linear in its structure. That is, low values of characteristics that promote adaptation (will and rationality) are associated with maladaptation. This is confirmed by the answers to questions related to the experience of adaptation. “My adaptation went well. The main thing is to understand what you are getting into and choose the right person.”
The responses of the representative of group 4 were very specific and were mainly related to the fact that since she found herself in a new country, she had to arrange her life there and solve everyday problems: “It was hard, but that was to be expected. I had to learn a new language, look for a job.” As for ideas about ethnic identity, they were also formulated clearly and specifically: “If I am Russian, then I will never become Swedish, it is impossible. I feel like a Russian who lives in Sweden, I am used to the local lifestyle.”
In the responses here, as in group 2, the theme of conflict is also absent. But here we can see an idea of development, which is more related to the use of willpower and readiness to take clear steps to achieve logical goals, such as learning the language of the new country, finding a job and generating income and solving everyday problems.
In the model of successful social and psychological adaptation of women who married foreigners, based on theoretical research, the idea was formulated that the obtained types of adaptation could be correlated with the above-mentioned typology of J. Berry (Mironova, Ruonala, 2024).
However, while analyzing the results obtained, an idea arose to expand the understanding of migration by correlating the obtained data with the concept of lifeworlds by F.E. Vasilyuk (Vasilyuk, 2025;
Vasilyuk, Karyagina, 2017;
Karyagina, 2019). It is interesting that until the idea of this typology appeared, the correlation of the obtained results and the initially declared typology of migration by Berry was not obvious.
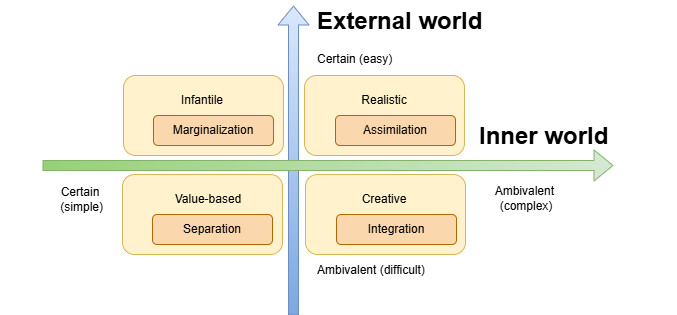
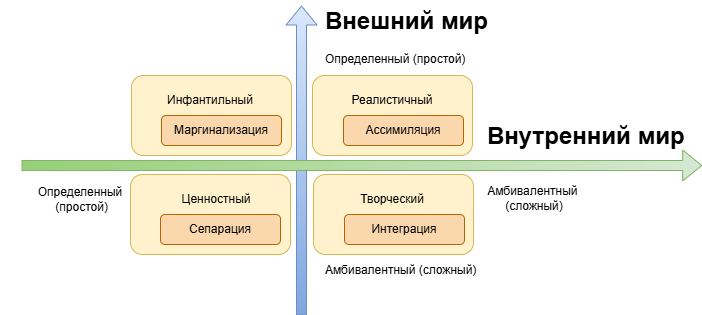
Vasilyuk's typology is based on the individual's idea of the external and internal world, which can be complex or simple. Thus, there are 4 types of internal worlds — infantile (simple internal and external world), rational (simple internal and complex external), value (simple external and complex internal), and creative (complex external and complex internal).
This typology contains the idea of development, the driving force of which is the specific concept of “perezhivanie”, which cannot be fully translated from Russian into English. The meaning is most closely related to "experience", but then the nuances associated with the amplitude of the experience, its complexity and direction will be lost (Vasilyuk, 2025; Vasilyuk, 1992).
As F.E. Vasilyuk himself wrote, “perezhivanie becomes the person’s leading activity ... which occupies a dominating position in the life of a person and through which his personal development is carried out” (Vasilyuk, 1992). Without a doubt, the perezhivanie associated with the process of integration in a new country becomes an important addition to understanding what happens to a person experiencing a move.
It makes sense to consider the classification of J. Berry as a special case of the concept of lifeworlds, where the host society becomes part of the external world, and ethnic identity – of the internal world, and the migration path itself as a crisis situation, which can ultimately become a driving force for the development of human potential and become an impetus for self-actualization. In addition, the application of the concept of F.E. Vasilyuk adds to the understanding of migration the idea of transfiguration, which transfers the linear theory of the development of migration stages from non-classical to post-non-classical scientific rationality (
Karyagina, 2019).
The correlation between these two typologies is shown in Fig. 7.
Fig. 7. Correspondence of the typology of lifeworlds by F. Vasilyuk
and the types of adaptation by J. Berry
Рис. 7. Соотнесение типологий жизненных миров Ф.Е. Василюка
и типов адаптации Дж. Берри
Due to the specificity of the sample, J. Barry could consider the manifestations of the impact of moving on a person, taking into account extreme cases that are unlikely to happen in a situation of "successful" migration. In rare cases, a woman who moved due to marriage will lead a marginal lifestyle, will end up in social housing, or will need to use food banks. The external world itself in the case of marital migration looks more accepting. But it is possible that the experiences of a woman who is within the so-called infantile position may be fundamentally the same depression that can affect a person whom Barry classifies as a marginalized group.
It should be noted that the typologies "infantilism" or "marginalization" may sound offensive to the members of the group so denoted. This also happens to be the most numerous group. Perhaps, to describe our social group, it makes sense to choose another concept that reveals the specificity of the tasks at this stage. Perhaps, at the basis of this group of symptoms lies some confusion or loss, which forces a person to react to undifferentiated frustrating situations. However, at this stage of the work it is reasonable to use those names that were proposed by F.E. Vasilyuk and J. Berry.
Drawing analogies between the characteristics of the studied groups and the proposed typologies, it is easy to draw a conclusion about their relationship. The data are presented in Table 11.
The obtained data opens significant prospects for further research into the complexity and comprehensiveness of the phenomenon of migrant adaptation, as well as for clarifying the content of the types of socio-psychological adaptation of women who have married foreigners.
First, since the groups under study are different in size, which is a limitation of the current work, it is necessary to conduct further research and, at the first stage, equalize the number of participants in each of the groups. An interesting focus for studying this problem may be the use of mixed research designs, including grounded theory, in order to clarify similar and different parameters that affect adaptability and maladaptation.
Secondly, a deep and detailed correlation of the concept of Vasilyuk and J. Barry can largely reveal the processes that influence what type of patterns a person will gravitate to. The solution to this issue has prognostic and diagnostic significance.
Table 11 / Таблица 11
Correspondence between the groups obtained and typologies of F.E. Vasilyuk and J. Berry
Соответствие полученных групп типологиям Ф.Е. Василюка и Дж. Берри
| |
Typology of lifewords by F.E. Vasilyuk / Типология жизненных миров Ф.Е. Василюка
|
Typology of migration by J. Berry / Типология миграции Дж. Берри
|
|
Group 1 / Группа 1
|
Infantile / Инфантильный
|
Marginalization / Маргинализация
|
|
Group 2 / Группа 2
|
Value-based / Ценностный
|
Separation / Сепарация
|
|
Group 3 / Группа 3
|
Creative / Творческий
|
Integration / Интеграция
|
|
Group 4 / Группа 4
|
Rational / Рациональный
|
Assimilation / Ассимиляция
|
Thirdly, as we see from the obtained results of the analysis, the scales of the Rogers-Diamond questionnaire when applied to the studied group tend to shift. Apparently, the indicators of integration are associated with optimal adaptability and low maladaptation. However, this issue should also be resolved separately.
Another important observation is the importance of studying the problems that increase the maladaptation of migrants. At the same time, this characteristic is more universal for all groups. Work with migrants should be carried out consistently, first working through the issues of maladaptation, and then – adaptability. Here we can recall and rework the words of L. Tolstoy: “All unhappy migrants are unhappy in the same way, each happy migrant is happy in his own way.”
Conclusions
The problem of studying the psychological characteristics of the success of social and psychological adaptation remains relevant. As the current study has shown, there are still more questions about the nature of the phenomenon of adaptation than answers.
Even though the existing typology of migration classifies marital migration as a separate type, as we see, this group is not monolithic. Despite the absence of statistically significant differences between the groups, within which the differences in the migrants' experience of the adaptation process are mainly explained, new grounds for theoretical understanding of the specificity of the group, the logic of its development and driving force are revealed.
As the research obtained shows, an important lens through which to study the process of migrant integration into the host society can be the concept of “perezhivanie” by F.E. Vasilyuk. Thus, experience acts as a driving force for the development of adaptability and can ultimately lead to integration into the host society. This clarification can significantly expand the ideas of psychologists about the philosophical and methodological foundations of work in accompanying migration.
The results of the conducted research allowed us to identify four types of social and psychological adaptation of women married to foreigners. The obtained types can correspond to both the typology of lifeworlds by F.E. Vasilyuk and the typology of migrants by J. Barry: infantile (marginalization), rational (assimilation), value (separation) and creative (integration). At the same time, the typology of migrants can act as a special case of the typology of lifeworlds.