INTRODUCTION
Suicidal thoughts, attempts, suicides, suicidality, and other related self-harm behavior represent complex biopsychosocial phenomena, but the key point is that, despite the fluctuating rates of deaths due to suicides across the world, and the variety of correlations to different etiologies and clinical states, they are preventable phenomena [1]. The WHO has published its “Practice manual for establishing and maintaining surveillance systems for suicide attempts and self-harm” and invited national healthcare systems to focus on monitoring suicidality among vulnerable population groups (1). The Russian Federation adapted the WHO’s self-harm monitoring tool and joined the suicide prevention program in the mid-2020s [2].
Known risk factors for suicide include a history of attempted suicide, psychiatric disorders, current suicidal thoughts, and a range of social factors including income level, life stressors, illness, family relationships, social isolation, etc. [3]. However, the presence of these risk factors is statistically associated with suicide attempts in only 10% of cases [3]; nevertheless, the identification of risk factors remains an important task for suicide prevention.
A large number of known risk factors have been present during the COVID-19 pandemic, as there are many reports that it is associated with high level of distress, increased anxiety, and increased rates of clinical depression brought by the threat to life, the associated social restriction measures, and crucial life changes [4–9]. A systematic review of the impact of the COVID-19 pandemic on self-harm and suicidal behavior demonstrated that, despite the fact that number of deaths due to suicides did not change or indeed even decreased in the early months of the pandemic, there was evidence of an increase in suicides in hospitals, and a rise of suicidal ideation among COVID-19 patients, whilst at the same time suicide rates varied across different studies, and the relationship between suicide and economic problems was the only statistically significant finding in the majority of studies [10]. Beyond the deaths due to suicides, a recent meta-analysis of 54 studies found increase in suicidal ideation in a community sample with 11.84% for suicidal ideation, 2.68% for suicides, and 6.11% for self-harm [11]. The authors of this research noted that these rates were nearly twice as great as in the most recent prepandemic meta-analysis of 93 studies [12]. The differences in the rates of suicidal behavior may not only be due to an increased rate of post-COVID anxiety, depression, neurocognitive disturbances, and other neuropsychiatric manifestations evoked by the neurotropic nature of SARS-Cov-2 but also due to “psychodemic” issues — a specific epidemic of mental and neuropsychiatric disorders as caused by the stress of the pandemic [4, 13–17]. Previous studies demonstrated that the stress of chronic social isolation (e.g., quarantine) might lead to polar emotional and behavioral deviations such as depression with the freezing effect of decreased activity and stupor, and an aggression with attendant proactive destructive behaviors, excitement, and hostility [18]. Moreover, the factor of social isolation is strongly associated with suicidal behavior [19]. Apparently, in the context of pandemic conditions, lockdown measures, and the spread of infodemic, the sensitive population groups developed either autoaggressive behavior and suicidality, accumulating in the increased number of mental disturbances over this period, or heteroaggressive actions and protests, when individuals struggled against wearing masks, their rights regarding a choice of vaccination, and even sociopolitical issues, in particular, appealing to conspiracy beliefs about the artificial origins of the novel coronavirus, its purposes to provide a control over community, a pathway to arrange the economic crisis, etc. [14, 20–25]. These oppositional anti-mask and antivaccine attitudes might be also related to the hypoactive instinct of self-preservation which is also linked to some forms of autoagressive intention (“capability for suicide”) due to the lack of self-care, decreased healthy volition to stay safe, not to contract the virus, to prevent severe disease, or cause a death; thus, this behavior also might be explained within the context of self-harm and parasuicidal phenomena arising due to the current pandemic [26–29]. The increase in suicide rates and suicide-related phenomena within the “dual suicide and COVID-19 pandemic” have been observed across different countries, including Western representatives of the European Union and the eastern nations of South Asian countries, as well as, far from Eurasian epicenters in a distant and prosperous Australia [5, 8, 30–32].
Studies of suicidality risks in the Russian Federation are rare and have significant limitations due to addressing focus group populations or small sample sizes [33]. During prepandemic times, the suicide rate within the general population in Russia has been gradually decreasing over the last two decades (2000: 39.1 per 100,000; 2010: 23.4 per 100,000; 2020: 11.3 per 100,000) [34]. However, the number of suicides among the male population of Russia has always been higher than that for females, despite the reverse data on higher rates of suicidal attempts amongst women compared to men [33, 35, 36]. Higher suicide rates amongst men have been discussed in terms of cultural and other country-specific issues, including their links to the factors of unemployment, financial problems, excessive alcohol consumption among men, divorce, and the predominant protection of maternity and single mothers by law versus the lack of support for fatherhood [37–40]. Importantly, the last few decades (that is, long before the start of the pandemic) have seen younger people committing suicide and, indeed, a frightening rise in the rate of suicide amongst youths, particularly among teenagers, in Russia and has been interpreted according to a wide variety of factors, including social media propaganda containing suicidal content, advertisements, and active participation in suicide internet games, etc. [41–43].
Russia has also demonstrated a response to the stress of pandemic through mental health disturbances and behavioral changes among various vulnerable populations of people living with mental and somatic disorders, females, youth, healthcare professionals, the elderly, and others [4, 7, 44–48]. Nevertheless, the high levels of anxiety and depression in Russia amongst the general population have been less frequent than in some other Eastern Europe countries [49, 50].
Among the various studies focusing on the mental health of the general population during the COVID-19 pandemic, the majority of scientific reports have described significant links between suicidality and the stress of the pandemic, but only few observations have attempted to estimate the population’s suicidality risks and the mediating role of socio-demographic, economic, psychological, and clinical characteristics acting as protective versus risk factors for changes in suicidality in the context of the pandemic [5, 8, 21]. Data published from the COMET-G study demonstrated the international perspective on suicidality, whereas country-specific data profiles on suicidality risks have not been presented [8]. Understanding the dynamic of suicidality risks and suicidality rates and their connections with the risk factors in the context of the pandemic is a separate, and difficult, task for the international professional community. Better knowledge of risks of suicide can result in more close monitoring of the risk groups and the development of the targeted preventive measures.
The aims of this study were to estimate suicidality rates in the midst of the COVID-19 pandemic within the Russian population to evaluate the demographical, clinical, behavioral, and environmental factors associated with suicidality risks. The results obtained were projected onto the general population of the Russian Federation and regression models of suicidality risks were created.
METHODS
Data collection procedures
The data was collected within the multi-center cross-sectional study “COvid-19 and MEntal health in Ternational (COMET-G) study in General population” of 40 countries. The design of this study has been described in detail and published in the supplementary materials to the earlier publications [4, 51]. Data was obtained through an online self-report questionnaire that consisted of 120 items. Responses were collected anonymously via an online link with automatic recording of responses via Google Forms. The first page of the online questionnaire included the declaration of voluntarily consent for participation, so respondents could only proceed to the main questionnaire after indicating their consent. Study approval was granted by the Ethics Committee of the Faculty of Medicine, Aristotle University of Thessaloniki, Greece.
The link to the questionnaire was distributed via personal and professional contacts of investigators using messengers, social media groups, websites, and the mobile application Appbonus. The response registration period in Russia started on May 29th (first response) and lasted till December 16th, 020 through several waves of the questionnaire’s circulation based on regular reminders. As far as the majority of valid (complete and unique) responses (n=7714, 99%) were registered during the period from May 29th to August 21st 2020, we used this particular sample in order to restrict the effects of eventual external confounders and to provide the consistent data analysis. Thus, responses from those who were ≥18 years old and who sent a response between May 29th and August 21st, 2020, were included in the analysis.
Measurement tools
The online self-report questionnaire consisted of 120 items, including (i) socio-demographic characteristics of participants, (ii) the Risk Assessment Suicidality Scale (RASS) [52], State-Trait Anxiety Inventory (STAI, STAI-S subscale for the state of anxiety) [53], Center for Epidemiologic Studies Depression Scale (CES-D) [54], (iii) the items reflecting subjective feelings of the COVID-19 pandemic: related worries and fears, recent changes in anxiety, depression and suicidality over the period of pandemic, as well as (iv) a history of mental disorders, somatic disorders, attitudes towards recommended protective behavior against COVID-19 virus, and (v) personal beliefs about the pandemic’s origins, life habit changes like changes in physical activity, eating behavior, sleep and sex quality, deviations in social media, and substance use.
The Risk Assessment Suicidality Scale (RASS) has been developed as a self-report instrument with an emphasis on items describing suicide-related behavior itself [52]. This scale consists of 12 items rated on a four-point Likert scale with responses ranging from 0 to 3 (Not at all, A little bit, Much, Very much, respectively) and assess fear of death, intention regarding suicide, enjoyment gained from life, and a history of suicide attempts and self-harm behavior, with higher scores reflecting a greater tendency towards suicidality. According to the RASS scale developers’ recommendations, we have also applied an item-based standardization procedure by applying specific scores to each response to calculate the total suicidality risk score [52].
Depression was measured using CES-D with cut-off in the total CES-D score of >23, as proposed by Fountoulakis et al. for clinically relevant depression [55]; anxiety was measured using STAI, with a cut-off in the total STAI score of >39 for clinically relevant anxiety [56].
As has previously been described elsewhere [4], the questionnaire was translated into Russian and double checked by back translation into English by bilingual speakers.
Statistical analysis
To prepare database to the analysis, we reviewed and transformed (reversed scoring) all the ordinal and some dichotomic variables scores (B1, B2, B4, C1, C2, C3, C4, D1, D2, D3, D4, E1, E2, E3, E4, E5, E6, E7, F21, G21, H1, H2, H3, H4, I1, I2, I3, J1, J2, J3, J4, J5, J6, J7, K1, K2, K3, K4, K5, L1, L2, L3, L4, M1, M2, M3, M4, M5, M6, N1, N2, N3, N4, O11, O12, O13, Spiritual/Religiousness increase, see Supplementary 1 for the variables codes) to unify all the measurements in a consistent manner: higher values/levels correspond to a higher severity/risk.
First, to characterize the general study population we used descriptive statistics with continuous variables described as means and standard deviations (S.D.) and categorical variables as absolute and relative frequencies per category.
As a second step, we projected our survey data onto the entire adult (≥18 years old) population of Russia using population data registered by the Federal State Statistics Service on December 31st, 2020 [57]. We calculated a population distribution by set age groups (18–19, 20–24, 25–29, 30–34, 35–39, 40–44, 45–49, 50–54, 55–59, 60–64, 65–69, 70–74, 75–79, 80–84, >84 years), gender (male, female) and residence (urban, village) and made a raking weighting of our survey data by applying a weight to every case in terms of descriptive analysis of socio-demographic variables and total RASS scores. Also, insofar as the RASS scale has no clearly defined cut-offs, we analyzed total RASS score (both raw and standardized) distributions and D’Agostino Skewness against the normal distribution to determine normal scores’ cut-offs and the proportion of the population with abnormal scores.
Finally, to determine demographical, clinical, behavioral, and external factors associated with suicidality risks we processed standardized RASS scores using several regression models. The flow-chart for the regression analysis can be found in the supplementary materials (Figure S1). Insofar as most of variables were ordinal and could be treated either as categorical or continuous variables, we used them in two different types of regression analyses. The first approach was based on coding all the ordinal variables as of a continuous type in order to evaluate the linear relationships between them and the total RASS score, whilst the second analysis treated the ordinal variables as a categorical data type in order to determine specific responses that act as either risk or protective factors.
Prior to each regression analysis we screened for strongest predictors among the list of the three continuous (year of birth, STAI-S, and CES-D total scores) and 73 categorical/ordinal variables (items of the questionnaire — socio-demographical features (n=9), general health (n=3), COVID-19-related worries and fears (n=4), COVID-19 associated protective behavior (n=4), family relationships and stressors (n=7), recent changes in emotional state (n=2), physical activity changes (n=4), eating behavior changes (n=3), common misconceptions and misbeliefs (n=7), sleep quality (n=4), substances use history and patterns (n=4), sex (n=4), recent change in suicidal behavior (n=1), religiousness (n=1), depression and anxiety scores threshold (n=2), history of self-reported mental health disorder and psychiatric treatment (n=11); for the entire set of variables, see Supplementary 1). For this purpose, we used the Lasso regression method with a Max of 100 for the Lambda constant, 0.0001 Lambda ratio, 10.000 Max iterations with a 10-fold cross-validation to a Max of 30 variables to retain. This method was intended to perform a penalized estimation of the linear regression by applying the cycles of regularization in order to minimize the objective Lambda function and to determine a feasible set of explanatory variables based on a large set of variables by removing those variables with weak explanatory capacity and thus to enhance the prediction accuracy and interpretability.
Those variables that survived in the LASSO regression after minimal Lambda values were achieved were entered as either categorical or continuous predictors, respectively, into two General linear regression best subset models with R2 selected as a goodness criterion and the total standardized RASS score as the dependent variable. For the general regression model with the ordinal variables treated as categorical, an ANOVA with post-hoc Bonferroni correction for multiple comparisons was performed to calculate the total RASS score mean values (Mean) with 95% confidence intervals (CIs) across the categories and to evaluate the between-group comparisons.
All statistical procedures were estimated as significant at α=0.05. Statistical analysis was performed using TIBCO Statistica (TIBCO Software Inc., 2018; Statistica data analysis software system, version 13. http://tibco.com).
RESULTS
Socio-demographic and mental health characteristics of the study sample
Among overall 7777 valid cases from the Russian study sample of the COMET-G dataset (age ≥18 years old, complete cases), 7714 fulfilled the inclusion criteria for the analysis (Mean (SD) age: 32.98 (11.96), 60.77% (n=4688) females, 36.57% (n=2821) males, and 2.66% (n=205) of non-binary gender who preferred not to disclose this information. See socio-demographic (raw and weighted results) and general medical/mental health characteristics (raw results) of the study sample in Tables 1 and 2, respectively. Weights calculation results based on the raking analysis can be found in the Supplement (Table S1). The socio-demographical characteristics of the weighted study population are very close to those of the general population (Table S1) making it reasonable to project the study results onto the general population.
Table 1. Socio-demographic characteristics of the Russian study sample
|
Variables |
N=7714 |
Population ≥18 years data (N=116 082 939 on December 31st, 2020) |
Weighted study data (N=117 107 057) |
|
Age, Mean (SD) |
32.975 (11.96) |
47.273 (17.710) |
|
|
Gender, n (%) |
|||
|
Female |
4688 (60.77%) |
63 686 983 (54.86%) |
65 251 223 (55.46%) |
|
Male |
2821 (36.57%) |
52 395 956 (45.14%) |
52 395 956 (44.54%) |
|
Other |
205 (2.66%) |
0 (0%) |
|
|
Residence (A3), n (%) |
|||
|
Capital City |
1131 (14.66%) |
15 485 117 (13.22%) |
|
|
City >1 million population |
2304 (29.87%) |
30 935 599 (26.42%) |
|
|
City (100 000 – 1 million population) |
2058 (26.68%) |
25 391 823 (21.68%) |
|
|
Town (20 000 – 100 000 inhabitants) |
969 (12.56%) |
12 272 249 (10.48%) |
|
|
Town (<20 000 inhabitants) |
327 (4.24%) |
4 700 320 (4.01%) |
|
|
Urban subtotal |
6789 (88.0%) |
87 206 206 (75.12%) |
89 261 572 (75.87%) |
|
Rural area — Village |
925 (11.99%) |
28 876 733 (24.88%) |
28 385 608 (24.13%) |
|
Education (A7), n (%) |
|||
|
Elementary school (<9 years) |
700 (9.07%) |
10 505 956 (8.93%) |
|
|
High school (9–12 years) |
2804 (36.35%) |
39 960 656 (33.96%) |
|
|
Bachelor’s Degree |
1365 (17.70%) |
18 975 764 (16.13%) |
|
|
University |
2512 (32.56%) |
41 993 808 (35.69%) |
|
|
Scientific degree |
333 (4.32%) |
6 225 524 (5.29%) |
|
|
Marital status (A4), n (%) |
|||
|
Married (or in a civil partnership) |
3204 (41.53%) |
58 005 900 (49.53%) |
|
|
Single |
2259 (29.28%) |
24 146 909 (20.62%) |
|
|
Live with someone without an official relationship |
850 (11.02%) |
8 238 633 (7.04%) |
|
|
Divorced (or estranged) |
594 (7.70%) |
12 041 073 (10.28%) |
|
|
Widower |
108 (1.40%) |
8 040 584 (6.87%) |
|
|
Other |
699 (9.06%) |
6 633 958 (5.66%) |
|
|
Living with (A5), n (%) |
|||
|
Alone |
1076 (13.95%) |
21 986 990 (18.78%) |
|
|
2 |
2328 (30.18%) |
39 125 928 (33.41%) |
|
|
3 |
1955 (25.34%) |
25 355 665 (21.65%) |
|
|
4 |
1503 (19.48%) |
17 970 605 (15.35%) |
|
|
5+ |
852 (11.04%) |
12 667 869 (10.82%) |
|
|
Number of children (A6), n (%) |
|||
|
0 |
3957 (51.30%) |
34 946 699 (29.84%) |
|
|
1 |
1817 (23.55%) |
34 593 877 (29.54%) |
|
|
2 |
1460 (18.93%) |
36 652 231 (31.30%) |
|
|
3 |
346 (4.49%) |
7 846 593 (6.70%) |
|
|
4 |
134 (1.74%) |
3 067 659 (2.62%) |
|
Table 2. Mental health characteristics of the Russian population study sample
|
Variables |
Overall (N=7714) |
|
General perception of health condition (B1), n (%) |
|
|
Bad |
279 (3.62%) |
|
Moderate |
1370 (17.77%) |
|
Good |
2483 (32.20%) |
|
Very good |
1205 (15.63%) |
|
Perfect |
2373 (30.78%) |
|
RASS total normalized score, Mean (SD) |
386.97 (277.51) |
|
Current anxiety level. STAI Mean total score (SD) |
44.92 (11.71) |
|
Clinically relevant anxiety. STAI >39, n (%) |
5047 (65.43%) |
|
Current depression level. CES-D, Mean total score (SD) |
18.01 (11.82) |
|
Clinically relevant depression, CES-D >23, n (%) |
2327 (30.17%) |
|
Anxiety changes during pandemic (F21), n (%) |
|
|
Much worse |
905 (11.73%) |
|
A little worse |
2271 (29.44%) |
|
The same |
3940 (51.08%) |
|
A little better |
373 (4.84%) |
|
Much better |
225 (2.92%) |
|
Depression changes during pandemic (G21), n (%) |
|
|
Much worse |
991 (12.85%) |
|
A little worse |
1836 (23.80%) |
|
The same |
4200 (54.45%) |
|
A little better |
428 (5.55%) |
|
Much better |
259 (3.36%) |
|
Reported mental disorder in history (B5), n (%) |
|
|
No reported mental disorder in history |
5933 (76.91%) |
|
Reported anxiety disorder in history |
970 (12.57%) |
|
Reported depression in history |
961 (12.46%) |
|
Reported psychosis in history |
179 (2.32%) |
|
Reported bipolar disorder in history |
167 (2.16%) |
|
Reported other mental disorder in history |
280 (3.63%) |
|
Reported psychiatric treatment in history (B6), n (%) |
|
|
No psychiatric treatment reported |
6798 (88.13%) |
|
Reported psychotherapy history |
365 (4.73%) |
|
Reported antipsychotics use in history |
233 (3.02%) |
|
Reported antidepressants use in history |
457 (5.92%) |
|
Reported anxiolytics use in history |
245 (3.18%) |
Almost half (n=3435, 44.53%) of the respondents lived in either the capital or cities with populations of greater than 1 million people. 54.58% of the respondents were educated to at least high school level (n=4210). The largest proportion of respondents were in a relationship (n=4054, 52.55%) and lived with someone else (n=6638, 86.05%), 51.3% did not have children (n=3957). The majority described their general health as being better than moderate (n=6061, 78.57%), while poor medical health was observed only in 279 persons (3.62%). Nevertheless, nearly two-thirds of participants (n=5047, 65.43%) reported clinically relevant anxiety levels based on the STAI-S total score of >39, while less than one-third (n=2327, 30.17%) of participants demonstrated depression with a CES-D depression score of >23. More than a half of the study population felt that their anxiety or depression levels had not changed or had even improved during the pandemic (n=4538, 58.83%; n=4887, 63.35%), while 3176 (41.17%) participants and n=2827 (36.65%) experienced a deterioration in either anxiety or depression, respectively. Most of the respondents indicated no history of any mental disorder (n=5933, 76.91%) or psychiatric treatment (n=6798, 88.13%), while a known history of anxiety disorder, depression, “psychosis”, bipolar disorder, or other mental disturbances were reported by 970 (12.57%), 961 (12.46%), 179 (2.32%), 167 (2.16%), and 280 (3.63%), respectively. A history of antidepressant treatment was among the most common of treatments (n=457, 5.92%), followed by psychotherapy (n=365, 4.3%), anxiolytics (n=245, 3.18%), and use of antipsychotics (n=233, 3.02%); some of the respondents received more than one type of treatments.
Statistical model of the suicide risk in the Russian population
The distribution of RASS total normalized scores in the study population is skewed (Skewness=0.825, D’Agostino Skewness=26.06, p <0.0001) to the right after the score of >500 (29.2%) (Figure 1a). Projection of these results onto the Russian population aged older than 18 suggest that 20.68% of the general population might have an increased suicidal risk (RASS standardized total score >500) (Figure 1b).
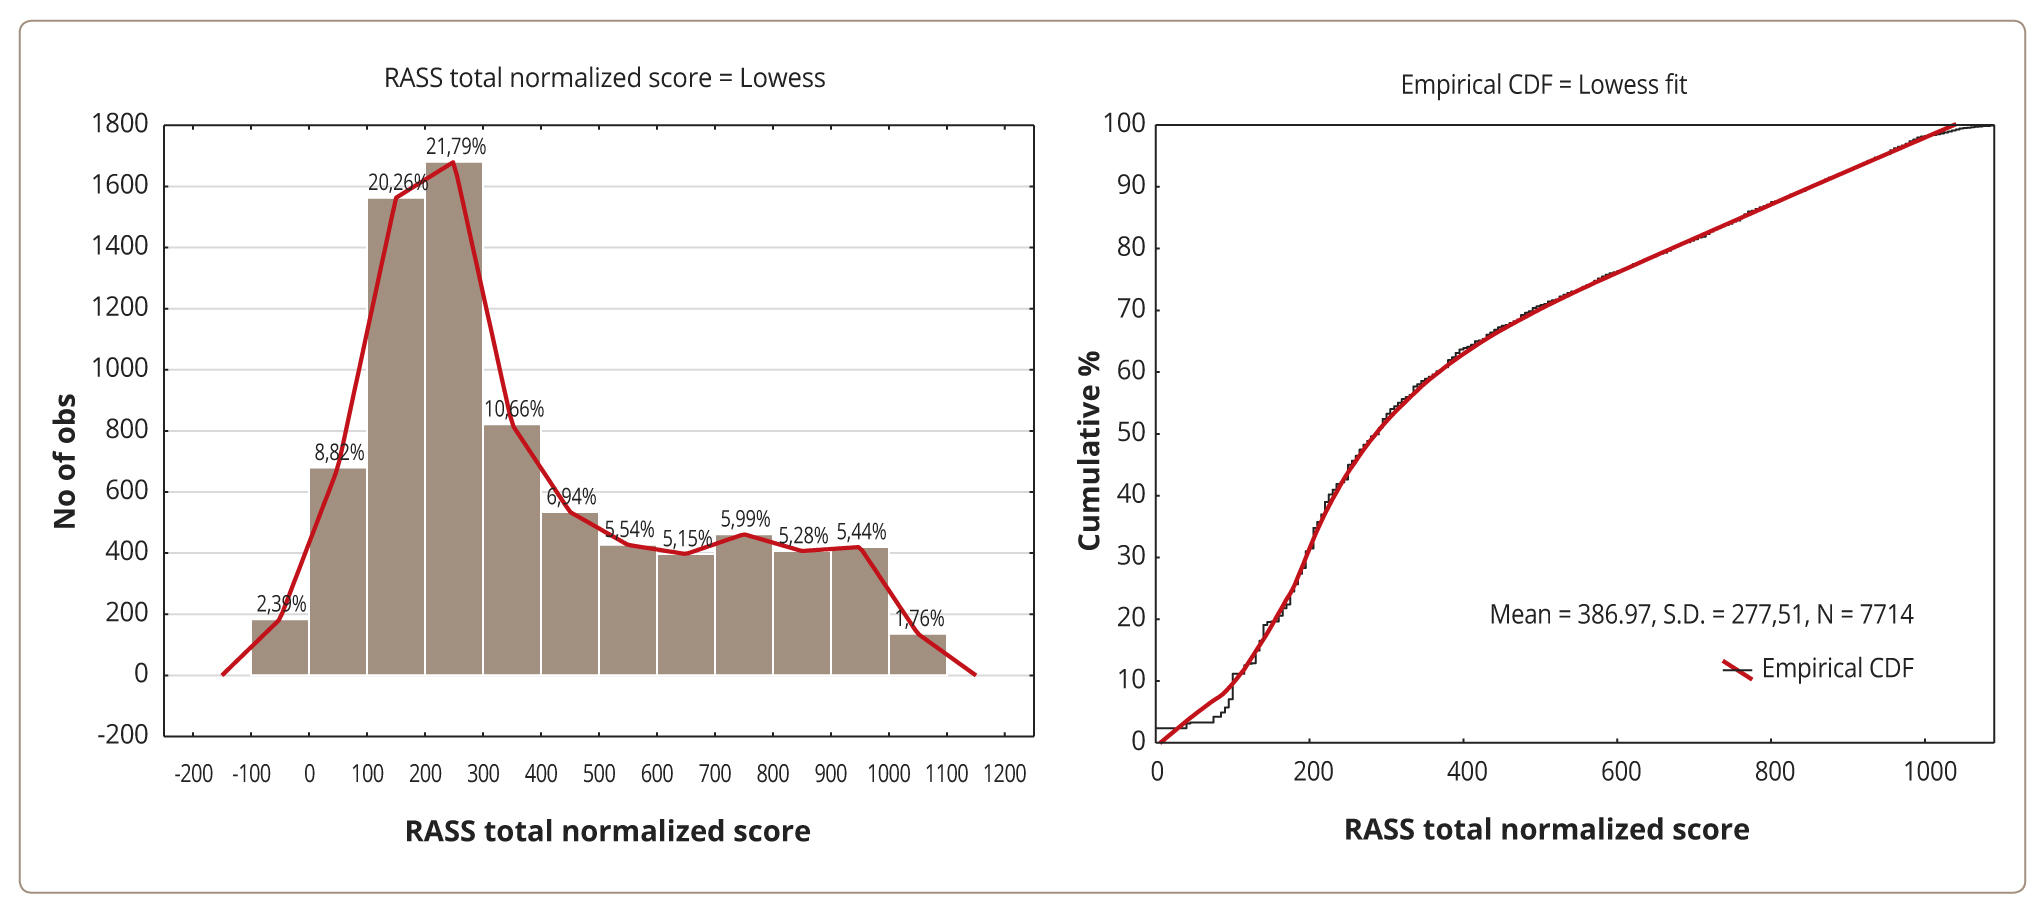
Figure 1a. The total RASS normalized score in the Russian population study sample adjusted to the Russian general population statistics: histogram (left) and the cumulative distribution function (CDF) diagram (right). Note: The lines represent locally weighted scatterplot smoothing (Lowess) fit.
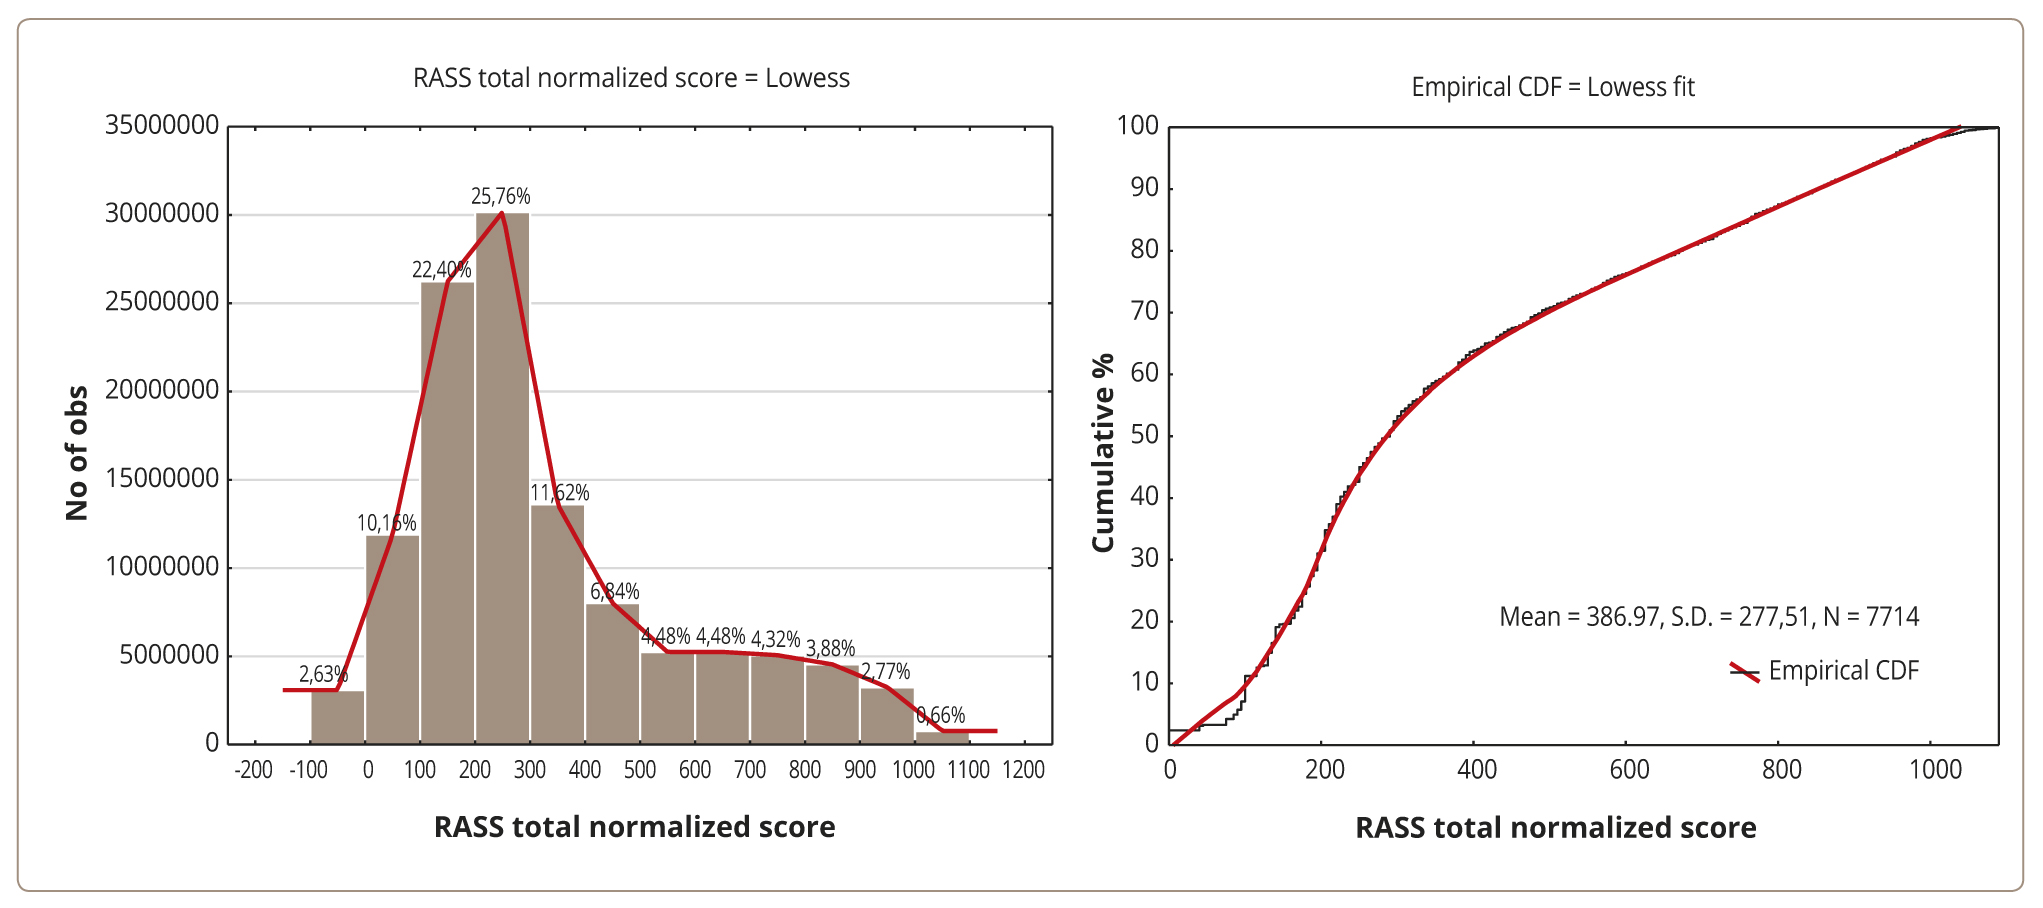
Figure 1b. The total RASS normalized score in the Russian population study sample adjusted to the Russian general population statistics: histogram (left, presented in percentage) and the cumulative distribution function (CDF) diagram (right). Note: The lines represent locally weighted scatterplot smoothing (Lowess) fit.
Suicide risk and protective factors in the Russian study sample
Overall, among the 76 variables of the COMET-G protocol, the following variables were selected based on the LASSO regression: (A2) Year of birth, (A4) Marital status, (A6) Number of children, (B5) Reported history of bipolar disorder, (B5) Reported history of depression, (B5) Reported history of other mental disorders, (B6) Reported antipsychotics use in history, CES-D >23, CES-D total score, (L3) Use of hypnotics, (L4) Nightmares, (M2) History of alcohol use, (M3) History of illicit drug use, No reported history of mental disorder, (O11) Recent change in suicidal thoughts, from the analysis of ordinal variables coded as continuous (see Figure S2 in Supplements for detailed results), and (A2) Year of birth, (A4) Marital status, (A7) Number of people in household, (B5) No reported history of mental disorders, (B6) Reported history of use of antipsychotics, (B5) Reported history of bipolar disorder, (B5) Reported history of depression, (B5) Reported history of other mental disorders, CES-D >23, CES-D total score, (D3) Precautions can help to prevent the spread of the virus, (E1) Need to communicate, (E2) Need for emotional support, (E3) Family conflict, (L3) Use of hypnotics, (L4) Nightmares, (M2) Alcohol use in history, (M3) Illicit drugs use in history, from the analysis of ordinal variables coded as categorical (see Figure S3 in Supplements for detailed results).
These regressors were included in the two final best subset general linear regression models. The final best subset models were significant and explained 42.8% and 44.0% of the RASS suicidal risk score variability (Table 3). Univariate data analyses of the model are summarized in Tables 4 and 6. Tables 5 and 7 report the effects of parameter estimates where B and β measurements can be used to explain the nature of an association between each regressor and the RASS total score, with positive values reflecting an increased risk while negative values indicate a protective effect.
Table 3. The best subset general linear regression model for fitting regressor variables and explaining the variety of the RASS total suicidality scores in the Russian population study sample
|
Model type |
Mult. R2 |
Adj. Mult. R2 |
SS |
Df model |
MS |
SS residual |
Df residual |
MS residual |
F |
p |
|
All variables as continuous |
0.428 |
0.426 |
253957392 |
22 |
11543518 |
340020457 |
7691 |
44210.2 |
261.1 |
<0.0001 |
|
All variables as categorical |
0.443 |
0.440 |
263011138 |
32 |
8219098 |
330966711 |
7681 |
43089 |
190.7 |
<0.0001 |
Table 4. Univariate continuous data analysis of the general linear model predicting the RASS total standardized suicidality scores in the Russian population study sample
|
Effect |
SS |
df |
MS |
F |
p |
Partial η2 |
Non-centrality |
Observed power (α=0.05) |
|
Intercept |
4078652 |
1 |
4078652 |
92.256 |
<0.001 |
0.012 |
92.26 |
1.00 |
|
CES-D Total score |
16781198 |
1 |
16781198 |
379.578 |
<0.001 |
0.047 |
379.58 |
1.00 |
|
A2. Year of birth |
4726106 |
1 |
4726106 |
106.901 |
<0.001 |
0.014 |
106.90 |
1.00 |
|
M3. Illicit drugs use in history |
4583386 |
1 |
4583386 |
103.673 |
<0.001 |
0.013 |
103.67 |
1.00 |
|
B5. Reported depression in history |
4483258 |
1 |
4483258 |
101.408 |
<0.001 |
0.013 |
101.41 |
1.00 |
|
M2. Alcohol use in history |
2766860 |
1 |
2766860 |
62.584 |
<0.001 |
0.008 |
62.58 |
1.00 |
|
L4. Nightmares |
2699870 |
1 |
2699870 |
61.069 |
<0.001 |
0.008 |
61.07 |
1.00 |
|
E3. Family conflicts |
2009256 |
1 |
2009256 |
45.448 |
<0.001 |
0.006 |
45.45 |
1.00 |
|
L3. Use of hypnotics |
1492063 |
1 |
1492063 |
33.749 |
<0.001 |
0.004 |
33.75 |
1.00 |
|
A4. Marital status |
1470723 |
5 |
294145 |
6.653 |
<0.001 |
0.004 |
33.27 |
1.00 |
|
B5. Reported bipolar disorder in history |
1301404 |
1 |
1301404 |
29.437 |
<0.001 |
0.004 |
29.44 |
1.00 |
|
B5. Reported other mental disorder in history |
1299200 |
1 |
1299200 |
29.387 |
<0.001 |
0.004 |
29.39 |
1.00 |
|
D3. Precautions can help to prevent the spread of the virus |
1109357 |
1 |
1109357 |
25.093 |
<0.001 |
0.003 |
25.09 |
1.00 |
|
A7. Number of people in household |
690377 |
1 |
690377 |
15.616 |
<0.001 |
0.002 |
15.62 |
0.98 |
|
E2. Need for emotional support |
682440 |
1 |
682440 |
15.436 |
<0.001 |
0.002 |
15.44 |
0.98 |
|
CES-D >23 |
393136 |
1 |
393136 |
8.892 |
0.003 |
0.001 |
8.89 |
0.85 |
|
B6. Reported antipsychotics use in history |
321795 |
1 |
321795 |
7.279 |
0.007 |
0.001 |
7.28 |
0.77 |
|
E1. Need to communicate |
258079 |
1 |
258079 |
5.838 |
0.016 |
0.001 |
5.84 |
0.68 |
|
B5. No reported mental disorder in history |
113791 |
1 |
113791 |
2.574 |
0.109 |
0.000 |
2.57 |
0.36 |
|
Error |
340020457 |
7691 |
44210 |
Note: Predictors are estimated as continuous variables and sorted by partial η2 effect size.
Table 5. General regression model predicting the RASS total standardized suicidality scores in the Russian population study sample based on continuous variables output
|
Predictor |
Level of effect |
B |
S.E. of B |
t |
p |
LCL 95% of B |
UCL 95% of B |
β |
S.E. of β |
LCL 95% of β |
UCL 95% of β |
|
Intercept |
-4582.89 |
477.14 |
-9.60 |
<0.001 |
-5518.21 |
-3647.58 |
|||||
|
A2. Year of birth |
2.48 |
0.24 |
10.34 |
<0.001 |
2.01 |
2.95 |
0.11 |
0.01 |
0.09 |
0.13 |
|
|
M3. Illicit drugs use in history |
76.68 |
7.53 |
10.18 |
<0.001 |
61.92 |
91.44 |
0.10 |
0.01 |
0.08 |
0.12 |
|
|
CES-D total score |
7.68 |
0.39 |
19.48 |
<0.001 |
6.90 |
8.45 |
0.33 |
0.02 |
0.29 |
0.36 |
|
|
B5. Reported depression in history |
No |
-50.21 |
4.99 |
-10.07 |
<0.001 |
-59.98 |
-40.43 |
-0.12 |
0.01 |
-0.14 |
-0.10 |
|
M2. Alcohol use in history |
60.21 |
7.61 |
7.91 |
<0.001 |
45.29 |
75.13 |
0.07 |
0.01 |
0.06 |
0.09 |
|
|
L4. Nightmares |
22.02 |
2.82 |
7.81 |
<0.001 |
16.50 |
27.54 |
0.08 |
0.01 |
0.06 |
0.10 |
|
|
E3. Family conflicts |
15.97 |
2.37 |
6.74 |
<0.001 |
11.33 |
20.62 |
0.06 |
0.01 |
0.04 |
0.08 |
|
|
L3. Use of hypnotics |
17.02 |
2.93 |
5.81 |
<0.001 |
11.28 |
22.76 |
0.06 |
0.01 |
0.04 |
0.08 |
|
|
B5. Reported bipolar disorder in history |
No |
-48.07 |
8.86 |
-5.43 |
<0.001 |
-65.44 |
-30.70 |
-0.05 |
0.01 |
-0.07 |
-0.03 |
|
B5. Reported other mental disorder in history |
No |
-37.66 |
6.95 |
-5.42 |
<0.001 |
-51.28 |
-24.04 |
-0.05 |
0.01 |
-0.07 |
-0.03 |
|
D3. Precautions can help to prevent the spread of the virus |
11.77 |
2.35 |
5.01 |
<0.001 |
7.16 |
16.37 |
0.05 |
0.01 |
0.03 |
0.06 |
|
|
A7. Number of people in household |
-8.53 |
2.16 |
-3.95 |
<0.001 |
-12.76 |
-4.30 |
-0.04 |
0.01 |
-0.05 |
-0.02 |
|
|
E2. Need for emotional support |
-13.02 |
3.31 |
-3.93 |
<0.001 |
-19.52 |
-6.52 |
-0.04 |
0.01 |
-0.06 |
-0.02 |
|
|
A4. Marital status |
Married (or in a civil partnership) |
-20.55 |
5.30 |
-3.88 |
<0.001 |
-30.93 |
-10.16 |
-0.04 |
0.01 |
-0.06 |
-0.02 |
|
CES-D >23 |
Yes |
14.31 |
4.80 |
2.98 |
0.003 |
4.90 |
23.72 |
0.05 |
0.02 |
0.02 |
0.08 |
|
B6. Reported antipsychotics use in history |
No |
-20.63 |
7.65 |
-2.70 |
0.007 |
-35.62 |
-5.64 |
-0.03 |
0.01 |
-0.04 |
-0.01 |
|
E1. Need to communicate |
7.53 |
3.12 |
2.42 |
0.016 |
1.42 |
13.64 |
0.03 |
0.01 |
0.00 |
0.05 |
|
|
A4. Marital status |
Single |
11.71 |
5.91 |
1.98 |
0.047 |
0.13 |
23.30 |
0.02 |
0.01 |
0.00 |
0.04 |
|
A4. Marital status |
Live with someone without an official relationship |
12.43 |
7.44 |
1.67 |
0.095 |
-2.16 |
27.01 |
0.02 |
0.01 |
0.00 |
0.03 |
|
B5. No reported mental disorder in history |
No |
6.88 |
4.29 |
1.60 |
0.109 |
-1.53 |
15.29 |
0.02 |
0.01 |
0.00 |
0.05 |
|
A4. Marital status |
Divorced (or estranged) |
9.00 |
8.33 |
1.08 |
0.280 |
-7.33 |
25.33 |
0.01 |
0.01 |
-0.01 |
0.03 |
|
A4. Marital status |
Other |
0.28 |
8.17 |
0.03 |
0.972 |
-16 |
16 |
0.00 |
0.01 |
-0.02 |
0.02 |
Note: Positive values of B or β indicate an increase in suicidal risk, whilst negative values denote protective factors; the predictors are sorted by p-level.
Table 6. Univariate categorical data analysis of the general linear model predicting the RASS total standardized suicidality scores in the Russian population study sample
|
Predictor |
SS |
df |
MS |
F |
p |
Partial η2 |
Non-centrality |
Observed power (α=0.05) |
|
Intercept |
2635321 |
1 |
2635321 |
61,160 |
<0.001 |
0,008 |
61,16 |
1,00 |
|
CES-D total score |
13943609 |
1 |
1,4E+07 |
323,600 |
<0.001 |
0,040 |
323,60 |
1,00 |
|
O11. Recent change in suicidal thoughts |
11823509 |
4 |
2955877 |
68,599 |
<0.001 |
0,034 |
274,40 |
1,00 |
|
M3. Illicit drugs use in history |
5163497 |
2 |
2581748 |
59,917 |
<0.001 |
0,015 |
119,83 |
1,00 |
|
Reported depression in history |
4384887 |
1 |
4384887 |
101,764 |
<0.001 |
0,013 |
101,76 |
1,00 |
|
A2. Year of birth |
3471227 |
1 |
3471227 |
80,559 |
<0.001 |
0,010 |
80,56 |
1,00 |
|
M2. Alcohol use in history |
3070752 |
1 |
3070752 |
71,265 |
<0.001 |
0,009 |
71,27 |
1,00 |
|
L4. Nightmares |
2777783 |
4 |
694446 |
16,117 |
<0.001 |
0,008 |
64,47 |
1,00 |
|
B5. Reported other mental disorder in history |
1652906 |
1 |
1652906 |
38,360 |
<0.001 |
0,005 |
38,36 |
1,00 |
|
B5. Reported bipolar disorder in history |
1546127 |
1 |
1546127 |
35,882 |
<0.001 |
0,005 |
35,88 |
1,00 |
|
L3. Use of hypnotics |
1377382 |
4 |
344345 |
7,992 |
<0.001 |
0,004 |
31,97 |
1,00 |
|
A4. Marital status |
832964 |
5 |
166593 |
3,866 |
0,002 |
0,003 |
19,33 |
0,94 |
|
A6. Number of children |
421692 |
4 |
105423 |
2,447 |
0,044 |
0,001 |
9,79 |
0,71 |
|
B6. Reported antipsychotics use in history |
394881 |
1 |
394881 |
9,164 |
0,002 |
0,001 |
9,16 |
0,86 |
|
CES-D >23 |
141110 |
1 |
141110 |
3,275 |
0,070 |
0,000 |
3,27 |
0,44 |
|
B5. No reported mental disorder in history |
25797 |
1 |
25797 |
0,599 |
0,439 |
0,000 |
0,60 |
0,12 |
|
Error |
330966711 |
7681 |
43089 |
Note: Predictors are estimated as categorical variables and sorted by partial η2 effect size.
Table 7. General regression model predicting the RASS total standardized suicidality scores in the Russian population study sample based on categorical variables output
|
Effect |
Level of effect |
B |
S.E. of B |
t |
p |
LCL 95% of B |
UCL 95% of B |
β |
S.E. of β |
LCL 95% of β |
UCL 95% of β |
|
Intercept |
-3903 |
499 |
-7.82 |
<0.001 |
-4881 |
-2924 |
|||||
|
A2. Year of birth |
2.26 |
0.25 |
8.98 |
<0.001 |
1.76 |
2.75 |
0.10 |
0.01 |
0.08 |
0.12 |
|
|
CES-D total score |
7.04 |
0.39 |
17.99 |
<0.001 |
6.27 |
7.80 |
0.30 |
0.02 |
0.27 |
0.33 |
|
|
M2. Alcohol use in history |
I did not drink much |
-31.68 |
3.75 |
-8.44 |
<0.001 |
-39.03 |
-24.32 |
-0.08 |
0.01 |
-0.10 |
-0.06 |
|
M3. Illicit drugs use in history |
I did not use it |
-67.47 |
7.64 |
-8.83 |
<0.001 |
-82.45 |
-52.50 |
-0.08 |
0.01 |
-0.10 |
-0.07 |
|
O11. Recent change in suicidal thoughts |
Very much decreased |
-79.97 |
7.63 |
-10.49 |
<0.001 |
-94.92 |
-65.03 |
-0.11 |
0.01 |
-0.13 |
-0.09 |
|
O11. Recent change in suicidal thoughts |
Decreased a bit |
99.32 |
10.51 |
9.45 |
<0.001 |
78.71 |
119.94 |
0.11 |
0.01 |
0.09 |
0.14 |
|
O11. Recent change in suicidal thoughts |
Neither increased, nor decreased |
-45.87 |
4.76 |
-9.63 |
<0.001 |
-55.20 |
-36.54 |
-0.10 |
0.01 |
-0.12 |
-0.08 |
|
B5. Reported depression in history |
No |
-49.76 |
4.93 |
-10.09 |
<0.001 |
-59.43 |
-40.09 |
-0.12 |
0.01 |
-0.14 |
-0.10 |
|
O11. Recent change in suicidal thoughts |
Increased a bit |
57.04 |
7.11 |
8.02 |
<0.001 |
43.10 |
70.97 |
0.08 |
0.01 |
0.06 |
0.10 |
|
L4. Nightmares |
Almost never |
-45.64 |
6.07 |
-7.52 |
<0.001 |
-57.55 |
-33.74 |
-0.09 |
0.01 |
-0.11 |
-0.06 |
|
B5. Reported other mental disorder in history |
No |
-42.48 |
6.86 |
-6.19 |
<0.001 |
-55.93 |
-29.04 |
-0.06 |
0.01 |
-0.08 |
-0.04 |
|
B5. Reported bipolar disorder in history |
No |
-52.46 |
8.76 |
-5.99 |
<0.001 |
-69.63 |
-35.29 |
-0.06 |
0.01 |
-0.07 |
-0.04 |
|
L3. Use of hypnotics |
Almost never |
-30.37 |
6.09 |
-4.99 |
<0.001 |
-42.31 |
-18.43 |
-0.05 |
0.01 |
-0.07 |
-0.03 |
|
M3. Illicit drugs use in history |
Occasionally and rather rarely |
38.40 |
8.82 |
4.35 |
<0.001 |
21.11 |
55.68 |
0.04 |
0.01 |
0.02 |
0.06 |
|
A4. Marital status |
Married (or in a civil partnership) |
-17.33 |
5.52 |
-3.14 |
0.002 |
-28.15 |
-6.50 |
-0.03 |
0.01 |
-0.05 |
-0.01 |
|
B6. Reported antipsychotics use in history |
No |
-22.99 |
7.60 |
-3.03 |
0.002 |
-37.88 |
-8.10 |
-0.03 |
0.01 |
-0.05 |
-0.01 |
|
CES-D >23 |
Yes |
8.61 |
4.76 |
1.81 |
0.070 |
-0.72 |
17.93 |
0.03 |
0.02 |
0.00 |
0.06 |
|
A6. Number of children |
0 |
11.18 |
6.49 |
1.72 |
0.085 |
-1.54 |
23.90 |
0.02 |
0.01 |
0.00 |
0.05 |
|
L4. Nightmares |
Rarely |
12.26 |
7.20 |
1.70 |
0.088 |
-1.85 |
26.37 |
0.02 |
0.01 |
0.00 |
0.03 |
|
A6. Number of children |
2 |
-10.74 |
6.38 |
-1.68 |
0.092 |
-23.26 |
1.77 |
-0.02 |
0.01 |
-0.04 |
0.00 |
|
A4. Marital status |
Single |
9.67 |
6.14 |
1.58 |
0.115 |
-2.36 |
21.71 |
0.02 |
0.01 |
0.00 |
0.04 |
|
A6. Number of children |
1 |
-9.28 |
5.97 |
-1.56 |
0.120 |
-21 |
2 |
-0.02 |
0.01 |
-0.03 |
0.00 |
|
L3. Use of hypnotics |
Sometimes |
11.92 |
8.33 |
1.43 |
0.153 |
-4.42 |
28.26 |
0.01 |
0.01 |
0.00 |
0.03 |
|
L4. Nightmares |
Often |
12.36 |
9.75 |
1.27 |
0.205 |
-6.76 |
31.48 |
0.01 |
0.01 |
-0.01 |
0.03 |
|
A4. Marital status |
Divorced (or estranged) |
10.58 |
8.38 |
1.26 |
0.207 |
-5.85 |
27.01 |
0.01 |
0.01 |
-0.01 |
0.03 |
|
L3. Use of hypnotics |
Often |
10.21 |
10.96 |
0.93 |
0.352 |
-11.27 |
31.70 |
0.01 |
0.01 |
-0.01 |
0.03 |
|
A4. Marital status |
Live with someone without an official relationship |
5.86 |
7.44 |
0.79 |
0.431 |
-8.72 |
20.44 |
0.01 |
0.01 |
-0.01 |
0.02 |
|
B5. No reported mental disorder in history |
No |
3.28 |
4.24 |
0.77 |
0.439 |
-5.03 |
11.58 |
0.01 |
0.01 |
-0.02 |
0.04 |
|
L4. Nightmares |
Sometimes |
-5.13 |
7.01 |
-0.73 |
0.465 |
-18.88 |
8.62 |
-0.01 |
0.01 |
-0.02 |
0.01 |
|
L3. Use of hypnotics |
Rarely |
5.30 |
7.88 |
0.67 |
0.501 |
-10.14 |
20.74 |
0.01 |
0.01 |
-0.01 |
0.03 |
|
A4. Marital status |
Other |
3.83 |
8.14 |
0.47 |
0.638 |
-12.12 |
19.78 |
0.00 |
0.01 |
-0.01 |
0.02 |
|
A6. Number of children |
3 |
-2.02 |
9.83 |
-0.21 |
0.837 |
-21.30 |
17.25 |
0.00 |
0.01 |
-0.02 |
0.02 |
Note: Positive values of B or β indicate an increased suicidal risk, whilst negative values denote the protective factors; the predictors are sorted by p-level.
Table 8. Descriptive statistics of the RASS total standardized suicidality scores in the Russian population study sample, linking the variables selected by the best subset general regression model within the post-hoc ANOVA analysis
|
Effect |
Level of effect |
N |
Mean |
S.D. |
S.E. |
LCL 95% |
UCL 95% |
Bonferroni homogenous groups (p <0.05)* |
|
A4. Marital status |
Divorced (or estranged) |
594 |
385,18 |
271,93 |
11,16 |
363,26 |
407,09 |
A |
|
Live with someone without an official relationship |
850 |
436,14 |
285,91 |
9,81 |
416,89 |
455,38 |
B |
|
|
Married (or in a civil partnership) |
3204 |
311,81 |
235,90 |
4,17 |
303,64 |
319,98 |
C |
|
|
Other |
699 |
454,03 |
294,87 |
11,15 |
432,14 |
475,93 |
B |
|
|
Single |
2259 |
458,09 |
296,83 |
6,25 |
445,85 |
470,34 |
B |
|
|
Widower |
108 |
317,96 |
266,43 |
25,64 |
267,14 |
368,79 |
C |
|
|
A6. Number of children |
0 |
3957 |
448,39 |
294,13 |
4,68 |
439,22 |
457,55 |
A |
|
1 |
1817 |
333,60 |
249,80 |
5,86 |
322,11 |
345,10 |
B |
|
|
2 |
1460 |
302,89 |
230,30 |
6,03 |
291,07 |
314,71 |
C |
|
|
3 |
346 |
313,82 |
235,47 |
12,66 |
288,92 |
338,71 |
BC |
|
|
4 |
134 |
402,01 |
268,74 |
23,22 |
356,10 |
447,93 |
A |
|
|
L3. Use of hypnotics |
Almost never |
5993 |
335,56 |
247,89 |
3,20 |
329,28 |
341,84 |
A |
|
Rarely |
693 |
552,42 |
303,07 |
11,51 |
529,81 |
575,02 |
B |
|
|
Sometimes |
556 |
519,50 |
292,08 |
12,39 |
495,17 |
543,83 |
B |
|
|
Often |
269 |
621,06 |
294,94 |
17,98 |
585,65 |
656,47 |
C |
|
|
Almost always |
203 |
666,80 |
284,41 |
19,96 |
627,44 |
706,16 |
C |
|
|
L4. Nightmares |
Almost never |
5434 |
314,84 |
232,70 |
3,16 |
308,66 |
321,03 |
A |
|
Rarely |
856 |
562,84 |
299,28 |
10,23 |
542,77 |
582,92 |
B |
|
|
Sometimes |
882 |
495,81 |
290,34 |
9,78 |
476,62 |
514,99 |
C |
|
|
Often |
350 |
626,47 |
289,48 |
15,47 |
596,04 |
656,90 |
D |
|
|
Almost always |
192 |
707,63 |
277,31 |
20,01 |
668,15 |
747,11 |
E |
|
|
M2. Alcohol use in history |
I did not drink much |
6698 |
365,69 |
268,03 |
3,27 |
359,27 |
372,11 |
A |
|
I drank a lot |
1016 |
527,28 |
297,51 |
9,33 |
508,97 |
545,60 |
B |
|
|
M3. Illicit drugs use in history |
I did not use it |
7089 |
363,45 |
264,82 |
3,15 |
357,29 |
369,62 |
A |
|
Occasionally and rather rarely |
495 |
642,77 |
280,95 |
12,63 |
617,96 |
667,58 |
B |
|
|
Often |
130 |
695,50 |
267,11 |
23,43 |
649,15 |
741,85 |
C |
|
|
O11. Recent change in suicidal thoughts |
Very much decreased |
626 |
325,10 |
253,99 |
10,15 |
305,16 |
345,03 |
A |
|
Decreased a bit |
275 |
643,47 |
255,11 |
15,38 |
613,19 |
673,76 |
B |
|
|
Neither increased, nor decreased |
5530 |
338,71 |
250,34 |
3,37 |
332,11 |
345,30 |
A |
|
|
Increased a bit |
773 |
611,66 |
282,48 |
10,16 |
591,72 |
631,61 |
B |
|
|
Very much increased |
510 |
507,39 |
306,90 |
13,59 |
480,69 |
534,09 |
C |
|
|
CES-D >23 |
Yes |
2327 |
594,69 |
293,23 |
6,08 |
582,77 |
606,61 |
A |
|
No |
5387 |
297,24 |
215,53 |
2,94 |
291,49 |
303,00 |
B |
|
|
B5. No reported mental disorder in history |
No |
1781 |
553,80 |
303,78 |
7,20 |
539,68 |
567,92 |
A |
|
Yes |
5933 |
336,89 |
248,14 |
3,22 |
330,57 |
343,21 |
B |
|
|
B5. Reported depression in history |
No |
6753 |
354,52 |
258,09 |
3,14 |
348,36 |
360,68 |
A |
|
Yes |
961 |
615,01 |
301,29 |
9,72 |
595,94 |
634,08 |
B |
|
|
B5. Reported bipolar disorder in history |
No |
7547 |
379,31 |
272,98 |
3,14 |
373,15 |
385,47 |
A |
|
Yes |
167 |
733,20 |
259,87 |
20,11 |
693,50 |
772,91 |
B |
|
|
B5. Reported other mental disorder in history |
No |
7434 |
377,62 |
271,72 |
3,15 |
371,44 |
383,79 |
A |
|
Yes |
280 |
635,36 |
312,68 |
18,69 |
598,57 |
672,14 |
B |
|
|
B6. Reported antipsychotics use in history |
No |
7481 |
377,62 |
271,80 |
3,14 |
371,46 |
383,78 |
A |
|
Yes |
233 |
687,19 |
291,57 |
19,10 |
649,55 |
724,82 |
B |
|
|
Total |
7714 |
386,97 |
277,5067 |
3,1596 |
380,7767 |
393,1641 |
Note: * Reflect statistically significant differences if there are no common letters at Bonferroni corrected p <0.05 (i.e., A vs. B are different at pBonferroni <0.05, while A vs. AB are not different at pBonferroni <0.05).
The following variables predicted the RASS total standardized score in a linear manner: CES-D total score, CES-D total score >23, year of birth, history of use of illicit drugs and alcohol, history of depressive disorders, nightmares, and use of hypnotics, believing that precautions can help to prevent the spread of COVID-19, recent changes in family conflicts, number of people in household, need for emotional support and communication (Tables 4 and 5). Regression with the ordinal variables, coded as categorical, showed that the factors of recent changes in suicidal thoughts and the number of children predicted the RASS total normalized score in a non-linear manner (Tables 6 and 7). Finally, the history of some mental disorders and the use of antipsychotics also predicted the RASS total standardized score.
Table 8 demonstrates the marginal mean values of RASS total scores based on the level of the categorical regressor. Figure 2 notably depicts an association between the RASS score and age (year of birth), as well as the interactions between age and gender. Being married, being a widower, and having 1–3 children served as protective factors against the development of suicidality, the variables describing good sleep quality without use of hypnotics, no history of alcohol or illicit drug use, and having no current depression or history of any mental disorders were associated with a statistically significant lower RASS total standardized score, whereas other responses have been correlated with higher suicidality risk scores. Distribution of the RASS total standardized scores by age and gender demonstrated no apparent difference between males and females, but presented a clear increase of suicidality among youngers (Figure 2). As only 2.66% (n=205) described their gender as “other”, the age-by-gender distribution of this subpopulation may show inconsistent results, however.
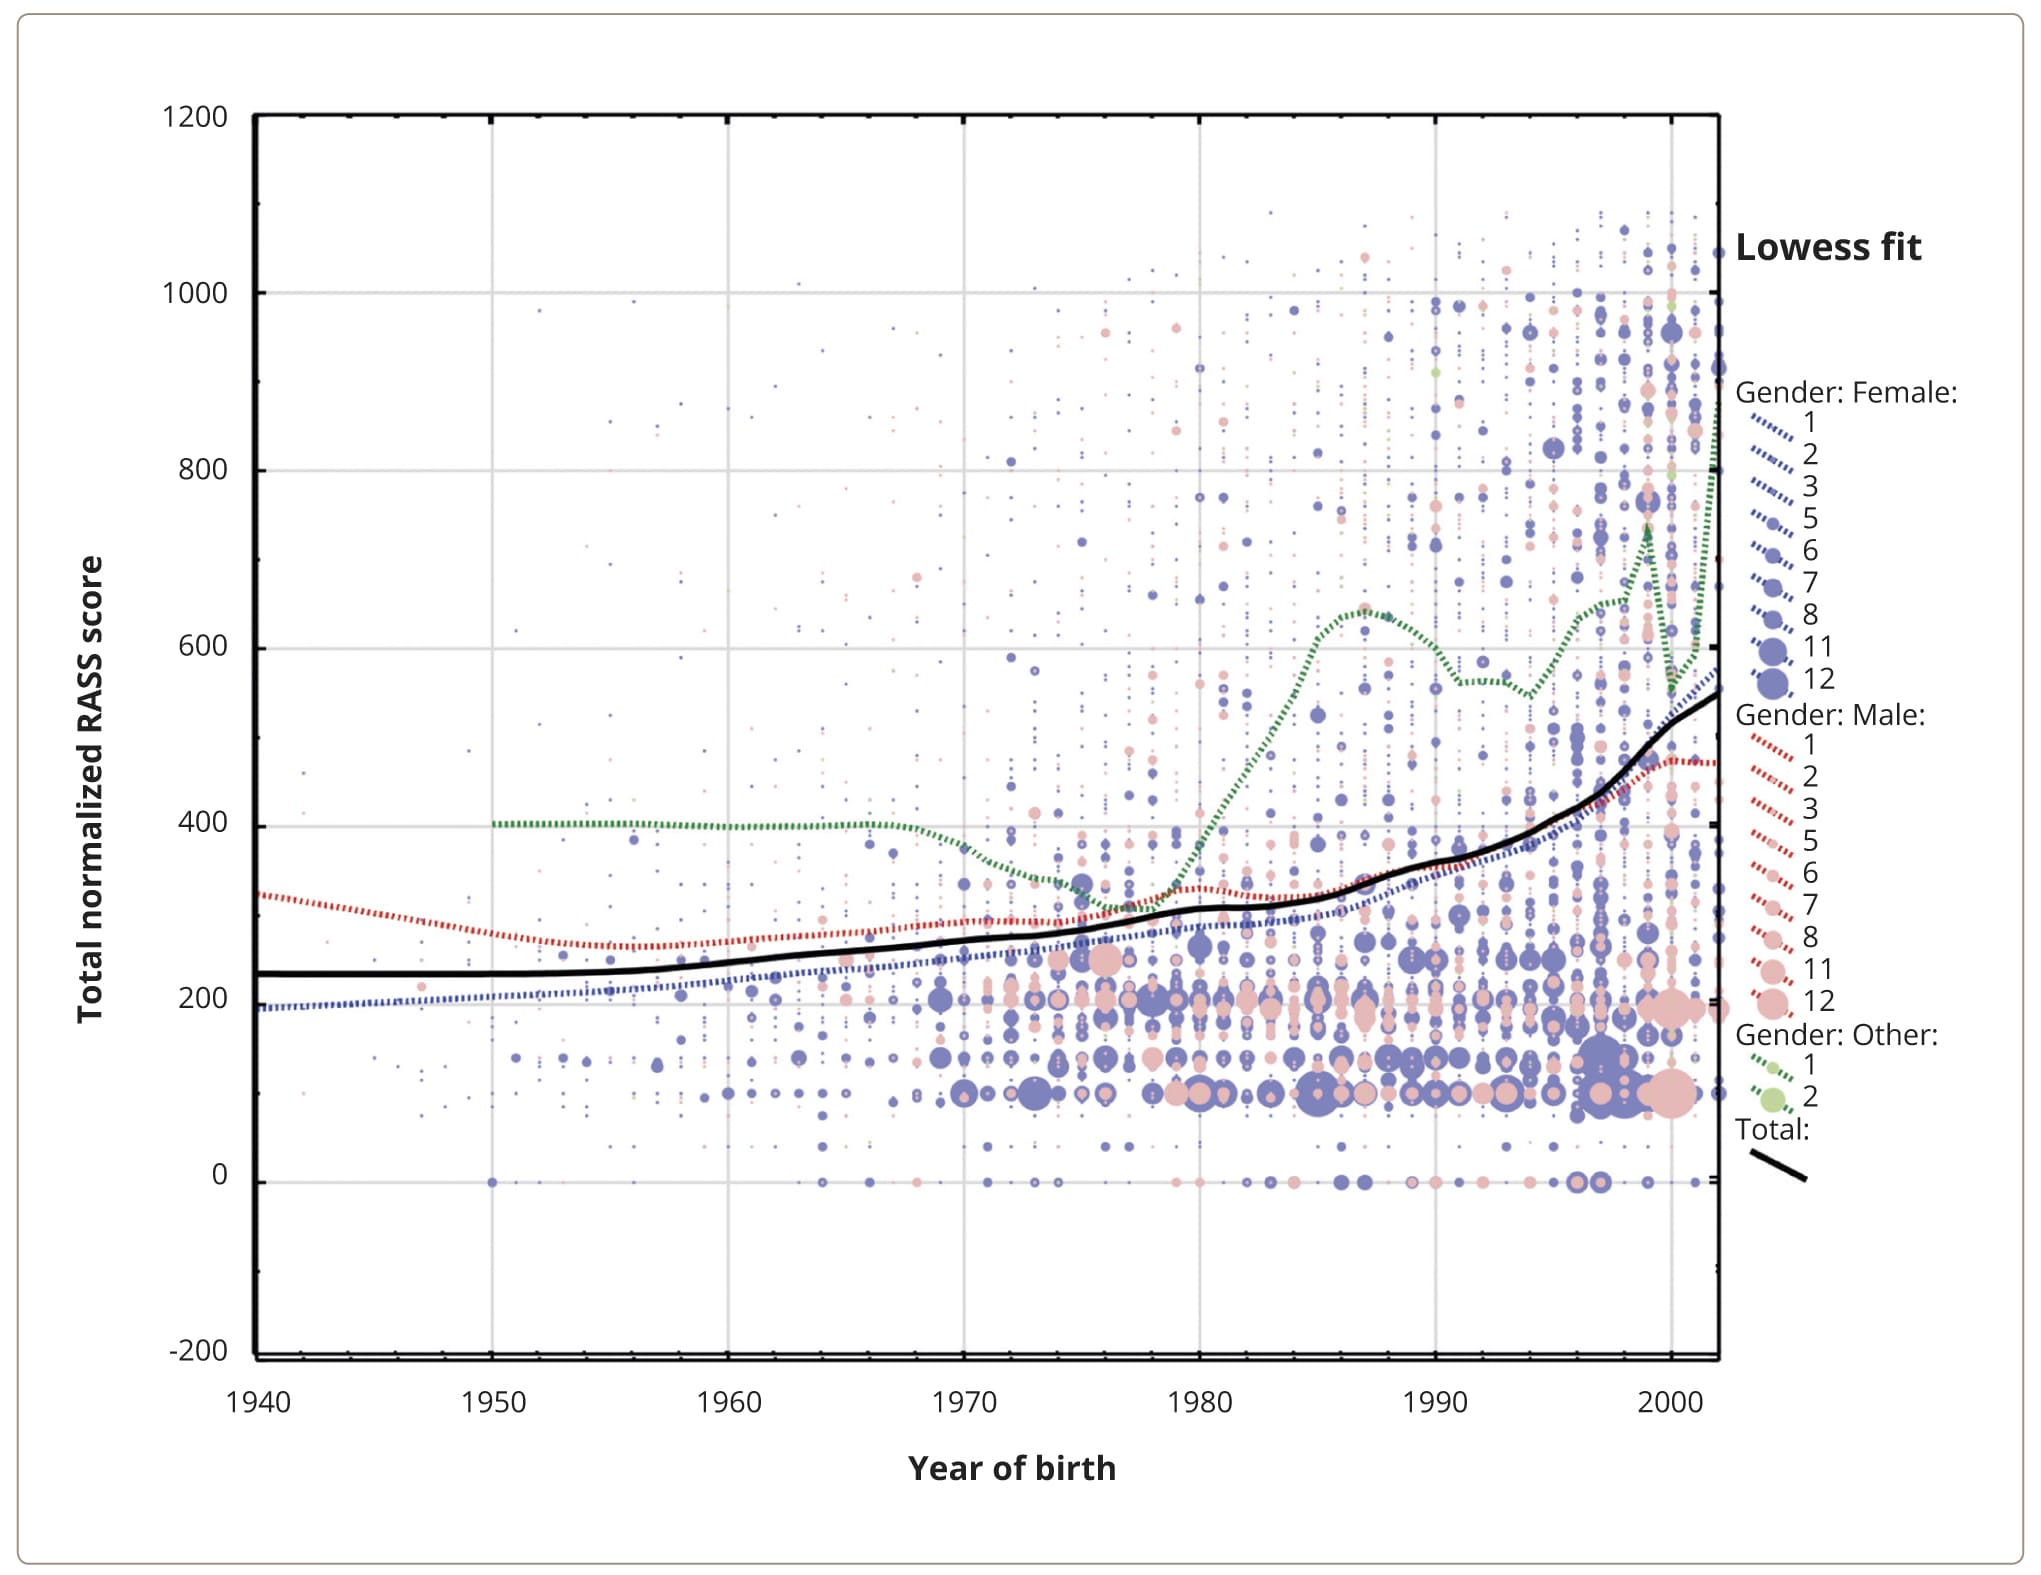
Figure 2. Bubble-plot of associations between the RASS total standardized score and a year of birth categorized by the gender factor. Note: Bubbles reflect the density of the study population according to the year of birth per total normalized score from n=1 to n=12; the lines represent locally weighted scatterplot smoothing (Lowess) fits.
DISCUSSION
To our knowledge, the current work represents the first large-scale study that evaluates suicidality rates in the Russian general population in the context of the COVID-19 pandemic. Our study sample included 7714 respondents whose socio-demographic characteristics were consistent with the data for the general population of Russia and have been weighted for data analysis purposes [57].
Graphic analysis of the RASS total suicidality score distribution in our study sample shows that it is clearly skewed towards to the right after a score of 500, while in the score range from 0 to 500 the shape of the distribution is normal (Figures 1a, 1b). Thus, normalized scores over 500 on the RASS scale may reflect an increased suicidality. In our study sample, 2249 (29.15%) respondents had a normalized total RASS score higher than 500. The RASS scores distribution violated the hypothesis of a normal distribution, but even if we would accept this hypothesis, we would observe 1595 (20.68%) respondents with a total score higher than 664.5 (Mean 387.00 plus 1SD=277.51). Therefore, our results indicate that, at least 20%, and as high as 30%, of the study population demonstrated an increased suicidality risk during the pandemic in 2020. Similar results were observed in an Australian study [32], where 27.5% of population sample during COVID-19 (March 19th, 2020 – April 15th, 2020) reported suicidal thoughts. In the UK, suicidal thoughts and ideas of self-harm have been occurring more frequently in patients with COVID-19 diagnosis (33%) than in the general population (18% — suicidal thoughts, 5% — self-harm ideas). The same tendency was observed in China (up to 27% with suicidal thoughts among infected patients; 24.5% among Wuhan hospital patients; 29.7% among adolescents during the first pandemic wave vs. 22.5% across the second wave), and suicidality has increased in the Danish, Greek, Indian, and the Japanese general populations and in other countries of Eurasia [10, 51, 59–62]. However, there was no evidence of any significant increase in suicide rates in response to the pandemic; the Czech Republic, Italy, Poland, and other international research groups reported either decreased rates or fluctuating numbers between pandemic waves, but the studies had different methodologies and did not always take into account country statistics on death rates due to COVID-19 [10].
Our regression models, based on 7714 responses from the Russian general population, explain 43–44% of variability in suicidality risks measured according to the RASS scale. The following variables demonstrated significant, but with small effect size, linear relationships with current suicidality risk (placed by the descending effect size order): CES-D total score (depression level), age (A2), illicit drugs use in history (M3), reported depression in history (B5), history of alcohol use (M2), nightmares (L4), family conflicts (E3), use of hypnotics (L3), attitude towards to precautions’ effectiveness in preventing the spread of the COVID-19 (D3), number of people in household (A7), and recent changes in the need for emotional support and communication (E2 and E1). Also, the factors of history of mental disorders, number of children, marital status, current depression status, and absence of antipsychotics use in history demonstrated associations with current suicidality risks. This data supports previous findings that have been obtained both in Russia and internationally, and demonstrated the relationships between deaths from suicide and suicide attempts (not suicidality as a widely understood phenomenon itself) and factors of current depression, history of mental disorders (including depression), substance, illicit drugs, alcohol use, as well as socio-demographic (e.g., young age) and socio-psychological (e.g., family circumstances) factors [33, 43, 61, 63–65].
Thus, we found that the same factors which have been demonstrated to be related to the rates of committed suicides and suicidal attempts appear in our research in the context of the suicidality phenomenon, including self-harm and suicidal ideation within the items of the RASS scale. Recent meta-analysis of international studies also demonstrated similar findings, namely that suicidal ideation as a part of suicidal behavior was related to the factors of low social support, quarantine measures, loneliness, sleep disturbances, mental health problems, and poor somatic health during the COVID-19 pandemic [66].
Based on model beta coefficients, the variables of psychiatric history and current mental state have been identified as significant risk factors for a higher current suicidality risk, and that a higher severity of current depression (CES-D total score) was the strongest predictor of suicidality risk in the Russian population. Among mental disorders, depression and bipolar disorder have been ranked higher on the list of suicidality risk factors compared to other psychiatric disturbances. These findings are consistent with the general understanding that depression and bipolar depression are the most evident contributors to suicidal ideation and suicidality risks [61, 64]. It is an interesting fact that many studies indicate alcohol use to be a particular suicidal risk factor, particularly in the Russian Federation and in relation to alcohol overconsumption; whilst our results support this data, according to our sample analysis, alcohol misuse was outranked by the use of illicit psychoactive compounds [33, 65]. Consistent with international findings from many Asian studies we found that recent changes in certain other mental health-associated variables, such as the recent increase in suicidal thoughts, deterioration of sleep quality with the need to use sleeping pills, and having nightmares due to COVID-19-related pandemic contexts are also associated with higher current suicidality risks [10, 62, 67, 68]. In Russia, a hypnotics prescription is strictly supervised by psychiatrists. Given that depression and nightmares are stronger predictors of suicidality during the pandemic than the use of hypnotics, this means that the fact of the use of sleeping pills reflects a sequela of present mental disturbances.
The vast majority of previous studies indicated that the history of suicides and self-harm act as the strongest predictors of suicidal ideation [10]. Our study results support these findings, and, indeed, the factors of history of suicidal attempts and self-harm behavior were the strongest predictors, increasing the R2 of the model to 65%, but these variables have been removed from the analysis to avoid multicollinearity as far as these factors have been already incorporated into the RASS total score. It is interesting that subjective feelings about the recent change in melancholy (G21 — “How much has your emotional state related to the experience of joy or melancholy changed in comparison to before the COVID-19 epidemic?”) has not appeared among the risk factors for suicidality within the Russian population, although this question implied the detection of depression. In our opinion, the combination of these two findings, that the history of suicidal attempts and self-harm but not recent changes in melancholy, provide a significant input in the variability of suicidal risk may be explained by the habitual pattern completion of suicidal behavior in the form of learned impulsive reaction to life stressors, the “learned suicidality”, which reminds the phenomenon of learned helplessness [69].
With regard to socio-demographic factors, a review of suicidal behavior in Russia and the WHO statistics for the country indicate that men committed suicides 4.7 times more often than women did (43.6 vs. 9.1 per 100,000 population) [33, 58]. However, the number of suicide attempts was apparently higher among females [35, 36]. According to the most recent review about suicides in Russia, the number of suicide attempts increases with age, with its peak at 50 years old [33]. This data does not correspond to our results, which demonstrate that the total suicidality risk score does not differ between the sexes and is highest among the younger population. Nevertheless, these data are generally consistent with the rates of self-harm behavior in a number of international studies, and prominent suicidality risks among the youth both in Russia and abroad [8, 41, 42, 51, 70, 71]. These inconsistences in suicide attempts and suicidal risk distribution according to RASS score may indicate that these two phenomena are not necessarily linked. Single marital status was a weak risk factor for an increase in suicidality risk score, while being married was a protective factor against suicidal thoughts [33, 43]. Consistent with this, having no children, as opposed to having one or two children, and the factor of living with a smaller number of people in the household, were significant, but weak, risk factors for an increase in suicidality. These results may possibly be biased by the age factor. We found that a younger age was associated with an increased suicidality, which is similar to the findings of some studies, for example, from Japan, where youths less than 40 years old demonstrated a rise in suicidality risks during the COVID-19 pandemic [10, 72]. Moreover, a younger age corresponds to a lesser likelihood of being married and having children, which have been identified as risk factors for developing suicidality.
In a large study whose aim was to predict suicidal attempts in a foreseeable period of time using an ensemble of machine learning models, the highest-ranking variables were mental health disorders, recent suicidal thoughts and associated changes in behavior, a history of suicidal attempts, and use of psychotropic drugs. In general, the risk factors derived in our study are consistent with these predictors. However, it seems important that the set of these variables in the above study was obtained outside the pandemic context, whilst our study considered a period during the pandemic [73]. This would suggest that the pandemic did not introduce additional distorting factors into the risk profile of suicidal behavior.
Some other factors that were assessed in the context of the ongoing pandemic also predicted current suicidality. The recent increase in family conflicts during the pandemic lockdown, not believing that precautions can help to prevent the spread of the COVID-19 (D3), increased need for emotional support (E2), and decreased need for communication (E1) during the COVID-19 pandemic represented the main risk factors for suicidality. Indeed, family problems, family violence, lack of social support and home confinement during the pandemic have frequently been found to represent suicidal risk factors at the international level [10, 66, 74]. Thus, the monitoring of vulnerable focus groups, both for mental health and socio-psychological changes, is important to prevent increased suicidality in response to such major social stressors as the COVID-19 pandemic.
Our study has several limitations. First, it was an online survey, with inherent risks of bias in the results. Second, the projection of the results onto the entire Russian Federation population was based on the distribution of responses by age, gender, and the scale of settlement (rural or urban), but did not consider the region of Russia, ethnicity, education, or religious views that could have potentially affected the results. Another study limitation is that RASS, as the main tool of suicidality estimation, includes questions about the history of previous suicide attempts and self-harm episodes, which precluded the inclusion of these risks in our regression model.
In our study, we measured the suicide risk in the general population, and identified factors that associated with an increase or decrease in suicidality. These findings can serve as a basis for the development of suicide preventive strategies on the national level, and the key vulnerabilities detected in our study can help to ensure preventive measures are more focused on individuals with described suicidality risk factors.
CONCLUSIONS
According to the Risk Assessment Suicidality Scale data, at least, 20.68% and potentially up to 29.15%, of the Russian general population demonstrated increased risk of suicidality during the COVID-19 pandemic. Modelling the suicidality risks pointed to the key vulnerabilities related to the mental and behavioral disorders, such as (a) current severe depression and (b) a history of mental disorders, (c) bipolar disorder, (d) illicit drug and psychiatric compound (hypnotics) use, (e) alcohol misuse, and (f) highlighting a deterioration in sleep quality. Socio-demographic indicators such as (g) younger age (disregarding the gender factor), (h) single marital status, (i) having no children, (j) living with less people in the household, (k) recent increases in family conflicts, (l) increased need for emotional support, (m) decreased need for communication, and (n) not believing in precautionary measures to stop the spread of COVID-19, contributed to an increase in suicidality risks in the context of the pandemic.
Our findings point to the additional risk factors which should be considered when assessing suicidality risks in Russia.