In English
Introduction
ASD is a neurodevelopmental disorder characterized by impaired social int;eraction and the presence of repetitive behaviors and/or restricted interests. The heterogeneity of autism spectrum disorders (ASD) [Reinhold, 2005] stimulates neurodevelopmental research to explore the nature and mechanisms of different variants of the diagnoses, each of which requires to create its own variant for behavioral modification strategy in children. Statistical classification methods confirm the hypothesis regarding the heterogeneity of ASD groups and allow to divide them according to EEG features [Duffy, 2019; Luschekina, 2021; Luschekina, 2019]. This leads us to the assumption about different neurophysiological pathways manifesting in autism features in children [Duffy, 2019; Luschekina, 2021; Luschekina, 2019]. Many distinct pathways can be proposed for autistic features in different groups when comparing behavioral disabilities with EEG alterations in children [Sysoeva, 2023; Chan, 2024; Portnova, 2023a; Juarez-Martinez, 2023; 94].
Building on the premise that both EEG activity and behavioral tests accurately reflect key aspects of cognitive and social functions, we were able to identify children transitioning from classic symptoms of autism to a schizoid-type progression, distinguishing them from individuals with classic autism in the previous studies [Luschekina, 2021; Luschekina, 2019]. Particularly, we have demonstrated that children in these two groups exhibit distinct neurophysiological mechanisms manifesting in autism features, necessitating a different approach to behavioral modification [Luschekina, 2021; Luschekina, 2019].
A substantial cohort of children with genetically induced autistic disorderis those with Down syndrome (DS) [Bernad‐Ripoll, 2023]. DS is the leading genetic cause of intellectual disability, with an estimated prevalence of 8.27 per 1000 [Presson, 2013]. Up to 37% of children with DS exhibit autistic features and may have comorbid ASD diagnoses [Duffy, 2019]. DS represents the most prevalent genetic basis for intellectual disability, yet the pathophysiology of cognitive impairment in this syndrome remains unclear [Bonne, 2023]. Notably, a shared characteristic between DS and ASD is a disturbance of communication [Bray, 2016]. One of the proposed mechanisms contributing to neuropsychological disorders in DS involves dysfunction of the hippocampus, coupled with changes in the volume of the amygdala and hippocampus. Additionally, it is recognized that hippocampus-dependent spatial learning is impaired in DS [Bostelmann, 2020]. A specific volume reduction in subregions of the frontal lobe, temporal lobe, cerebellum, and hippocampus was described in children with DS [Hamner, 2018]. The role of the medial temporal memory system in Down syndrome was demonstrated using animal models [Clark, 2017]. Underconnectivity of short-range connections in DS, just like in ASD, was observed between all the distributed brain networks studied, with the strongest inter-network correlation found in subjects with the lowest performance IQ [Anderson, 2013].
In our work, we considered the question of the possible similarity of behavioral patterns and their psychophysiological correlates in DS and non-syndromic ASD. Previous research has demonstrated that the degree of impairment in social and cognitive processes in ASD is associated with the neuroanatomy and functional features of the brain [Duville, 2023; Portnova, 2023a]. The basis of this disruption is the altered redistribution of connections [Kurkin, 2023], which has a genetic nature, as indicated by previous studies [Sysoeva, 2023]. Previous studies also support findings of altered functional connectivity between large-scale brain networks in autism, distinguishing specific functional connectivity features between autism and attention deficit hyperactivity disorder [Yerys, 2019].
We assume that similar patterns can be identified in DS. Based on these assumptions, the study aimed to compare data from EEG analysis and psychodiagnostic to implement a comprehensive approach to identifying similarities and differences in the mechanisms of autistic features in ASD and DS. Despite the fact that numerous studies have been designated to show specific EEG alternation in DS and ASD, there is a lack of evidence comparing the EEG features of these two clinical groups. To our knowledge, only two articles have been reported regarding the EEG abnormalities of ASD, including DS participants [Portnova, 2023; Simashkova, 2006]. The longitudinal study [Portnova, 2023] compared the manifestations of psychosis in atypical autism, including Down syndrome, and showed that the psychopathological similarity of psychosis in various disorders correlates with the same type of changes in the EEG. Another study [Ribeiro, 2023] focused on the occurrence of epileptiform EEG abnormalities common to different ASD subgroups, including DS. By choosing the model of autistic characteristics of different developmental disorders, including idiopathic ASD and syndromic autism in DS, as the subject of the study, we aimed to elucidate a common symptom inherent in various syndromes at both the behavioral and electrophysiological levels, with the goal of establishing the neurophysiologic correlates of autistic features.
The objective of this study is to conduct a comparative analysis of behavioral and EEG patterns in children with non-syndromic ASD and children with DS accompanied by autistic features. Specifically, our research aims to investigate the extent to which the cognitive and social functioning of children with autism of different etiologies can be altered, and to identify the neurophysiologic correlates of these alterations through EEG measurements. Such findings may have essential implications for these children's behavioral modification strategies.
Methods
Participants
The study included right-handed boys aged from 4 years 5 months to 9 years. The control group comprised 36 neurotypical boys, with a mean age of 7.11 years and a standard deviation (SD) of 0.86 years. The ASD group consisted of children with non-syndromic (idiopathic) ASD, diagnosed as F84.0 according to the ICD-10. This group consisted of 39 boys, with a mean age of 6.24 years and a SD of 0.91 years. The third group consisted of 15 boys with DS, diagnosed as Q90 according to the ICD-10, with comorbid ASD symptoms. The mean age of this group was 7.2 years, with a SD of 0.94.
The children were recruited and preliminarily tested at the Federal Center for Support to Children with Autism Spectrum Disorders in Moscow. Inclusion criteria were the following: a diagnosis confirmed by a psychiatric examination in the Federal Center for Support to Children with Autism Spectrum Disorders in Moscow, depending on the study group; ASD symptoms in children with DS, no history of brain traumatic injury. For the control group, the inclusion criteria were the absence of any established developmental pathology, including developmental delay of unknown etiology, and no history of brain traumatic injury. Since only boys were recruited into the smaller group of children with DS during the timeline of the study, the remaining groups were also formed only from male children. Only those children who were able to understand and follow verbal instructions were included in the study, although this was only partially applicable to the clinical groups. The EEG recording procedure was conducted at the Pediatric Rehabilitation Center in Moscow.
G*Power software was used to calculate the required sample size (https://www.psychologie.hhu.de/arbeitsgruppen/allgemeine-psychologie-und-arbeitspsychologie/gpower). According to the analysis, a sample of 61 participants is required to detect a large effect of a between-factor (with the 95% power, 0.05 error probability, 3 groups) using one-way ANOVA. However, since the DS group was less than half the size of the other two groups, in this study we report findings with the power effect size > 0.7.
Ethical Statement
All procedures performed in studies involving human participants were in accordance with the ethical standards of the Russian Federation and the 1964 Helsinki Declaration and its later amendments or comparable ethical standards. All the preparation and equipment used are officially certified for clinical use. The parents or guardians of all children were given the Agreement for Participation in the Study and signed an informed consent. The study protocol was approved by the local ethics committee of the Institute of Higher Nervous Activity and Neurophysiology, Russian Academy of Sciences (Ethics protocol №2 on April 30th, 2020).
Behavioral Assessment
The DS and ASD children were further tested with the Psychoeducational Profile (PEP-2, PEP-3) [32, 23]. Method PEP includes the following parameters of the ability for learning: simple movement imitation, auditory and visual perception, fine motor skills, total motor abilities, eye—hand coordination, nonverbal and verbal intelligence, and overall development (the total scale of psychic development). The scores obtained in relation to age equivalents provided valuable insights into their cognitive development, and learning potential. These assessment tools played a vital role in identifying specific areas of strength and weakness, thus aiding in the development of individualized intervention strategies for these children. A psychodiagnostic study was conducted using a three-point system (1 point - inability to perform the task, 2 points - the task performed with the help, 3 points - independent performance of the task). Points for each of the parameters for each experimental group were summarized, and their ratio to age equivalent was calculated. Scores of children from the control group for each parameter were taken as 100% (number 1 in the schedule). By utilizing the PEP scales and the three-point system, researchers were able to objectively assess the various learning abilities of children with DS and ASD.
EEG recording and analysis
All recordings were obtained in the late morning before 1 p.m. During the experiments, children sat comfortably in an armchair, either unaccompanied or with the help of parents. They were asked to sit with their eyes open during the recording. EEGs were recorded during a 5-minute resting state using a 16-channel amplifier (“BrainsysNeiro-KM” “Statokin”, Moscow, Russia) with a band-pass filter of 0.3—75 Hz and a sampling rate of 256 Hz. A 50 Hz rejecting filter was additionally used. The 16 Ag/AgCl electrodes were placed according to the international 10—20 system at O2, O1, P4, P3, C4, C3, F3, F4, Fp2, Fp1, T5, T6, T3, T4, F7, and F8 positions. Linked electrodes at the ears served as the reference. Electrode impedances were kept below 5 kΩ.
Prior to spectral power (SP) analysis of each recording was digitally filtered at range 2-75 Hz. Continuous EEG recordings were segmented into epochs of 4 seconds for further analysis. Epochs containing muscle and/or eye movement artifacts were discarded manually. After artifact rejection, 120-second periods of EEG data, equivalent to 30 4-second epochs, were used for spectral power analysis for each participant. Logarithm Power Spectra (LnSP) was computed by applying the fast Fourier transform (FFT). The spectral power (SP) was calculated for the following bands: theta: 3,5—7,5 Hz, alpha: 7,5—13 Hz, beta 1: 14-20 Hz, beta 2: 20—30 Hz, total beta: 14—30 Hz and gamma-1: 30—45 Hz.
Statistical Analysis
Between-group age and PEP differences were compared by the Mann-Whitney test. The significance of the differences between the EEG parameters was detected with a One-way ANOVA, with the group factor, in the general linear model for each electrode and for each EEG frequency band. These frequency bands included theta, alpha, beta-1, beta-2, total beta, and gamma-1, and the three groups of children analyzed were the control group (typically developing children), children with Down syndrome (referred to as the ”DS“ group), and boys with autism spectrum disorders (referred to as the "ASD" group). Post-hoc analysis using the Scheffe-test was conducted within the three groups to account for multiple comparisons in the ANOVA.
For the parametric statistical measurement of natural logarithm spectral power (LnSP) with an examination of equality of variances, the Benjamini-Yecutieli procedure was employed for multiple comparisons or multiple testing (MT) correction. However, due to some of the LnSP EEG band data not following a normal distribution, as determined by the Shapiro-Wilk test, a non-parametric Mann-Whitney test with Bonferroni correction for multiple comparisons was additionally conducted to reevaluate the obtained statistical results. All statistical analyses were performed in Statistica 13.0 software (Statsoft.com)
Results
Behavioral assessment results
The groups did not significantly differ in age (p> 0.05). Various parameters of behavior, including imitation, perception, fine motor skills, and visual-motor coordination, were examined within the DS and ASD groups. The DS group exhibited higher scores in these parameters compared to the ASD group, or in some cases, demonstrated similar results. No significant differences were observed between the DS and ASD groups when assessing the total scale of behavior development according to PEP (Figure 1).
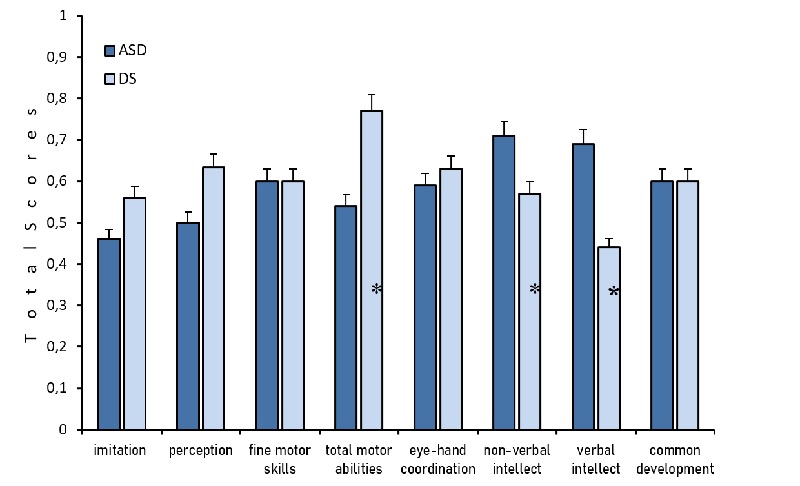
Fig.1. PEP scales values as compared with controls in two groups of children: ASD (blue color) and DS (light blue). (*) marked significant differences for t-test atp<0.05. Ordinate total scores. The control age indicators are taken as a unit, and the indicators of the experimental groups are compared with the norm taken as a unit.
EEG results
Comparison of three groups
One-way ANOVA for 3 groups when using the hypothesis of about three groups mean equality (H0: m1=m2=m3) revealed significant differences in 3 bands: theta, alpha, beta, and gamma-1 band (Tab.1.). Significant for three groups within 4 bands were observed but not in all electrodes (Fig.2). So, we apply paired tests for differences to compare our groups with controls and with each other.
Table 1.
Fisher's F for ANOVA Logarithm Power Spectra Ln(SP)
|
Bands\Electrodes |
FFp1 |
FFp2 |
FF7 |
FF8 |
FF3 |
FF4 |
TC3 |
CC4 |
|
3.5-7.5Hz |
90.58 |
50.47 |
17.19 |
15.49 |
10.30 |
22.26 |
13.06 |
12.73 |
|
8-13Hz |
00.00 |
00.00 |
50.60 |
00.00 |
00.00 |
30.60 |
00.00 |
00.00 |
|
14-30Hz |
30.98 |
00.00 |
15.24 |
60.83 |
10.03 |
16.77 |
10.34 |
60.58 |
|
30-45Hz |
60.33 |
30.26 |
50.59 |
80.08 |
50.44 |
60.12 |
70.53 |
50.81 |
|
Bands\Electrodes |
CT3 |
CT4 |
TT5 |
TT6 |
PP3 |
PP4 |
OO1 |
OO2 |
|
3.5-7.5Hz |
90.34 |
11.13 |
90.33 |
10.40 |
00.00 |
50.20 |
00.00 |
00.00 |
|
8-13Hz |
00.00 |
00.00 |
00.00 |
00.00 |
50.59 |
60.38 |
11.99 |
16.42 |
|
14-30Hz |
60.43 |
60.84 |
12.41 |
10.01 |
00.00 |
30.55 |
40.67 |
60.69 |
|
30-45Hz |
60.54 |
40.02 |
30.26 |
30.82 |
00.00 |
00.00 |
00.00 |
50.16 |
Notes: Insignificant values (p>0.05) are equated to zero. Degrees of freedom (2, 48); p<0.05, F>3.2
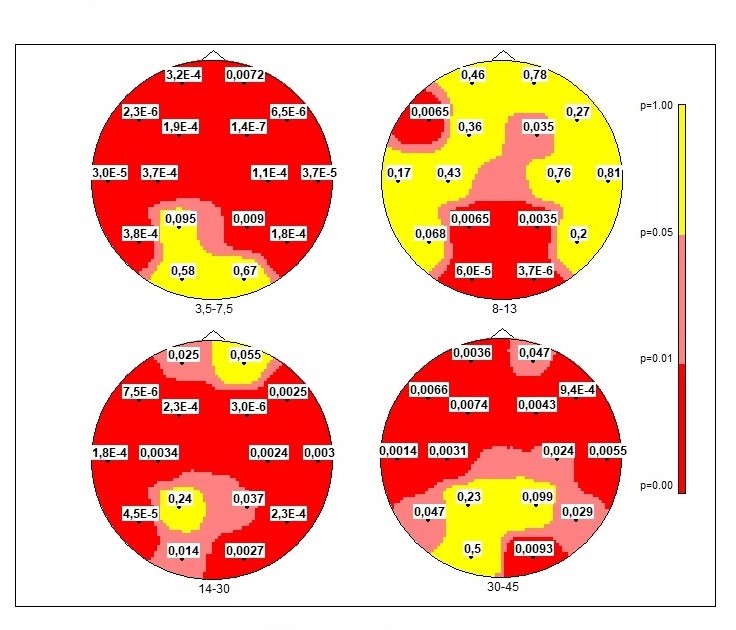
Fig2. Distribution maps of uncorrected significance levels “p” (H0: m1=m2=m3) of Logarithm Power Spectra LnSP for 3 groups of children. One-way ANOVA. Red colors — higher reliability (0.001 < p < 0.05); yellow — nonreliable values.
Comparison of DS group with the control group
SP of theta rhythm shows significant between-group differences mainly at the anterior part of the cortex (except Fp2). LnSPof the theta waves has higher values in the DS group than in typically developed boys. Maps for t-test and Mann-Whitney test merely coincide. Scheffe test gives full coincidence except O1-O2.SP of the occipital alpha rhythm in the DS group has lower values as compared to the group of typically developing children (Figure 3).
In addition, t-test shows the following significant difference with the following p-values: for P3 p = 0.004; P4 p = 0.006; O1 p < 0,001; O2 p < 0,001 and Scheffe test gives for T5 p = 0.042; P3 p < 0,001; P4 p < 0,001; O1 p < 0,00; O2 p < 0,001. Mann-Whitney test: for P3 p = 0.036; P4 p = 0.014; O1 p < 0,001; O2 p < 0,001. In all tests p-values at O1 and O2 passed the MT threshold < 7e-4.
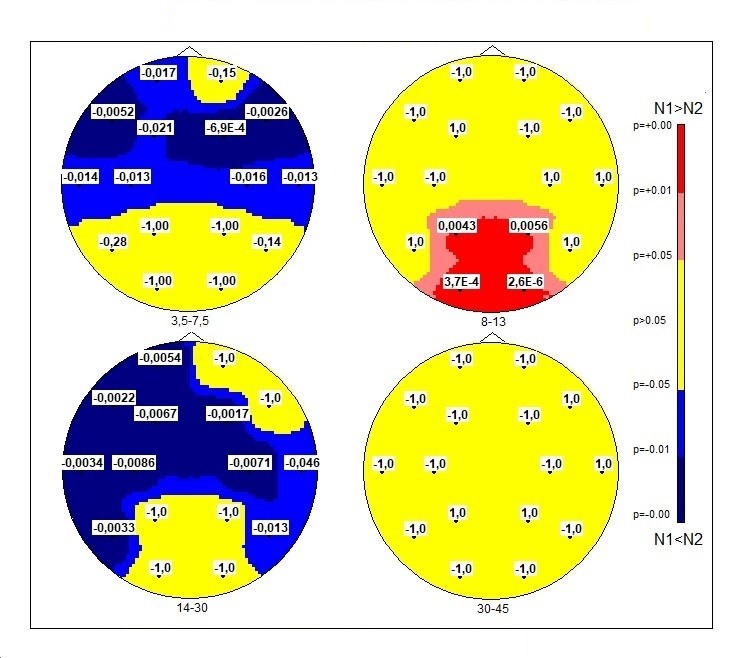
Fig. 3. Topographic distributions of significance levels according to the scheme of 16 electrodes topography of two averaged samples N1 - “control” and N2 - DS-group in Student’s t-test. The MT correction gives p-value < 7E-4. P-values differences (N1-N2) are displayed at each point of the map. Blue color, LnSP in the test group was higher than in controls; red color, LnSP in the test group was lower than in controls.
When comparing the DS group with the controls an increase in SP beta rhythms was observed (except for O1-O2; P3-P4; Fp2, F8) (Figure 3). Differences of SP in gamma-1: t-test and Mann-Whitney test with MT correction were not revealed (Figure 3); Scheffe test: differences in F7, F4, C4, O2, where DSSP values were higher than in the control group.
DS and ASD groups comparison
When comparing the DS group with ASD group, differences in SP theta and alpha activity in the any electrodes were not observed (Figure 4). As compared to ASD group, DS group revealed lower levels of high-frequency oscillations (beta-2 and gamma-1) in mostly anterior part of registered zones with reliable p- values (Figure 4).
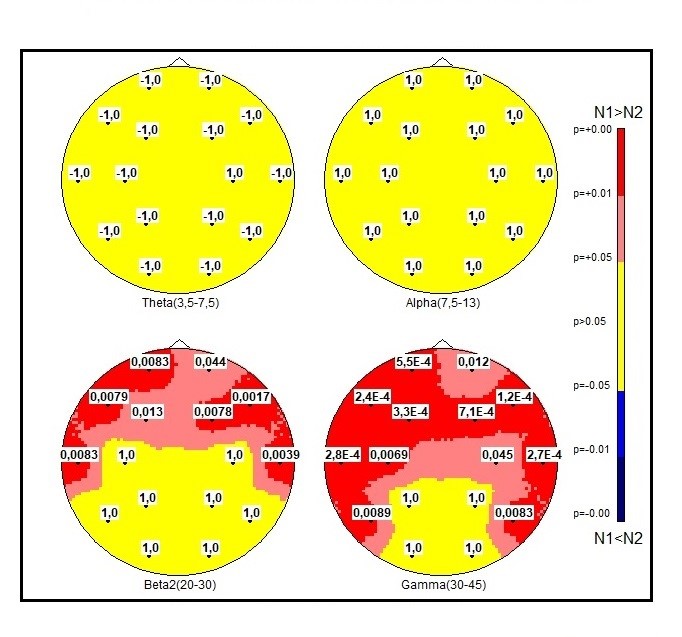
Fig.4. Comparison of 2 samples of EEG for significant levels in ASD and DS groups with Fisher checking for equality of variances. Significance level p with sign (N1-N2). The MT correction gives p-value< 0.001.
Discussion
The aim of this study was to compare groups with DS and non-syndromic ASD in terms of psychoeducational profile and its EEG correlates. The study results support the previous finding implying that phenomenological manifestations at the level of behavior should be associated with specific functional brain features in these developmental disorders [Hamner, 2018; Portnova, 2023; Sysoeva, 2023]. Both DS and ASD groups showed differences in SP of EEG bands as compared with neurotypical children. This partially reproduces previous data on an alteration of EEG patterns in ASD [Bosl, 2018; Li, 2024].
The present analysis of the alpha rhythm in different subgroups of DS and autistic children shows a reduction in alpha power in the posterior regions compared to typically developed children. Most studies consistently reported suppressed alpha oscillations in various brain states in DS [for review see: 30] and ASD [for meta-analysis see: 24] children compared to typically developing (TD) peers. In our study, this characteristic was also common to both groups, reflecting an increased baseline cortical activation in children with DS as well as ASD. This decrease in activation may be the reason for the decline in total development, planning, and control functions in both groups compared to typically developed children.
We have also observed an increase in theta-activity in anterior areas in the DS group of children compared to the controls. This data may be regarded as “hypofrontality” typical for the schizoid type in adults [Garakh, 2015]. Hypofrontality has also been described in children with schizotypal disorders just like in ASD children with a schizotypal picture for early development, but not for autistic ones [Luschekina, 2019]. The features of the theta rhythm in healthy individuals reflect the level of cortical activation: the higher the theta activity in the frontal regions, the greater the activation of neural networks associated with memory encoding and emotional arousal [Duville, 2023]. Possibly, the increase in theta rhythm in DS is the source of a decline in control functions.
The study underscores the pivotal role of changes in high-frequency rhythms, relative to the controls, in both ASD and DS. However, the impairments identified in each of these conditions exhibit distinct characteristics. The background EEG in the SD group is marked by a significant increase in beta activity, suggesting a deficit in inhibition processes [Gorbachevskaya, 2018].
By comparing the functional peculiarities in ASD and DS with their potential neurophysiologic basis, one might infer that the reduction in spectral power of the alpha-rhythm and hypofrontality could be considered a shared mechanism of disorders, leading to a decline in control functions in both phenomena. An increase in spectral power in the gamma band, hindering the performance of cognitive tasks, is a distinctive feature of patients with ASD but not DS. Additionally, beta rhythm exhibits more pronounced changes in ln SP in ASD compared to the pair DS - ASD. In DS, it appears that the mechanisms underlying the development of cognitive function are associated more with changes in beta activity than in gamma activity. Thus, the changes in bioelectric activity in children with Down syndrome only partially overlap with the alterations found in patients with ASD.
Cognitive representation and verbal development yielded the poorest results in our study, aligning with the findings of Bostelmann et al. [Bostelmann, 2020]. A similar specific pattern for individuals with DS, including impairments in receptive language, was described using the Social Responsiveness Scale [Meneghetti, 2020]. Nonverbal cognition in the DS group seems to be less impaired than verbal cognition. Comparable data on the relative typical development of non-verbal intelligence compared to verbal intelligence were observed in situations of home orientation in DS children when verbal instructions were given [Bostelmann, 2020].
In our research, various parameters, including imitation, perception, fine motor skills, and visual-motor coordination, were examined within the DS and ASD groups. The DS group exhibited higher scores in these parameters compared to the ASD group, or in some cases, demonstrated similar results. This observation aligns with existing data indicating more pronounced impairments in ASD as opposed to DS [Channell, 2015]. When assessing the overall PEP scale scores, no significant differences were observed between the Down syndrome and ASD groups. However, the between-group distinctions emerge when analyzing subscales such as perception, total motor abilities, and verbal and non-verbal intellect. Nevertheless, overall differences compared to the controls for both DS and ASD groups were not immediately apparent. The identification of nuanced differences between the two groups became possible only by employing additional subscales, which is crucial for the development of correction procedures.
The critical question requiring further investigation pertains to the correlations between neurophysiological and behavioral factors in DS and ASD groups, an issue yet to be conclusively addressed. Nevertheless, the present study indicates spectral power changes for different frequency bands, with beta alterations noted in the DS group and gamma alterations in the ASD group [Luschekina, 2019]. Previous data [Anderson, 2013] establishing the relationships between altered brain activity patterns (i.e., Spectral Power) in DS syndrome and IQ scores serve as inspiration for ongoing investigations.
Limitations
The study is constrained by a relatively small sample size and a notable disparity in participant numbers among the three studied groups, which may limit the broader implications of the findings.Another limitation of the study concerns the lack of normal distribution of children of different genders in the groups since only boys participated in the study.Nevertheless, we regard the obtained results as preliminary, with the intention of drawing attention to the realm of neurodevelopmental disorders and identifying specific EEG markers of DSnon-syndromic ASD.
Conclusion
The changes in bioelectric activity, specifically the increased spectral power of theta predominantly in the frontal area and the spectral power reduction in the occipital alpha band, observed in children with Down syndrome, are partially similar to changes found in children with ASD and appear more pronounced in the DS group. One of the most distinctive EEG characteristics of DS is the increase in beta rhythm spectral power compared to the typically developing children. At the behavioral level, both verbal and non-verbal intelligence are impaired, with more pronounced effects observed in the DS group compared to the ASD group.