Introduction
In the current digital era, students are required to have a new form of academic literacy, namely academic digital literacy, which can effectively assist them in completing their academic assignments. Not only does traditional academic literacy matter, but academic digital literacy also helps students learn faster and complete their assignments [Ebiefung, 2021; Singh, 2020; Abbas, 2019]. In other words, academic literacy in today's all-digital educational environment is very important for students in the form of mastery of digital literacy that supports their academics.
Academic digital literacy is needed by every student because it is an important aspect of functioning successfully in an academic environment, such as the ability to read, write, research, and communicate. This involves high-level reading and writing skills, critical thinking, articulate writing, and discipline-specific skills for reading and writing [Mulcahy-Ernt, 2018; Pala, 2021].
Several research findings reveal that digital literacy, self-control, and learning motivation predict academic achievement. Apart from that, digital literacy also contributes to increasing academic success, improving research skills, and boosting self-confidence [Abbas, 2019; Pala, 2021; Shariman T.P, 2012].
The results of the research explain that metacognitive knowledge, resource management, and motivational beliefs have a significant positive influence on digital literacy [Anthonysamy, 2020]. A systematic literature mapping study by analyzing 298 articles published in two databases, Scopus and Web of Science (WoS), shows that the largest proportion of articles were found in Scopus with the most frequently mentioned topic being digital pedagogy. This provides a perspective on digital transformation studies in higher education, particularly related to academic digital literacy [Farias-Gaytan, 2021].
Students nowadays can also be called "Generation Z" who cannot be separated from their digital life. The characteristics of Generation Z as "digital natives" are already very comfortable using digital devices such as smartphones, iPads, and laptops in their online social lives. Although students overall are comfortable with technology for social interaction in the virtual world, they are still learning how to incorporate digital devices into their academic lives [Caverly, 2019].
Therefore, it is important to adapt the academic digital literacy scale measurement tool for college students so that it can be used to determine students' abilities in mastering digital technology in completing their academic tasks.
Academic digital literacy
Digital literacy is defined as the ability and awareness of using digital technology to perform tasks while demonstrating the right attitude in a learning environment by utilizing digital technology [Ng, 2012]. Following the model developed by [Ng, 2012], digital literacy includes cognitive, technical, and socio-emotional learning perspectives."
Digital literacy has also been identified as a key competency because it can be considered the 'backbone' of current educational pedagogy, as it plays an important role in the world of education. Digital literacy significantly increases the employability of graduates because it empowers them to achieve more in the digital economy. In fact, even in the world of work, 90% of jobs require excellent digital literacy competencies [Anthonysamy, 2020; Parera, 2016].
Digital literacy is the ability to read and understand information in the form of hypertext or multimedia. It is different from traditional literacy because digital sources can produce various forms of information, including text, images, sound, and other formats [Acarturk, 2018; Işık, 2021; Prihandoko, 2021; Rafi, 2019; Zaborova, 2021]. Based on this explanation, it can be concluded that academic digital literacy is the ability and awareness to use digital technology as a learning resource and complete academic tasks in the correct manner, encompassing cognitive, technical, and socio-emotional dimensions.
Factors influencing academic digital literacy
Digital literacy is influenced by several factors including; 1) use of online media, 2) academic achievement 3) role of parents or family, 4) intensity of reading [Kuo N.-C, 2016; McDougall, 2018]. Digital literacy skills are influenced by many factors, but the most important according to [Phuapan, 2016] is related to the drive or desire of individuals to understand digital literacy by reading and applying it.
Research results from Rosalina found that there are three factors that affect the level of students' digital literacy competence, including: 1) Environmental support factors consisting of the campus environment and family roles, 2) Socioeconomic conditions factors, which include individual financial conditions and the criticality of the media, and 3) The intensity factor of media use, which includes the use of digital media in daily activities and the completion of academic assignments [Rosalina, 2021].
Thus, the main factor that can affect digital literacy skills in using technology is a skill that needs to be honed with daily activities. This emphasizes that the ability is a continuous process that is carried out consistently in the utilization and use of digital technology in literacy [Kaufman, 2010; Syah, 2019].
Academic digital literacy dimension
The dimensions of digital literacy are the same as the model developed by [Ng, 2012] that digital literacy has three dimensions as shown in Figure 1 below.

Figure 1. Dimensions of digital literacy
The cognitive dimension of digital literacy relates to the ability to think critically when searching, evaluating, and creating digital information handling cycles. It also means being able to evaluate and select appropriate software programs to study or perform a particular task. This dimension of digital literacy requires individuals to have knowledge of related ethical, moral, and legal issues, and understand content that uses digitally based resources (e.g., copyright and plagiarism). This dimension involves the ability to intelligently navigate through a hypermedia environment to construct knowledge and synthesize new understandings using appropriate digital tools, which will understand and find meaning in the best sense [Ng, 2012]. Thus, the cognitive dimension is the ability to choose technology, search, assess, and select information using critical thinking skills.
The technical dimension generally means having technical and operational skills to use. This dimension can be applied to learning and daily activities. It involves being able to connect and use input devices and peripherals such as earphones/headsets, external speakers, smartboards, and more. This assumes knowledge of working parts, file protection, and the ability to solve problems by reading manuals or via the "Help" function and other web-based resources, such as YouTube or other digital media. A digitally savvy individual should be able to adequately operate technology by understanding file structure, managing data transfer, including understanding file size and space required for storage, finding, downloading and installing applications, and uninstalling them when not needed. They should know how to use infrared and/or Bluetooth for mobile devices, understand data charges associated with downloading data, set up and use communication tools and social networks, update/change user account information on the Internet, send and retrieve attachments via email and/or Dropbox, and open them with a suitable application, such as opening a folder, and know about the main features of software programs [Ng, 2012]. Thus, this dimension is a major component of digital literacy, which includes the skills needed to operate digital technology for learning.
The social-emotional dimension involves the ability to use the Internet responsibly to communicate, socialize, and learn by observing through the application of rules. Such rules, similar to face-to-face communication, require respect and the use of appropriate language and words to avoid misinterpretation and misunderstanding. One should maintain safety and privacy and keep personal information as confidential as possible, not disclosing more personal information than necessary. One should also understand when a threat is received and know how to deal with it, such as whether to ignore, report, or respond to it [Ng, 2012]. Thus, this socio-emotional dimension relates to individual behavior in the use of digital technology.
Academic digital literacy measurement
Measurements of digital literacy have been developed according to research objectives and contexts, and based on certain theories. The measurement of digital literacy was first developed by [Ng, 2012] with three dimensions, namely technical, cognitive, and social-emotional.
Pala and Başıbüyük research to determine digital literacy skills uses a digital literacy scale measurement based on the four dimensions they developed, namely information processing, communication, security and problem solving [Pala, 2021]. Nabhan to measure digital literacy using digital academic writing skill questionnaires which he developed consists of several dimensions, namely critical thinking, online safety skills, digital culture, collaboration and creativity, finding information, communication, and functional skills [Nabhan, 2021]
Mercado in his research, he used qualitative case studies to explore academic digital literacy skills. This involved conducting semi-structured interviews and collating data from various sources, such as digital academic notes, informal conversations with facilitators, online activities on institutional platforms, interactions with research seminar facilitators, supervisors, and researchers, as well as drafts and final versions of academic manuscripts [Mercado, 2021]. Anthonysamy [Anthonysamy, 2020] using a digital literacy scale in the form of a likert scale with a three-dimensional structure based on the instruments used by [Ng, 2012] and [Parera, 2016] [Parera, 2016] consisting of technical (6 items), cognitive (2 items), and social-emotional (2 items) to measure the use of technology in learning for students at the University of Auckland New Zealand.
In addition, the digital literacy scale instrument has also been adapted to various countries and one of them was adapted by [Ustundag, 2017] into Turkish as many as 10 items based on the digital literacy scale developed by [Ng, 2012], the item scale factor loading varies between 0.46 - 0.74 and the Cronbach Alpha reliability is 0.86. BurçinHamutoğlu also adapted a digital literacy scale for college students with an internal consistency coefficient (Cronbach Alpha) for the technical dimension = 0.88, the cognitive dimension = 0.89, and the social-emotional dimension = 0.79. [BurçinHamutoğlu, 2017].
Esfandiari [Esfandiari, 2020] and Işık [Işık, 2021] to determine the level of digital literacy using the digital literacy scale from the model [Ng, 2012]. Durak and Seferoğlu [Durak, 2020] in their research also used the digital literacy scale from [Ng, 2012] model which was adapted by [BurçinHamutoğlu, 2017]. Thus, referring to the study of previous research results, it is recommended to measure academic digital literacy using digital literacy scale instruments based on the dimensions of the [Ng, 2012]. This is because the dimensions are the most appropriate for psychological variables and have been adapted to many countries. The digital literacy scale instrument consists of dimensions that can be scored individually or combined for a total score.
Method
The Ethics Commission of Research of the Faculty of Psychology at the University of Muhammadiyah Malang has approved the study (approval number for research ethics: E.6.m/161/FPsi-UMM/III/2023). The authors have assured the participants that their study data would be presented anonymously, and the participants have agreed in writing to participate.
Participants
The participants of this research were second, fourth, and sixth-semester students who had a GPA ≥ 2.00 and were currently studying at public and private universities in East Java, Indonesia, totaling 364 respondents during May 2023. There were 283 female respondents and 81 male respondents, making a total of 364 students.
Adaptation procedure
The process of adapting measuring instruments in this study begins with a request for permission from the owner of the measuring instrument. The measuring instrument adaptation procedure in this study refers to [Beaton, 2000] as shown in Figure 2 below.
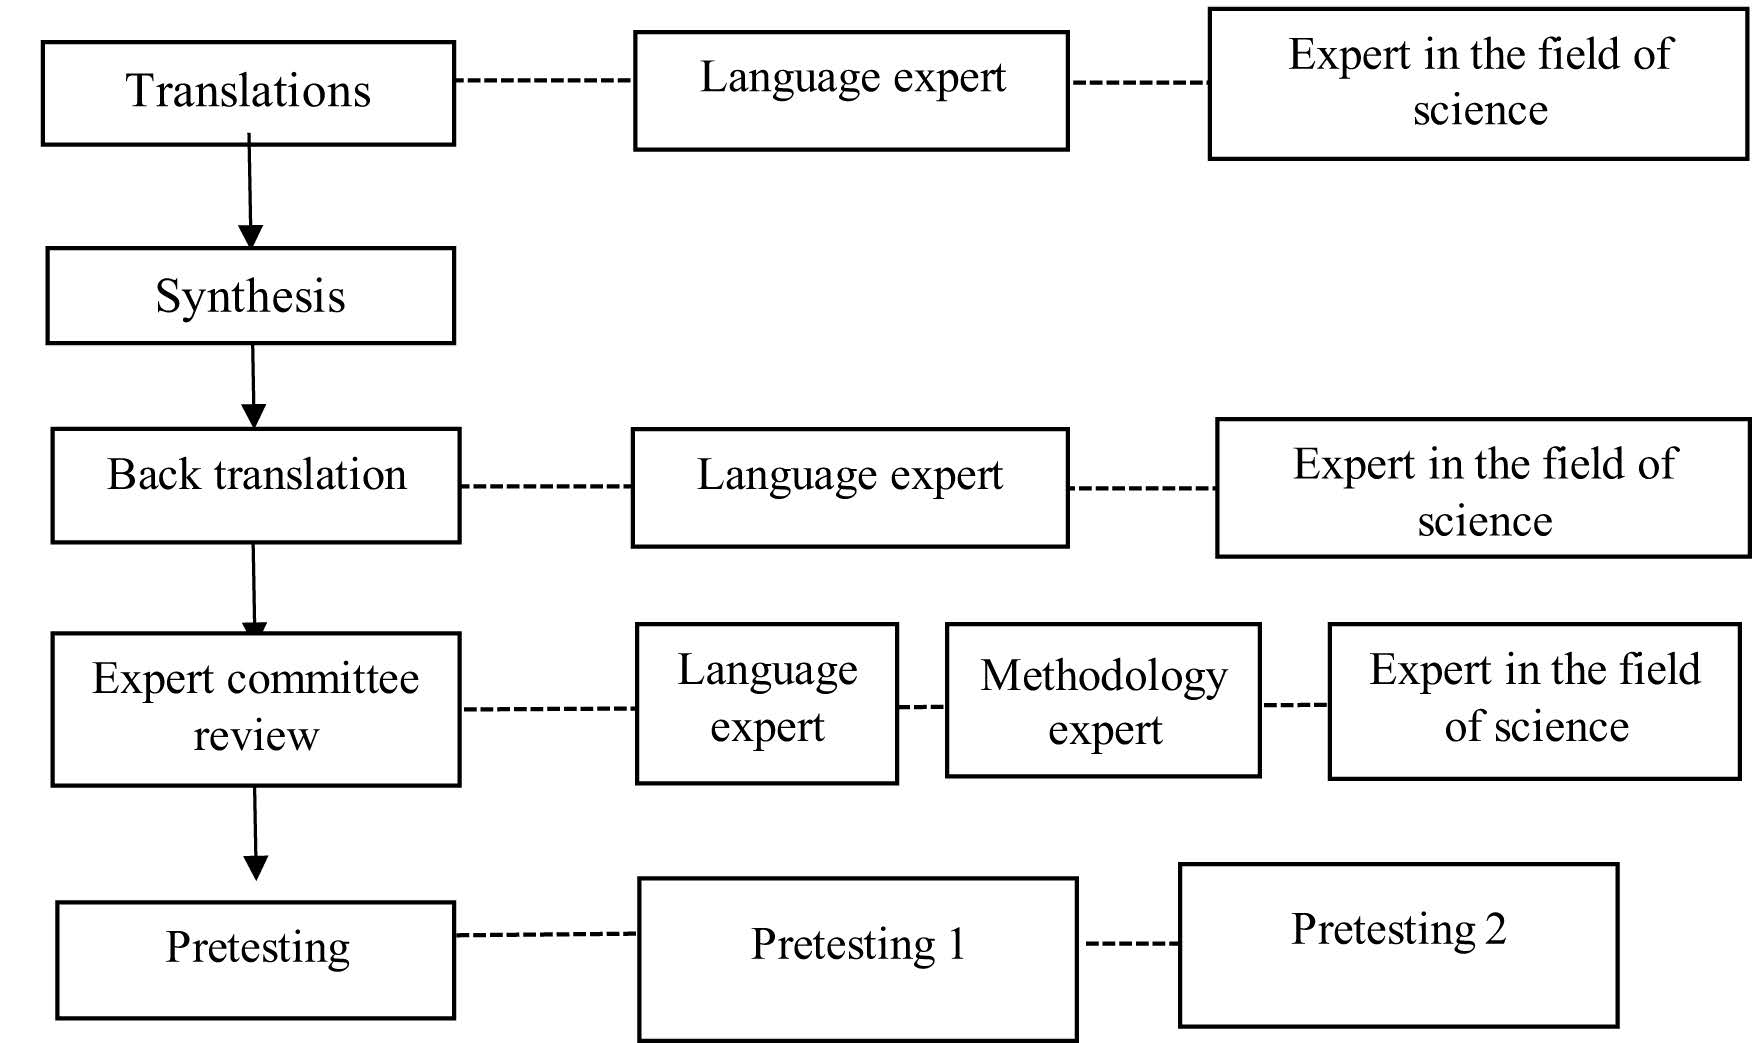
Figure 2. Procedure for adapting an academic digital literacy scale
From Figure 2 it can be described the adaptation procedure according to the stages. The first stage involves translations by two linguists and experts in the field of educational psychology who graduated abroad and understand the context of measuring instruments for Indonesian students. The translations are done through the language center at the University of Muhammadiyah Malang. The second stage is synthesis, where the results of the translations from both translators are brought together to find similarities and differences until an agreed-upon translation is obtained. This translation is referred to as the draft translation measuring instrument scale. The third stage involves back translation and juxtaposition with the original measurement tool to find differences in meaning so that the meaning can be adjusted. The back translation is done by linguists and experts in the field of educational psychology who are foreign graduates and understand the context of measuring instruments through the language center at the University of Muhammadiyah Malang.
The fourth stage, the expert committee review, is to ensure that there is suitability in the meaning and sociocultural context between the original measuring instrument and the translated measuring instrument. The reviewers who comprised the expert committee consisted of linguists, methodologists, and educational psychologists, totaling five experts. The five experts were asked to provide assessments and corrections for improvements to ensure whether the adapted instruments prepared were equivalent in measuring constructs and suitability for the cultural context of students in Indonesia. The results of the assessment from the five experts were then quantified using Aiken's V formula. The results of the analysis using Aiken's formula from the five experts on each academic digital literacy scale instrument item obtained a minimum value of the Aiken's V index ranging from 0.81 to 0.94 with a minimum criterion of 0.040 based on the Aiken table (P > 0.05%). Thus, it can be concluded that all instrument items can be declared valid or equivalent in measuring the academic digital literacy scale construct in students in the context of Indonesian culture.
The fifth stage, pretesting, is to test the measuring instrument on a small number of subjects beforehand to find out whether the measuring instrument is well understood by the subjects or not. If the measuring instrument can be understood, then a trial is carried out with a larger number of subjects. Testing the measuring instrument on a small scale was done by giving it to 40 students as a pilot test to determine whether the instructions and statements on each item could be understood properly before being tested on a large scale. Based on the results of the small-scale trials on the pilot tests that were conducted, it is known that the respondents stated that the instructions were easy to understand, and the items of all scales were also clear and well-understood. Thus, they were able to proceed with trials of measuring instruments on a large scale. The testing of the measuring instruments on a large scale was done by collecting data from 364 students to test their validity and reliability using CFA analysis.
Data analysis
Data analysis used Confirmatory Factor Analysis (CFA) with the help of M-Plus software, which gave rise to fit index values in the form of Chi-Square, RMSEA, CFI, TLI, and SRMR [30. Wang, 2019]. According to [31. Kline, 2016], what must be reported in the fit model analysis are the Chi-Square, RMSEA, CFI, and SRMR tests.
Results and Discussion
Based on the final modeling results from the CFA analysis that has been carried out in the form of the results of the fit model from the model feasibility parameters from the academic digital literacy scale as in table 1 below.
Table 1.
The final results of the fit model based on the feasibility parameters of the academic digital literacy scale model (N=364).
|
Fit parameters |
Output |
Criteria |
Information |
|
Root mean square error of approximation (RMSEA) |
0,07 |
≤ 0,08 |
Fit |
|
Standardized root mean square residual (SRMR) |
0,04 |
< 0,08 |
Fit |
|
Comparative fit index (CFI) |
0,95 |
≥ 0,90 |
Fit |
|
Tucker-Lewis Index (TLI) |
0,93 |
≥ 0,90 |
Fit |
Based on table 1 it is known that the output value of RMSEA = 0.07, SRMR = 0.04, CFI = 0.95, and TLI = 0.93 according to the criteria so that it fulfills the feasibility parameters of the model fit (goodness of fit) which means there is no difference measurements developed with empirical models or those models obtain data support. While the index in the form of Chi Square (P-Value) = 0.00 does not meet the criteria ≥ 0.05 so it is not fit, but can be ignored because the respondents or samples are large.
The results of the reliability test for this scale use Cronbach's Alpha and the Construct reliability (CR) value and the Average variance extracted (AVE) value. Following are the results of the confirmatory factor analysis of the results of the validity and reliability tests as in table 2 below.
Table 2.
Validity and reliability of the academic digital literacy scale (N=364)
|
No |
Dimensions |
Item |
Factor Loading |
Alpha |
CR |
AVE |
|||
|
1 |
Technical |
adl1 |
0,47 |
0,83 |
0,87 |
0,83 |
0,89 |
0,46 |
0,74 |
|
adl2 |
0,65 |
||||||||
|
adl3 |
0,72 |
||||||||
|
adl4 |
0,71 |
||||||||
|
adl5 |
0,72 |
||||||||
|
adl6 |
0,76 |
||||||||
|
2 |
Cognitive
|
adl7 |
0,76 |
0,64 |
0,64 |
0,48 |
|||
|
adl8 |
0,62 |
||||||||
|
3 |
Socio-Emotional |
adl9 |
0,87 |
0,72 |
0,73 |
0,58 |
|||
|
adl10 |
0,64 |
||||||||
Figure 3. Final model of the academic digital literacy scale
From table 2 and figure 3 it is known that the loading factor values range from 0.47 - 0.87 and have met the minimum criteria of construct validity. Meanwhile, the reliability indicated by the value alpha = 0.87 and CR = 0.89 met the minimum criteria so that the scale was reliable, while the AVE = 0.74 met the minimum criteria so that it indicated a good convergent.
Academic digital literacy is measured using a digital literacy scale from [Ng, 2012] as many as ten items (academic digital literacy scale, see appendix) developed by researchers in an academic context based on technical, cognitive, and social-emotional dimensions. The blue print of the academic digital literacy scale before and after the try out is as shown in table 3 below.
Table 3.
Blue print of academic digital literacy scale
|
No |
Dimensions |
No. Item |
|
|
Before try out |
After try out |
||
|
1. |
Technical |
1, 2, 3, 4, 5, 6 |
1, 2, 3, 4, 5, 6 |
|
2. |
Cognitive |
7, 8 |
7, 8 |
|
3. |
Social-emosional |
9, 10 |
9, 10 |
|
|
Total item |
10 |
10 |
The construct validity of this research is based on internal structure evidence analyzed through CFA, as explained by the American Education Research Association (AERA) that construct validity can be demonstrated through five pieces of evidence, namely 1) test content, 2) cognitive/response test, 3) internal structure, 4) relations to other variables, and 5) consequences of tenting [AERA. Standards for, 2018]. The CFA test was carried out to determine the feasibility of the model and the size of the factor loading of each item as evidence of construct validity based on the internal structure. The overall model feasibility parameters are as described by [Hu, 1999; 31. Kline, 2016; Hoyle, 2012] as follows:
Table 4.
Model feasibility parameters
|
No |
Fit parameters |
Kriteria |
|
|
Absolute Fit |
|
|
1 |
Chi square P-Value |
≥0,05 |
|
2 |
Goodness of fit index (GFI) |
≥0,90 |
|
3 |
Root mean square error of approximation (RMSEA) |
≤ 0,08 |
|
4 |
Normed fit index (NFI) |
≥0,90 |
|
5 |
Standardized root mean square residual (SRMR) |
< 0,08 |
|
|
Incremental Fit |
|
|
6 |
Comparative fit index (CFI) |
≥ 0,90 |
|
7 |
Tucker-Lewis Index (TLI) |
≥ 0,90 |
|
8 |
Adjusted goodness of fit index (AGFI) |
≥0,90 |
|
|
Parsimonius Fit |
|
|
9 |
Parsimonious Normal Fit Index (PNFI) |
0,60 – 0,90 |
A model can be said to be feasible if it fulfills one of the feasibility parameters of the model and it will be better if it fulfills more than one model feasibility parameter. According to [Hair, 2019] if 4 – 5 parameters are met, the model is considered sufficient to assess the feasibility of a model. After fulfilling the feasibility parameters of the model, then it can be seen the size of the factor loading or factor loading of the CFA. Factor loading with a value between 0.4 – 0.6 is categorized as sufficient validity and if the factor loading value ≤ 0.7 is categorized as high validity. However, if all items in one indicator are used up or do not represent the factor loading value it can be lowered to a value of 0.30 to 0.40 provided that the subject is at least 250 respondents [Hair, 2011].
In addition, to determine the reliability or consistency of the instrument, an instrument reliability test was carried out. Instrument reliability relates to the instrument's ability to consistently measure instrument attributes [DeVon, 2007]. Instrument reliability in this study was measured by calculating composite reliability or construct reliability (CR), and Average Variance Extracted (AVE) was used to determine how large the indicator size described its theoretical latent construct.
Hair explains that the calculation of CR is the square of the total value (sum) of standard loading divided by the square of the total standard loading value plus the sum error value. Meanwhile, the AVE calculation is the sum (total) squared value of the standard loading divided by the sum of the squared standards of loading plus the sum error value [Hair, 2019].
The reliability of a construct is said to be good if the CR value ≥ 0.70, but if the CR value is in the range of 0.60 - 0.70, then reliability is still in the good category. While the AVE value is more than 0.50 which is a good measure of reliability, but this AVE is usually an option (optional) in research [Hair, 2019; Davey, 2010; McDonald, 2002].
This study aims to adapt the digital literacy scale to Indonesian in an academic context and to determine the validity and reliability of the construct to suit Indonesian culture. This scale consists of 10 items and three dimensions (table 2). All of these scale items meet the minimum criteria so that this instrument can be declared valid and reliable and meets the standards for adapting measuring instruments and measuring psychometric properties, so this instrument is suitable for use in Indonesia.