Introduction
Smartphones, an integral component of modern life, merge telephony with the functionalities of personal computers
[Chen, 2018; Pinho, 2021]. Currently, active mobile subscriptions surpass the global population count
[Hao, 2020; Konok, 2017], rendering smartphones one of the most pervasive and transformative technological advancements. Their ubiquity has significantly altered social, economic, and political landscapes. Their accessibility and social acceptance have transformed smartphones into "social objects"
[Engeström, 1999], deeply embedding them in all facets of life and intensifying users' physical and emotional reliance. Despite their benefits, a study by Parasuraman et al. (2017)
[Parasuraman, 2017] highlights a concerning trend: over 50% of users would continue smartphone use despite its adverse effects on their daily lives. This finding is pivotal in understanding the escalating issue of problematic smartphone use (PSU).
Our research contributes to the discourse on PSU, specifically examining the scarcely explored nexus between PSU and offline sexual inactivity among adults. To our knowledge, this is the inaugural study investigating this relationship in a European Union member state (Hungary) with a semi-peripheral economy.
PSU research is emergent, with the conceptualization of PSU itself continuously evolving [Horwood, 2018; Nahas, 2018]. Broadly, PSU is defined as a compulsive smartphone usage pattern causing negative consequences and impairing daily functionality [Hao, 2020; Lepp, 2016]. This compulsive use denotes an uncontrollable overuse, akin to maladaptive addiction [Chen, 2016]. Recognized as a non-substance addiction, smartphone addiction encompasses an individual's compulsion to engage in this activity despite detrimental effects on their health, mental state, or social life [Ayar, 2017]. Thus, PSU is interpreted as a primarily behavioral addiction [Billieux, 2012], leading to uncontrollable and excessive smartphone use [Bae, 2017; Li, 2017].
In examining problematic smartphone use, our study navigates through various theoretical frameworks, notably including compensatory internet use theory
[Hong, 2019], which suggests individuals use the internet to offset offline dissatisfactions, and extended self-theory
[Clayton, 2015], positing smartphones as extensions of the user’s identity. Attachment theory
[Eichenberg, 2019] explores emotional bonds with devices, while the person-affect-cognition-execution model
[Brand, 2019] and technology acceptance model
[Horwood, 2018] detail the cognitive and affective reasons behind smartphone use continuation despite negative consequences.
Central to our investigation is the social and cognitive behavioral theory highlighted by Chen et al. (2016) and Kim et al. (2018)
[Chen, 2016; Kim, 2018], framing PSU not as an addiction to the device but to the online behaviors it enables. This theory is supported by Király and Demetrovics (2021)
[Király O.,, 2021] and further expanded by Ferrante and Venuleo (2021)
[Ferrante, 2021], who link maladaptive cognitions to psychopathology, fostering PSU. This theory directly informs our study’s focus on the relationship between PSU and offline sexual inactivity, suggesting that the cycle of maladaptive cognitions and behavioral reinforcements plays a key role in understanding PSU’s impact on sexual behavior.
There is no consensus in academia on defining 'problematic' mobile phone use. Billieux (2012) [Billieux, 2012] highlights the ambiguity, questioning if it should be based on usage amount, patterns, or negative outcomes. Horwood and Anglim (2018) [Horwood, 2018] consider use 'problematic' when it's uncontrollable and impairs daily functioning. Some researchers, however, link smartphone addiction to usage duration [Chotpitayasunondh, 2016; Gao; Kwon, 2014]. Our study adopts a usage pattern-based definition, aligning with social and cognitive behavioral theory for a nuanced understanding.
Research identifies multiple factors influencing PSU, including demographics, user emotions, psychosocial and personality traits
[Hong F.-Y; Horwood, 2018; Lee, 2008], and technical aspects like app availability and smartphone features
[Aljomaa, 2016; Nahas, 2018]. Age is a significant demographic factor, with younger individuals more prone to PSU
[De-Sola, 2017; Nahas, 2018]. Gender differences in PSU are mixed, with some studies finding higher prevalence among women
[Nahas, 2018]. Earlier studies linked high education to PSU, but later research shows inconsistent results
[Ayar, 2017; Barnes, 2019; Kwon, 2016].
The literature extensively addresses the common consequences of PSU, such as potential physical health decline
[Horwood, 2018], emergence of emotional and mental health issues
[Kuhn, 2016], reduced quality of life
[Thomee, 2010], diminished productivity and time management
[Rozgonjuk, 2018; Steelman, 2017], sleep disturbances
[Turel, 2015], family conflicts
[Hartanto, 2016], anxiety
[Harwood, 2014], and depression
[Kumcagiz, 2016].
The literature shows varying opinions on the predictive power and direction of factors leading to PSU. Some studies suggest preexisting mental disorders might lead to PSU as a coping mechanism, rather than being a result of it
[Elhai, 2016]. Loneliness, too, is seen as a possible cause of PSU, as individuals use smartphones to connect with others
[Lapointe, 2013]. Establishing causality in PSU is complex due to its co-occurrence with emotional or health issues like depression, anxiety, anger, stress
[De-Sola, 2017; Panda, 2018], social relationship problems
[Ihm, 2018], and other addictions
[Sapacz, 2016]. Our study uses both homogeneous and heterogeneous identification estimators and machine learning to better understand these causal relationships.
In summary, problematic smartphone use impacts emotional health more than physical health [Panda, 2018; Thomee, 2010]. While PSU's predictors and consequences are well-studied, its relation to sexuality and intimacy is less explored. Research mainly focuses on adolescent sexual behavior within technology-mediated sexual interaction (TMSI) [Courtice, 2017], with significant attention on sexting. Approximately 50% of young adults in developed countries engage in sexting [Dodaj, 2020], and TMSI is more common in adults than adolescents [Benotsch, 2012]. There is also an established link between sexting and actual offline sexual activity [Ferguson, 2011], indicating a merging of online and offline behaviors. This area represents a crucial, yet under-investigated aspect of PSU, especially its connection with sexual behavior and intimacy.
The literature agrees that sexual relationships and satisfaction are key to health and well-being
[Starrs, 2018; Wellings, 2019]. Sexual engagement enhances life satisfaction and happiness
[Kahneman, 2004; Schmiedeberg, 2017] and reduces stress through oxytocin release
[Carmichael, 1987]. However, there's increasing evidence of rising sexual inactivity in Western societies. In the U.S., a decline in sexual activity was observed from 2002 to 2018, particularly among 18 to 24-year-old men and adults aged 25 to 44
[Beutel, 2016; Ueda, 2020]. European trends mirror this, with Germany seeing increased sexual inactivity across all age groups from 2005 to 2016
[Beutel, 2016], and Great Britain experiencing a plateau among 16 to 44-year-olds
[Mercer, 2013]. Italy reported a 26,9% drop in sexual activity between 2019 and 2020
[Amerio, 2021]. In Hungary, a 2017 survey revealed that 20% of 18 to 49-year-olds were sexually inactive, with activity decreasing with age
[Meskó, 2023].
Sexual inactivity is influenced by various sociodemographic, behavioral, and psychological factors
[Dupree, 2016]. A clear difference exists between employment statuses: part-time workers and the unemployed are more often sexually inactive than full-time workers, indicating a link between lower income and increased sexual inactivity
[Kim, 2017; Wellings, 2013]. Stress and mental health issues also correlate strongly with sexual inactivity
[Bodenmann].
To understand the decline in sexual activity, the norm theory offers insight, attributing it to changing sexual norms
[Bodenmann; Wellings, 2013]. It posits that online pornography prevalence, extended working hours, stress from modern lifestyles, and reduced leisure time are factors reducing the frequency of intimate relationships
[Bodenmann; Twenge, 2016].
While existing literature discusses how smartphone use has diversified adult sexual practices [Rissel, 2014], it largely omits the direct link between PSU and offline sexual activity, despite the rising trend of sexual inactivity in Western societies. Our research aims to bridge this gap, exploring the connection between PSU and offline sexuality in adults. This inquiry falls within "psychotechnology" [Eleuteri, 2017], a field poised to enhance our understanding of PSU and the behavioral shifts leading to sexual inactivity. By investigating this underexamined intersection, our study endeavors to shed light on the intricate dynamics of human behavior in the context of digital advancements.
Our study unfolds as follows: Firstly, we outline our research problem, specific questions, and hypotheses. Next, in the methodology section, we detail the data used and explain the homogeneous and heterogeneous identification algorithms, along with the random forest method applied in our analysis. Following this, the results section presents our findings and hypothesis validation. The study concludes with a summary, suggesting future research directions in this area. We also explore the practical implications of our findings, emphasizing their real-world applicability.
Research question and hypotheses based on exploratory data analysis
The global prevalence of mobile phone usage is substantial, with over two-thirds of the world's population (67,1%) using these devices. As of early 2023, there were 5,31 billion unique mobile phone users, a number that has seen exponential growth in recent years
[Parasuraman, 2017]. Our study focuses on Hungary, a European Union member state with a semi-peripheral economy. This choice is justified by Hungary's high internet and mobile phone penetration rates. In 2023, Hungary had 9,19 million internet users, equating to an 89,7% internet penetration rate, and 11,34 million inhabitants with mobile connections, surpassing the total population at a rate of 110,7%
[We Are Social, 2023]. When compared to the average figures across the European Union, Hungary's statistics align closely. The EU averages an internet penetration of 91,5% (with a standard deviation of ± 4,8 and mobile connectivity of 111,2% (standard deviation of ± 3,2)
[We Are Social, 2023]. These similarities suggest that Hungary is a representative case for smartphone usage within the European Union. Additionally, as highlighted in the previous section, Hungary exhibits sexual activity trends comparable to those in the EU. The country's relatively small population size also makes it a more feasible and favorable location for conducting representative research compared to larger EU member states, facilitating more efficient data collection.
Our study utilizes a nationally representative 2023 sample from Hungary, focusing on in-depth aspects of smartphone usage. We explored various dimensions including economic, sociodemographic factors, usage patterns, and addiction-related issues. A key element of our data collection was the "Sex or Phone" variable, assessing respondents' preference between mobile phone use and sexual intercourse. This innovative measure aimed to gauge individual attachment to smartphones. The reliability of this variable was notably high, as indicated by a Cronbach's alpha of 0,99. The distribution and analysis of this variable are detailed in Table 1.
The findings from Table 1 were unexpectedly revealing for two reasons. Firstly, sexuality-related inquiries usually face high refusal rates due to their sensitive nature, leading to methodological issues like skewed representativeness and reliability [Amerio, 2021; Ueda, 2020]. Secondly, self-reported data on sexual behaviors are inherently limited by subjectivity, recall inaccuracies, and response distortions [Ueda, 2020]. These issues can introduce biases, affecting the study's validity and generalizability. However, the high response rate and the robust reliability indicated by a Cronbach's alpha score demonstrate that our research successfully gathered pertinent data on this delicate topic. The results, therefore, offer valuable insights into the complex relationship between technology use and personal behaviors.
Table 1
Percentage and distribution of responses to the Sex or Phone question
|
Sex Or Phone
|
Description of the variable’s categories
|
Frequency
|
Frequency Percentage
|
|
No Sex
|
I would rather give up sex for 12 months just to use my smartphone
|
401
|
44,53%
|
|
No Phone
|
I would rather give up my smartphone, but I can't live without sex for 12 months
|
500
|
55,47%
|
|
Total
|
901
|
100%
|
The results in Table 1 of our study are striking for two key reasons. Firstly, there was an unexpected lack of refusals to the question comparing mobile phone use to sexual activity, despite the typically sensitive nature of such topics. This divergence from usual high refusal rates in similar studies is significant. Secondly, the responses were remarkably evenly split: about 44,53% of respondents preferred using their mobile phones over offline sexual activity, while 55,47% favored sexual intercourse over mobile phone use. This near-even distribution highlights the profound influence of mobile phones, with a substantial portion of individuals placing them on par with, or even above, essential human experiences like sexuality. These findings offer deep insights into the intricate relationship between human behavior, technology use, and lifestyle priorities, illustrating how integral smartphones have become in our daily lives.
Our study's intriguing results prompted a deeper exploration of the link between PSU and sexual activity. Aligning with the methodological trend of exploratory data analysis, recognized for revealing new insights within datasets
[Kwon, 2016; Rozza, 2011], our approach was key in spotting emerging patterns and trends, fostering new scientific discoveries. While acknowledging the importance of research on offline sexual inactivity for understanding PSU, our analysis primarily centered on the socio-economic status of respondents, alongside their mobile phone use and addiction patterns. This focus meant that psychological and attitudinal factors, crucial in PSU research, weren't our primary data collection targets. This limits the scope of our research questions and hypotheses regarding PSU.
Thus, our central research question is: "What socio-economic and mobile phone usage factors are determinants of problematic smartphone use in relation to offline sexual inactivity?" This question led to the development of specific hypotheses for our study, focusing on identifying key socio-economic and usage-related factors that influence PSU and its connection to offline sexual behavior.
H1: Renunciation of offline sexual activity due to PSU is widespread primarily among young, middle-class respondents living mainly in large cities, in the case of a European Union member country characterized by a semi-peripheral economy.
H2: Renunciation of sexual activity due to smartphone use is more likely to be measured among problematic smartphone users in the case of a European Union member state characterized by a semi-peripheral economy.
H3: PSU can predict offline sexual inactivity more strongly than socioeconomic variables, in the case of a European Union member state characterized by a semi-peripheral economy.
Methodology
Our study utilized data from a telephone survey conducted in 2023. We employed a multi-stage random stratified sampling method to form a sample of 1,005 individuals. This sampling technique ensured that our sample was representative of the Hungarian adult population over 18 years of age, taking into account factors such as gender, education, income level, and type of settlement. The survey design achieved a 95% confidence level with a 3% margin of error. It's important to note that our data is based on self-reports, including the measurement of mobile phone use. While self-reported data is a commonly accepted method in research, it's also recognized in the literature that such data can be prone to systematic distortions
[Krumpal, 2013; Reuver, 2015].
[Ali, 2019] This is particularly true when compared to data collected based on 'actual' mobile usage
[Yook, 2019]. Despite these potential limitations, we believe that self-reported data collection is more congruent with the social and cognitive behavioral theory framework. This theory emphasizes the importance of individuals' perceptions and experiences, which are more directly captured through self-reporting. Hence, while acknowledging the limitations inherent in self-report data, we maintain that this method provides valuable insights relevant to our study's focus on problematic smartphone use and its association with offline sexual inactivity.
After a rigorous filtering and data cleaning process, which included removing constant variables and duplicates, we analyzed data from 901 individuals across 141 variables. A notable challenge was the high proportion of missing values, representing 128 cases or 10,2% of our dataset. This led us to carefully choose an appropriate data imputation method, for which we selected the K-Nearest Neighbors (KNN) algorithm. KNN was chosen because it assumes missing data is Missing Completely at Random (MCAR), meaning the missingness is independent of both observed and unobserved data [Heitjan, 1996]. KNN's ability to handle both numerical and categorical variables was crucial given our dataset's composition, and its optimization for small to medium-sized databases made it ideal for our research [Ali, 2019].
After imputation and further data cleaning, our final dataset consisted of 122 variables, covering socio-economic factors like age, income, settlement type, marital status, education, and household size. It also included basic contextual variables related to smartphone use such as usage duration, app download frequency, app payment, and number of apps used. Moreover, our database incorporated 94 variables specifically measuring smartphone use and addiction, divided into five categories: 1) app usage purposes, 2) phone use frequency, 3) preference for computer or mobile phone for various activities, 4) online shopping habits, and 5) usage of other smart technologies. This comprehensive dataset provided a robust foundation for our analysis.
For our study's dimension reduction, we utilized two cutting-edge identity estimators: the Two Nearest Neighbors (TWO-NN) and the Heterogeneous Identification Algorithm (HIDALGO), recently introduced in the literature
[Denti, 2021]. These algorithms, forefront in dimension reduction techniques, are probability-based and use nearest-neighbor distances' theoretical properties. Their advantage lies in accurately identifying a 'desired' or 'true' identifier (ID) for effective clustering. This enables representation of a dataset's complexity on a high-dimensional space surface, optimizing data point differentiation
[Lee, 2017; Tenenbaum, 2000]. They excel in capturing the latent dimension of a nonlinear population within a high-dimensional space, focusing on the intrinsic or real dimension (ID). The ID is the minimal number of parameters needed to represent data without significant loss
[Ansuini, 2019; Rozza, 2011]. The generated K (or P) should be seen as the upper limit of active clusters, ensuring a reliable and stable cluster structure
[Sullivan, 2021]. Applying these advanced dimension reduction methods allowed us to refine our dataset into a more manageable and analytically robust form, setting the stage for precise and insightful data analysis. Both algorithms permit the implementation of a trimming process to remove extreme observations if outliers distort the estimate
[Denti, 2021]. For our study, we employed the Rand index-based partition stability, a bootstrap method, to determine the ideal number of clusters
[Sullivan, 2021].
For our analysis, we employed the Random Forest (RF) algorithm, a machine learning approach developed by Leo Breiman
[Breiman, 2017], renowned for its effectiveness in datasets with a high ratio of variables to observations
[Ploton, 2020]. RF is particularly suitable for managing complex interaction structures, handling highly correlated variables, and accommodating nonlinear associations
[Boulesteix, 2012; Cheng, 2020], which aligns well with the complexities of our dataset. To evaluate our RF model, we used optimized predictions, classification accuracy, and the kappa statistic
[Cohen, 1960; Kuhn].
[Aljomaa, 2016] This methodology allowed for a nuanced and precise analysis, enhancing the reliability and depth of our findings by effectively handling the intricate interdependencies and nonlinear relationships within our dataset.
In our research, the Random Forest (RF) method served two primary functions: first, to develop a prediction rule, and second, to assess and rank predictor variables using Variable Importance Measures (VIM). VIM is particularly effective at identifying predictors involved in interactions, those that predict the analyzed variable in combination with others [Goldstein, 2010; Malley, 2011]. However, it's crucial to recognize that VIM rankings are generated irrespective of the overall utility of all predictors in the prediction problem.
The combination of TWO-NN, HIDALGO, and Random Forest algorithms harnesses each algorithm's unique strengths, enabling a more thorough and nuanced analysis. Such an integrative approach is instrumental in unraveling the intricate relationship between problematic smartphone use and offline sexual activity, making the most of the latest methodological advancements in the field. This synergy of advanced algorithms offers a robust framework for our analysis, enhancing our ability to interpret complex data patterns and contributing significantly to the field of psychotechnology.
Data analyzes were performed using R version 4.2.2
[R Core Team] in the Rstudio environment
[Posit team RStudio, 2023]. We performed our dimensionality reduction analysis with the intRinsic package, which enables the implementation of both TWO-NN and HIDALGO
[Denti, 2021] estimators. The ClustOfVar package was used to calculate the Rand index
[Chavent], and Random Forest modeling was performed with the caret package
[Kuhn, 2016].
Results
In the exploration of the correlation between problematic smartphone usage and offline sexual inactivity, a comprehensive examination of the participants' demographic backgrounds and smartphone usage behaviors stands as a fundamental step. As illustrated in ‘Demographic and Smartphone Usage Profile of Respondents’, our analysis encompasses a wide range of variables including average smartphone usage, app download frequency, social media engagement, household size, monthly net income, educational attainment, gender distribution, and preferences regarding smartphone usage over offline sexual activities.
Table 2
Demographic and Smartphone Usage Profile of Respondents
|
Variable
|
Mean
|
Std Dev
|
Min
|
25%
|
50%
|
75%
|
Max
|
|
Use Mobile Phone
|
0,993
|
0,083
|
0
|
1
|
1
|
1
|
1
|
|
How Long Use Smartphone
|
7,616
|
1,081
|
1
|
8
|
8
|
8
|
8
|
|
How Often Download Apps
|
1,351
|
0,928
|
0
|
1
|
1
|
2
|
4
|
|
Use Apps for Socialmedia
|
0,770
|
0,421
|
0
|
1
|
1
|
1
|
1
|
|
Household Size
|
2,626
|
1,114
|
1
|
2
|
2
|
3
|
7
|
|
Monthly Net Income
|
5,500
|
1,882
|
1
|
5
|
5
|
6
|
12
|
|
Education Categhory
|
3,286
|
0,800
|
1
|
3
|
3
|
4
|
4
|
|
Sex (Male, Female)
|
1,542
|
0,498
|
1
|
1
|
2
|
2
|
2
|
|
Sex Or Phone
|
1,599
|
0,490
|
1
|
1
|
2
|
2
|
2
|
Key findings from table 2 indicate a near-universal smartphone usage (99,3%) among participants, underscoring the pervasive nature of these devices in modern society. The data reveals an average of 7,6 years of smartphone use, suggesting a long-term engagement with these devices. Interestingly, the frequency of downloading new apps is relatively low (mean = 1,351), pointing towards a stable usage pattern rather than constant exploration of new applications.
The demographic information unveils a varied sample with an average household size of 2,626 and a monthly net income averaging at 5,5 on the study's scale, hinting at a middle-income bracket. The education category mean of 3,286 suggests a medium level of education among participants, with a nearly balanced gender distribution (54,2% female). Regarding the pivotal "SexOrPhone" variable, the slight majority (55,47%) expressed a preference for sexual activity over smartphone use, revealing a complex relationship between digital device engagement and personal relationships.
This detailed profile is instrumental in understanding the nuanced interplay between individual characteristics, socio-economic factors, and the reliance on smartphones. The data suggests that while a significant portion of individuals prioritize smartphone usage, there remains a strong contingent valuing offline sexual engagement. These observations reflect diverse priorities and the potential impact of socio-economic status on PSU and sexual inactivity, setting the stage for a deeper analysis of how these factors manifest in the day-to-day smartphone usage patterns of individuals.
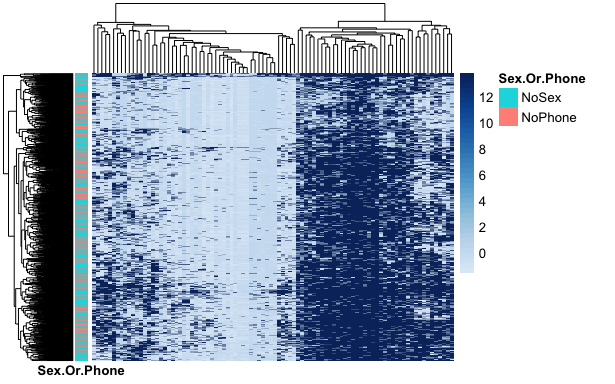
Our investigative journey into the entwined realms of smartphone usage and offline sexual activity began with an in-depth demographic assessment. This critical step informed our granular examination of specific smartphone usage patterns captured by 94 distinct variables. Meticulously organized into five thematic categories via a comprehensive questionnaire, these variables underwent a rigorous dimension reduction process. The hierarchical cluster analysis we employed distilled this wealth of information, yielding actionable insights into individual behaviors and preferences.
Upon visualizing the outcomes of this hierarchical cluster analysis through a heat map (Figure 1), a nuanced narrative emerged from the log data values. Despite the apparent division of the dataset into two primary clusters, no distinct structure immediately surfaced. This initial finding hinted at the complexity hidden within the smartphone usage behaviors of our participants, signaling that the mere frequency of usage and preference for smartphones over offline sexual activities could not be straightforwardly categorized.
Fig. 1. Heat Map of Annotated Log Data Values of Hierarchical Cluster Analysis (N = 901)
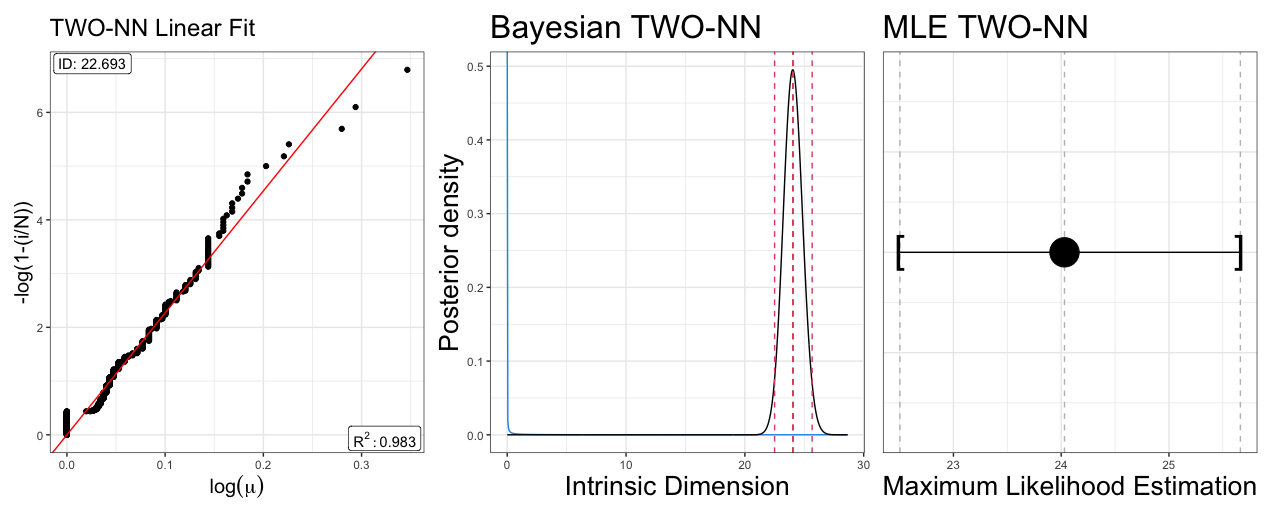
Delving deeper, we engaged the TWO-NN algorithm to seek out the hidden patterns masked by the superficial clustering. The outcome of this sophisticated modeling is depicted in Table 3 and further illustrated in Fig. 2, unraveling the representation of our dataset through a unique, homogeneous global identifier (ID). Intriguingly, all estimators converged on a similar range, suggesting a reduction of the 94 variables to a core set of 22 to 25, capturing over 95% of the variance within our participants' smartphone interactions. This condensation of variables into a smaller set did not diminish the depth of our insights; rather, it illuminated the robust yet subtle psychological constructs driving PSU.
Table 3
TWO-NN model estimates using least squares estimation (Linfit), Bayes estimation (Bayes) and maximum likelihood estimation (MLE) (total observations N = 901, used observations
(N = 895)
|
Analysis
|
Lower_Bound
|
Estimate
|
Upper_Bound
|
Mean
|
Median
|
Mode
|
|
Linfit
|
22,498
|
22,640
|
22,889
|
|
|
|
|
Bayes
|
22,503
|
NE
|
25,662
|
24,057
|
24,048
|
24,030
|
|
MLE
|
22,504
|
24,031
|
25,663
|
|
|
|
NE: Not Estimable
Linfit: Trimming proportion: 1%, ID estimates (confidence level: 0,95)
bayes: Trimming proportion: 1%, Prior d ~ Gamma (0,001; 0,001), Credible Interval quantiles: 2,5%, 97,5%
MLE: Trimming proportion: 1%, ID estimates (confidence level: 0,95)
Fig. 2. Plots of TWO-NN Model estimations
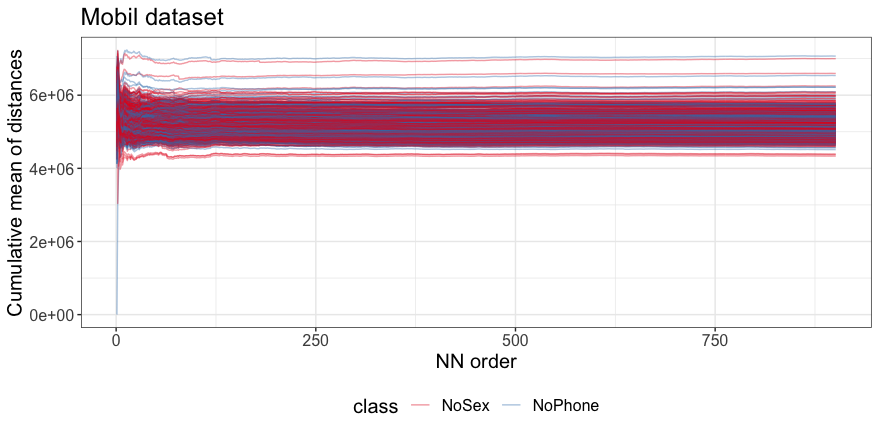
Confronted with minor discrepancies among the different estimators, our inquiry did not cease. We embarked on an exploration of the average distances between nearest neighbors across our dataset, depicted in Figure 3. The analysis revealed the TWO-NN algorithm's limitations in accounting for abrupt changes in ergodic means, a clear indication of inhomogeneities within our data that begged for further scrutiny.
Fig. 3. Cumulative means of Distances
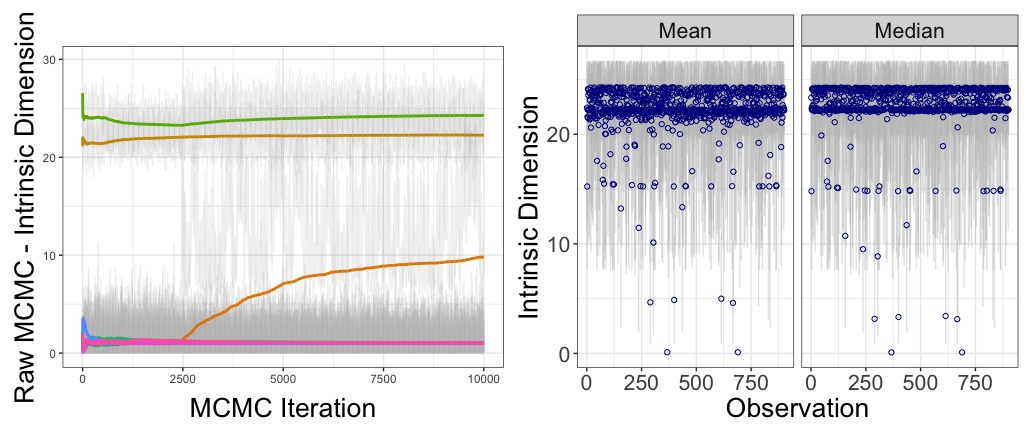
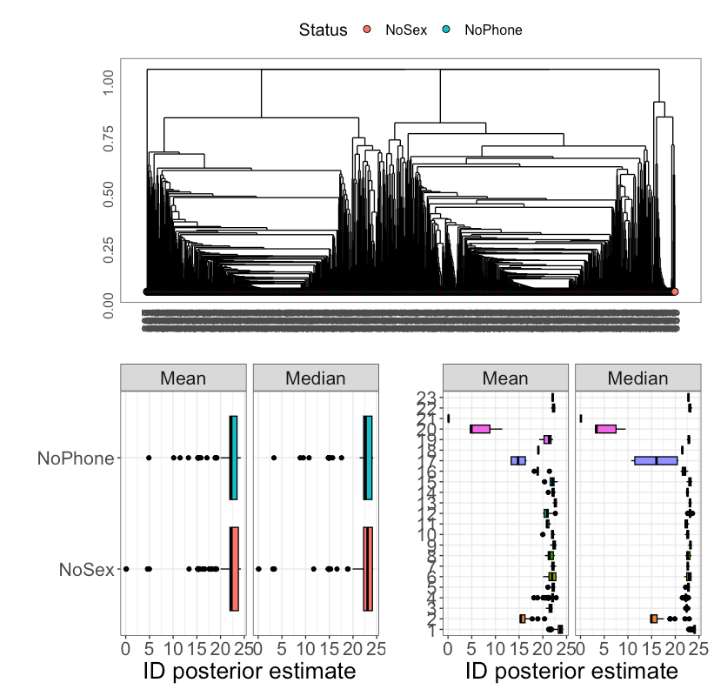
To encapsulate the diversity of the underlying structures, we applied the HIDALGO algorithm. Eschewing data truncation due to the substantial dimensionality, we refined our analysis parameters to accurately represent the multifaceted nature of our dataset. This approach brought us to the heart of the psychological content: the heterogeneous ID numbers derived illuminated a complex web of factors influencing PSU and sexual inactivity. Figure 4 embodies this comprehensive analysis,
juxtaposing trace plots with observation-specific ID means and medians, marked by credible intervals.
Fig. 4. 'Raw' MCMC and Point Estimates of HIDALGO Analysis
Table 4
Heterogeneous ID estimation of the 94 variables based on the Sex or Phone variable
|
class
|
mean
|
median
|
sd
|
|
No Sex
|
23,177
|
23,027
|
2,634
|
|
No Phone
|
23,363
|
23,064
|
2,559
|
The emergent patterns from our HIDALGO analysis, detailed in Table 4, affirmed that our respondents exhibit a rich spectrum of PSU behaviors, ranging from high-frequency individual use to social interactions mediated through smartphones. The two subpartitions identified, P23_1 and P23_3, encapsulate distinct dimensions of PSU. P23_1 pertains to individual usage, marked by intensive engagement such as nightly usage and a preference for gaming and online shopping. Conversely, P23_3 captures the social fabric of PSU, encompassing smartphone use during social gatherings and frequent social media interactions.
Fig. 5. P23 cluster structure
These subpartitions offer a window into the psyche of our participants, where the smartphone serves as both a personal companion and a social conduit. The linkage between these behavioral clusters and the preferences for smartphone usage over offline sexual activities underscores the significant psychological interplay at work. Our analysis not only dissects PSU into its constitutive behavioral components but also correlates these dimensions with the participants' choices concerning their sexual lives.
In summary, our dimension reduction illustrates a dual narrative within PSU: the individual and social narratives that interweave to form a complex tapestry affecting offline sexual inactivity. These findings are instrumental in understanding the nuanced dynamics that govern our participants' digital and intimate lives. Our approach has not only quantified these dimensions but also qualitatively enriched our understanding of the psychological factors at play, highlighting the profound influence PSU has on personal behavior and the pressing need for a deeper investigation into this modern dynamic.
In the next stage of our analysis, we modeled the connection between PSU and offline sexual activity with RF model. In addition to the P23 partitions, we also included the demographic and socioeconomic variables in the analysis. Since we have to work with a high number of partitions and thus a high number of variable sets, we used the Random Forest algorithm for modeling to perform a classification analysis, predicting the target variable Sex or Phone. To train the models, we created a test dataset from 30% of the data (N = 270), while 70% of the data (N = 631) functioned as a training matrix. In our model, we fitted our heterogeneous ID-based covariates along sub partitions (P23_x).
The model yielded a notably low average estimated error rate of 12,55%, indicating the potential to construct an acceptable model structure from the variable set [Breiman, 2017]. The primary metrics of the model are detailed in Table 5.
Table 5
RF model evaluation metrics along the Sex or Phone variable categories
|
Values
|
Precision
|
Recall sensitivity
|
F1 score
|
|
No Sex
|
0,803
|
0,874
|
0,837
|
|
No Phone
|
0,875
|
0,955
|
0,912
|
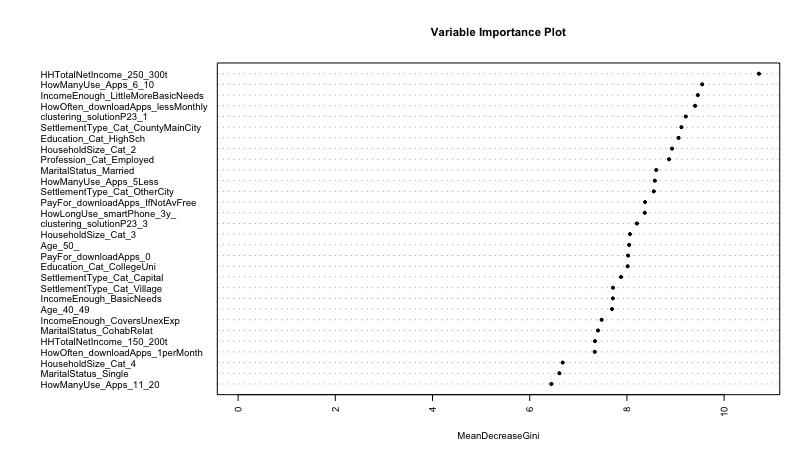
In Table 5, we present the performance metrics of our final model, developed via an algorithmic approach, encompassing precision, recall, sensitivity, and the F1 score. Specifically, our Random Forest (RF) model demonstrates an 83,7% accuracy rate in predicting preferences for mobile phone usage over offline sexual activity, with a false positive rate of 13,6% and a false negative rate of 19,8%. Notably, the model exhibits a superior prediction value of 0,912 for respondents favoring offline sexual activity, suggesting that the incorporation of various psychological metrics and factors significantly enhances predictive accuracy for individuals inclined towards offline sexual inactivity. As a result, the VIM ranking generated by the RF model, can be analyzed (Fig. 6).
Fig. 6. Variable Importance Plot of the RF model
Fig. 6 shows that the P23_1 cluster is the fifth most important predictive variable (β = 9,212), while the P23_3 cluster is included in the model as the fifteenth most important explanatory variable (β = 8,206). All of this confirms that PSU constructed in both individual and social situations have important predictive power in the case of offline sexual inactivity.
Socioeconomic factors are crucial in predicting the preference between sexual activity and mobile phone use. Financial situation, particularly highlighted in our VIM, is a key predictor with two aspects: low household income (205e-300e HUF ~550-800 EUR, β = 10,716) and subjective financial perception (income covering just over basic expenses without savings, β = 9,458). This implies those favoring PSU over offline sexual activity face financial challenges both objectively and subjectively. Demographically, this group predominantly resides in county main cities (β = 9,122) or large cities (β = 8,553) and typically has a high school (β = 9,063) or college/university education (β = 8,015). Professionally, they are often fully employed (β = 8,866), with a notable presence in the 40s and 50s age groups (β = 7,692, β = 8,047). In terms of mobile usage, long-term smartphone users (over 3 years, β = 8,367), those using 6-10 apps regularly (β = 9,549), and infrequent app downloaders (β = 9,403) are particularly inclined towards PSU.
In summary, based on our results, we see that those who are in a less favorable financial situation, mostly middle-aged, living in large cities are the ones who prefer phone usages instead of offline sexual activity. Furthermore, in terms of their mobile usage, they have been smartphone users for a long time, but they use a small number of applications and rarely switch to newer applications. Among them, the proportion of PSU is extremely high, both in terms of individual PSU and PSU arising in social situations.
Based on all these results, we have to reject our hypothesis H1, because in the case of a European Union member country characterized by a semi-peripheral economy, it is not the adolescent, but the middle-aged age group that gives up offline sexual activity due to the use of mobile phones. Furthermore, in terms of income, they can be characterized as a low-middle-class social segment living in large cities. Our research verified our hypothesis H2, as problematic mobile phone use measured both at the individual level and in terms of social context is related to giving up offline sexual activity. Hypotheses H3 are rejected because socioeconomic variables have a higher predictive power than PSU regarding offline sexual inactivity. However, it is important to note that the prediction variables form a complex system, so even if the explanatory power of the socioeconomic variables is higher, it is worth understanding their explanatory power in relation to the PSU variables.
Discussion
The discourse provided herein delves deeply into the nuanced matrix of associations between problematic smartphone use and offline sexual inactivity, with an acute emphasis on the middle-aged demographic within a semi-peripheral European economy. By meticulously analyzing a representative sample via innovative machine learning algorithms – namely Two-NN, HIDALGO, and Random Forest – our study not only substantiates but also expands upon the extant literature which delineates the relationship between PSU, socioeconomic factors, and urban living conditions
[Barnes, 2019; Hao, 2020; Hong F.-Y; Lee, 2008; Lepp, 2016].
Drawing upon the theoretical constructs of social and cognitive behavioral theory, as posited by Chen et al. (2016) and Kim et al. (2018)
[Chen, 2016; Kim, 2018], our investigation recontextualizes PSU as a behaviorally contingent phenomenon, steered not by device dependency but by an overreliance on online behavioral enactment. This rearticulation is further consolidated by the contributions of Király and Demetrovics (2021)
[Király O.,, 2021] and Ferrante and Venuleo (2021)
[Ferrante, 2021], whose discourse on maladaptive cognitions provides a scaffold to understand the intricate interplay between psychopathology and PSU. By interweaving these theoretical threads with the empirical fabric of our findings, our research not only corroborates but also enriches the existing models by threading through the implications of PSU on offline sexual inactivity. This confluence accentuates the significance of maladaptive cognition cycles and behavioral reinforcement in demystifying the influence of PSU on sexual behavior and places our study at the vanguard of research into behavioral addiction and sexual health.
Addressing the limitations of our research, we recognize the need for a finer granularity in the measurement of sexual activity. The prevailing literature signals a decline in sexual activity, particularly amongst middle-aged cohorts
[Amerio, 2021; Beutel, 2016; Bodenmann; Mercer, 2013; Ueda, 2020], prompting future research endeavors to control for this age-related declination to precisely delineate its impact. The infusion of psychological attitude metrics into our analysis could potentially illuminate the underlying psychological mechanisms that mediate the relationship between PSU and sexual inactivity. Further, embarking on longitudinal research endeavors and broadening the geographical scope of comparisons to other regional or international milieus could significantly enhance the robustness of our results and enrich the nuanced understanding of PSU and its implications for sexual inactivity.
We posit that our research furnishes the scientific dialogue on a relatively underexplored topic with robust empirical insights, which may serve as a springboard for policymakers to fortify sexual health strategies amongst individuals grappling with PSU. Additionally, our findings may serve as a beacon for couples to identify and mitigate the detrimental impacts of technological engagement on their intimate connections. Such cognizance is anticipated to spawn more nurturing relationship dynamics and bolster sexual well-being. Nevertheless, it is imperative to acknowledge the inherent complexity and individual variability in the PSU-offline sexual inactivity nexus, which is woven by a myriad of factors. Enhancing our comprehension of these linkages promises substantial dividends in fostering healthier interpersonal relationships and augmenting the collective well-being of society.
Conclusion
The findings from our extensive study have established a substantial correlation between problematic smartphone use (PSU) and a decrease in offline sexual activity, a trend particularly prominent among middle-aged individuals within a defined European Union member country with a semi-peripheral economy. Employing advanced analytical techniques we have not only delineated the dual aspects of PSU – individual and social – but also elucidated how these are shaped by socio-economic determinants including income levels, educational attainment, and urban residency.
Our research advances the academic conversation, forging connections that resonate with prior studies focused on sexual behavior
[Beutel, 2016; Bodenmann; Kim, 2018; Wellings, 2013]. It uncovers the intricate dynamics that interlace PSU with offline sexual inactivity and underscores the necessity of dissecting individual behaviors such as mobile gaming and online shopping, alongside social behaviors like social media participation and digital content creation. This investigation's predictive modeling solidifies PSU's integral contribution to the observed sexual activity decline, thus broadening the discourse to encapsulate not just the younger cohort but also the oft-overlooked middle-aged demographic.
By weaving the threads of lesser-explored sexual inactivity into the fabric of social and cognitive behavioral theories, our work offers fresh perspectives on the complex tapestry of PSU within the societal framework. It lays the groundwork for a nuanced understanding of the societal ramifications of smartphone use, prompting calls for tailored intervention strategies that tackle both personal and societal facets of PSU.
In light of these revelations, our study signals a clear imperative for policymakers, healthcare providers, and community leaders to consider and address the intricate ways in which technological adoption impacts human relationships and health. It calls for the inception of education and intervention programs that address the nuances of PSU and its ripple effects on the social and personal planes.
Future research should aim to traverse beyond the limitations of cross-sectional designs by adopting longitudinal approaches to trace the temporal sequences of PSU behaviors and their long-term impact on sexual inactivity. Moreover, comparative studies across different cultural and economic landscapes may reveal universal patterns or distinctive trajectories, thereby enriching our global understanding of these phenomena. It is our hope that the insights gleaned from this research will not only contribute to the academic field but also translate into actionable strategies that promote a balanced integration of technology into daily life, enhancing the overall well-being of individuals and the collective societal fabric.
Appendix
P2, P3, P4 and P23 partitions
|
Cluster No
|
No Sex
|
No Phone
|
Proportion of No Phone
|
Average posterior ID mean
|
Average posterior ID median
|
Average posterior ID sd
|
|
|
P2 Cluster structure
|
|
|
1
|
496
|
403
|
0,448
|
22,333
|
22,261
|
2,090
|
|
|
2
|
2
|
0
|
0,000
|
0,104
|
0,104
|
0,000
|
|
|
P3 Cluster structure
|
|
|
1
|
2
|
0
|
0,000
|
0,104
|
0,104
|
0,000
|
|
|
2
|
206
|
200
|
0,493
|
2,957
|
22,074
|
0,477
|
|
|
3
|
290
|
203
|
0,412
|
22,643
|
23,549
|
2,753
|
|
|
P4 Cluster structure
|
|
|
1
|
213
|
202
|
0,487
|
23,109
|
23,047
|
0,459
|
|
|
2
|
133
|
108
|
0,448
|
25,977
|
26,348
|
0,906
|
|
|
3
|
147
|
90
|
0,380
|
21,396
|
21,302
|
0,931
|
|
|
4
|
5
|
3
|
0,375
|
4,528
|
1,775
|
5,106
|
|
|
P23 Cluster structure
|
|
|
1
|
232
|
163
|
0,413
|
23,587
|
23,710
|
0,639
|
|
|
2
|
18
|
9
|
0,333
|
16,034
|
15,342
|
1,346
|
|
|
3
|
3
|
3
|
0,500
|
21,513
|
21,560
|
0,538
|
|
|
4
|
168
|
165
|
0,496
|
21,955
|
22,069
|
0,450
|
|
|
5
|
14
|
13
|
0,482
|
22,115
|
22,182
|
0,399
|
|
|
6
|
4
|
4
|
0,500
|
21,854
|
21,951
|
0,997
|
|
|
7
|
4
|
8
|
0,667
|
22,123
|
22,144
|
0,345
|
|
|
8
|
4
|
2
|
0,333
|
21,553
|
21,447
|
0,810
|
|
9
|
7
|
7
|
0,500
|
22,332
|
22,410
|
0,411
|
|
10
|
6
|
0
|
0,000
|
21,776
|
22,002
|
0,913
|
|
11
|
2
|
1
|
0,333
|
21,106
|
20,863
|
0,527
|
|
12
|
8
|
3
|
0,273
|
20,914
|
20,893
|
0,823
|
|
13
|
6
|
6
|
0,500
|
22,588
|
22,584
|
0,306
|
|
14
|
4
|
5
|
0,556
|
22,070
|
22,078
|
0,450
|
|
15
|
1
|
3
|
0,750
|
21,899
|
22,036
|
1,154
|
|
16
|
4
|
1
|
0,200
|
19,262
|
18,901
|
1,229
|
|
17
|
3
|
1
|
0,250
|
14,843
|
14,781
|
1,802
|
|
18
|
1
|
2
|
0,667
|
19,035
|
19,060
|
0,136
|
|
19
|
2
|
1
|
0,333
|
20,894
|
21,320
|
1,502
|
|
20
|
3
|
3
|
0,500
|
6,787
|
4,936
|
3,132
|
|
21
|
2
|
0
|
0,500
|
0,104
|
0,104
|
0,000
|
|
22
|
1
|
2
|
0,667
|
22,219
|
22,332
|
0,458
|
|
23
|
1
|
1
|
0,500
|
22,083
|
22,083
|
0,244
|
| |
|
|
|
|
|
|
|
|
|
[Ali, 2019] It is important to note that there is no complete agreement on this issue, as some research has contradictory results (see Majeur et al. 2020
[Majeur, 2020]).
[Aljomaa, 2016] Optimization involved adjusting model parameters to improve performance. Classification accuracy quantified the proportion of correct predictions, and the kappa statistic provided a measure of accuracy accounting for chance. Additionally, the F1 score, which combines precision and recall, offered a balanced metric of model performance
[Wellings, 2019].