1. A HYPERBOLICAL “RANK- SIZE” DISTRIBUTION AS A CRITERION
OF A DEGREE OF THE SYSTEM PERFECTION
When doing a research on general characteristics of a system, it has been firmly established that the hyperbolical distribution of the main quantitative parameters of systems according to a ranked principle is observed the more precisely, the more perfect the system is.
The concept of perfection of complex and, as a rule, open systems, depending on an approach adopted by different researchers, was replaced by the concept of harmony, self-organization, or integrity, or balance, or a degree of coordination of interaction of a system with the external environment and its internal structural and functional development.
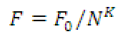
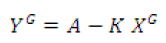
A good concordance of some governing characteristic of objects F (N), ranged as a “rank (N)-size” F(N) distribution, with this characteristic diminishing according to the hyperbolical law with the growing rank N of its elements:
 (1)
(1)
is usually taken as a characteristic of integrity or perfection of a complex system, where F0 is a constant, and an index of power K has the values ranged from 0.8 to 2.5. Remaining practically unchanged, the hyperbolical distribution was named differently by different researchers: it is Zipf- Pareto law in demography, sociology and economics, Estu-Zipf-Mandelbrot law in linguistics, the distribution of Lotka, Bradford, Willis, Urquhart, etc. in scientometrics [5, 13].
Let us name this hyperbolical distribution as Zipf law like the most frequently used term [2-5,8-13,15-19, 21-23, 25,26]. Before Zipf, Auerbach [Auerbach] was among the first to notice this distribution in 1913. This regularity corresponded to the relationship between the urban population size and the ranks of urban settlements in the settlement system. In the subsequent works mentioned above, the authors, following their own analysis or referring to the works of their predecessors, (Shitikov [Shitikov, 2011]), point out that Zipf’s law “plays practically the same universal role in the corresponding fields (related to information, biological, economic and social systems, as a rule) as the Gauss’ law plays in the stochastic processes with finite variance, usually related to the natural processes in the non-organic, physical-and-chemical systems”. Except its universality, the distinctive feature of the law is that it describes the quality of a holistic system rather than a random sample. In the linguistic investigations devoted to Zipf’s law, the necessity of integrity of a text or a piece of music is particularly stressed, because the law does not work for the random parts. [5, 26].
Thus, the absence or low correspondence of some ranked distribution with Zipf’s law must show either the imperfection of the system for which the distribution has been found, or the incomplete set of investigated objects, which in principle may be interpreted as the same thing. For example, take the distribution of population size in the urban agglomeration or the distribution of length of shop shelves in the system of urban settlements. Depending on this system’s life-time since the moment of high external impact on it, this distribution will be closer to Zipf’s law, or deviate from it, or not achieve similarity to it yet. For the open dynamically self-developing systems, the proximity to Zipf’s law is the criterion of proximity of the corresponding system of objects to the near stable and balanced state. These ideas are widely recognized in the scientific world and are already applied in the training process at schools. [Gorbatova].
Let us provide the example illustrating the statements made in the previous paragraphs. It follows from the data presented in the works by Lappo, Nefyodova [14, 24] that in Russia in the post-Soviet period of time, particularly since 2003, the urban-type settlements are turned into the rural-type ones, including the suburban areas of large cities and the regions of the country with agglomerations. This type of reorganization has become especially large-scale in the Sverdlovsk region. In some agglomerations, the number of urban-type settlements has drastically reduced, but the process of population gathering in the largest cities and their suburbs has started. Fig.1 shows the ranked distributions of population in the towns and urban-type settlements in the Sverdlovsk region in 1979, 2002 and 2015. The data are presented on a log-log scale. The linear and polynomial approximations of distributions for the above adduced years and the mean-squared deviation of approximating lines from the actual distribution (a determination coefficient, or DC, or RA2) are presented in Table 1. We will not perform a detailed analysis of population distribution dynamics here. However, the graphs and the unit deviation of RA2 value show that in the post-perestroika era the previously established (developed) distribution deviates more and more from the linear distribution under the influence of administrative reforms, i.e. from Zipfs distribution, as a result of violation of a stable state of an earlier self-organized system. For 2015, a linear approximation on the log-log scale has an exceptionally low DC or RA2 value as compared with this value for the approximation by the quartic polynome.
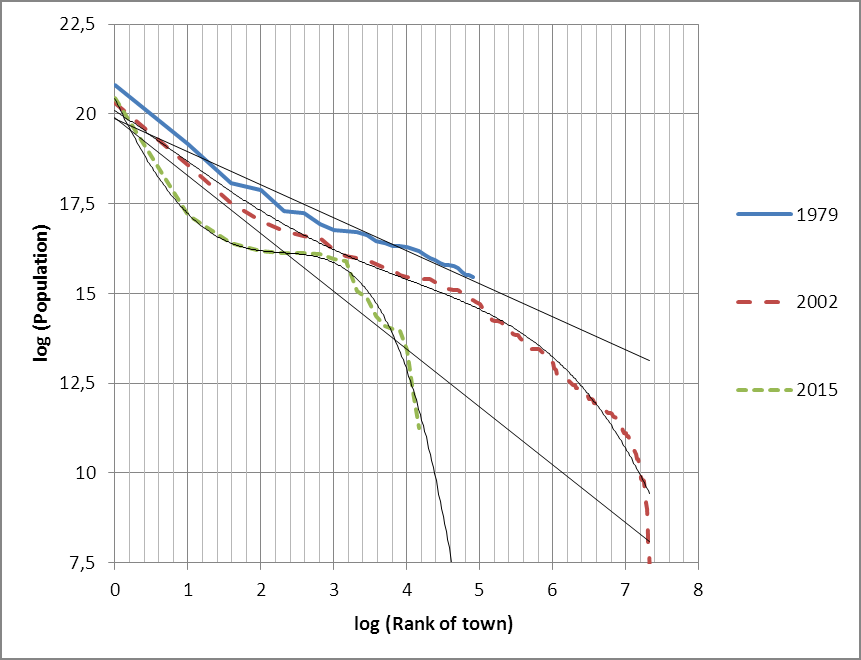
Fig. 1. The distribution of urban population in the Sverdlovsk region
in 1979, 2002 and 2015.
Table 1. Approximation of distributions of urban population in the Sverdlovsk region
|
Years |
Approximating polynom |
DC=RA2=R2 deviation |
|
1979 |
y = -0,9204x + 19,885 |
0,9533 |
|
2002 |
y = -0,0098x4 + 0,0947x3 - 0,1839x2 - 1,3272x + 20,096 |
0,9703 |
|
2015 |
y = -0,0783x4 + 0,2233x3 + 0,9649x2 - 4,3135x + 20,422 |
0,9813 |
|
2015 |
y = -1,6096x + 19,896 |
0,8427 |
2. THE CRITERIA OF SYSTEM “IDEALNESS” WITH REFERENCE TO THE RANKED DISTRIBUTION OF OBJECTS AND LINKS BETWEEN THEM
Zipf’s distribution describes a system “harmoniusness”, which can be translated from Greek as “proportionality, identity in arrangement of parts, organic blending of various object components”. In some systems, Zipf’s distribution describes their functionality [30, 31]: a minimal number of means to formulate thoughts (Zipf). In other systems, it describes the aesthetic value [18, 22, 26]. Yet in other systems, it describes a stable balanced state in relation to not-too-intensive external impact [Shitikov, 2011]. All these cases of the system state approximation to the model describe a degree of its (system’s) perfection in terms of functionality, aesthetics or capacity for maintaining a stable state. By a degree of perfection we shall mean a degree of coincidence with Zipf’s law of the rank-size distribution for the system objects, and the mean square deviation of distribution from the function of Zipfs distribution on the log-log plot (the determination coefficient, or DC, or RA2) will be taken as a criterion of perfection.
As was shown in [Makagonov, P Model], the proximity to the golden proportion of the ratio of the number of significant words to the general number of words or (which ideally must be similar) of the ratio of the number of syntactic words (link-words) to the number of significant words can be considered as the express-evaluation of perfection of holistic texts.
It is a well known fact that for the economic systems, the golden proportion also describes their quality by the relation between the whole and its parts or, more specifically, the whole and parts which are essentially different by nature. However, in none of the well-known cases the whole and its parts were considered as the objects and links between them. The fact is that in the economic systems, when considering the N objects, it should be assumed that all the objects are interconnected either directly or by a network (graph) structure. Therefore, the number of (non-oriented) links must be in the range from N to N (N-1)/2 for the system consisting of N objects. This means that the relation between the number of objects and the number of links between them cannot be equal to the number corresponding to the golden proportion.
As was shown in the same work [Makagonov, P Model], two criteria are worthwhile to be considered as a means of assessing the perfection of holistic texts:
- proximity of distribution of significant words to Zipfs law or Zipf-Mandelbrot law, (which is a recognized criterion);
 (1) or (2)
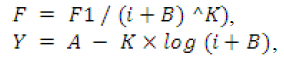
where ![]() : i is a rank of distribution of significant words by the frequency of use in a text, and F1, B, K and А are some constants, moreover, the formulas are simplified with B=0 for the texts containing less than 1800 words.
: i is a rank of distribution of significant words by the frequency of use in a text, and F1, B, K and А are some constants, moreover, the formulas are simplified with B=0 for the texts containing less than 1800 words.
- proximity of distribution of syntactic words and link-words to a more general law
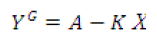 (3)
(3)
The example considered ibidem has shown that the distribution of the interaction force is well approximated by the law
 (4)
(4)
for the objects distributed by Zipf’s law.
It is not always easy to find in the system a characteristic of objects, which corresponds with the rank-size distribution. However, there are systems, in which a characteristic of this type can be more natural for the links between the objects. An internet forum, where the members of some community exchange views on mutually interesting problems, can serve as an example of such system. The number of topics under discussion and the number of messages on these topics are the most popular characteristics of the forums. The number of matters under discussion is intentionally regulated by the forum moderators, the number of forum users at first rises steeply as a result of a membership drive campaign, and then it changes through time as a result of self-organization. The number of messages on each specific issue grows both in the whole community and with its each member. However, it is more correct to consider the messages as the links between the objects, which are the forum members, rather than the forum objects as a system. Therefore, it would be correct to consider the degree of forum self-organization through the analysis of distribution of the number of messages posted by each forum member.
Let us give some examples. The distribution of the number of messages posted on the internet forum of the town of Podolsk within a period of the first five years of this forum existence (curve 1 in Fig. 2А) and the distribution of the messages of the first 291 forum members at Kom- munarka settlement included in New Moscow in 2012 (curve 2 in Fig. 2B) are presented in Fig. 2А on the log-log scale. The distributions illustrated by Fig. 2A can be approximated by the formulas (3) or (4). Let us consider a more general case of these formulas: 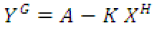 (5).
(5).
Let us assume that the value H can take on a value equal to 1 or G, or a value, which is nonequal to them.
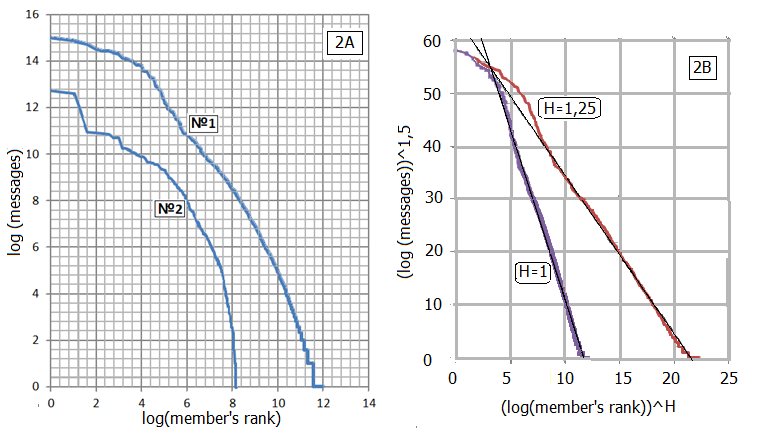
Fig. 2А. The distribution of the number of messages posted on the internet forum of the town of Podolsk (curve 1 in Fig. 2А) and the distribution of the messages of the first 291 forum members at Kommunarka (curve 2 in Fig. 2А).
The approximating lines (curves) can be found by one of the methods of directional selection of the value of the variables G and H, with which the value of the determination coefficient RA2 reaches the maximum level.
With Н=1, the best approximation for the distribution of the number of messages on the Podolsk forum is given by: yA1,5 = -6,4428xA1 + 75,314 with the value R2 = 0,9899.
With the arbitrary value Н, which is different from Н=1, the following result has been obtained, with a nearly coinciding value of the quality criterion: yA1,5 = -2,9745x A1,25+ 64,083 with the value R2 = 0,9897.
Fig. 2B illustrates the distribution of distribution of the number of messages on the Podolsk forum and two straight lines
 (6),
(6),
for which
 (7)
(7)
with the values Н=1 and Н=1,25.
The following best quality approximations were obtained for the similar distribution of the first 291 members of the Kommunarka settlement forum (curve 2 in Fig. 2А): y^2 = -22,246x + 190,19 for H=1 and R² = 0,961, and y ^2= -6,4205x^1,5 + 154,61 with H=1,5, where R² = 0,9857. The latter result is the best one. Thus, accepting a hypothesis on possible preferability of a more general formula: (5) or (6), with the notations (7) is approved.
Examples and counter-examples can be produced by the method of a simulation experiment to demonstrate that for the rank distribution of links between the objects of a system, a good concordance of this distribution with the empirical functional dependence of the type (5) is one more required criterion of system perfection, along with a condition of concordance of distribution of system objects with Zipfs law.
For this purpose let us consider next:
1) A “linear-type” system, in which the objects are arranged along a line at a first approximation, so that the links between them are provided through their neighbors. A graph in Fig. 3 corresponds to this model. In applied problems of the system analysis, for example, a linear agglomeration of settlements with the discretely located entries and departures to the main road or the railroad with the stops at each point corresponds with this graph.
2) Two systems of star-shaped objects, which weights have a central symmetric distribution, and links between the objects are also either centrosymmetric or their configuration has greatly violated links at the graph center. Various local systems of interaction can correspond to this system.
3) A system consisting of two intergrown star-shaped subsystems. This system corresponds to two or more settlements which have the same administration or local social media in the community with a strong tradition of separate communication among men, women, and young people. Such social media are described in the paper [Makagonov, Pavel, Celia, 2008].
3. COMPUTATIONAL EXPERIMENTS WITH THE DISTRIBUTION OF LINKS BETWEEN THE OBJECTS OF SYSTEMS, WHICH DIFFER BY THE DISTRIBUTIONS OF THE WEIGHTS OF OBJECTS PROPER
3.1. “Linear-shaped” systems
Let us consider model 1 of the system consisting of 81 objects with the weights V(i) given by the formula: V =100/i (i=1,2, - N) or by the formula corresponding to the inverted distribution V=100/(82-i).
Hence, a “perfect” (hyperbolical) Zipf‟s distribution is given. Let us assume that the object indices simultaneously fix their coordinates on a number scale. Let us assume that Dk is a distance between the objects with the indices “i” and „j‟ and it is equal to the difference Dk=i-j for all the variants (i≥j) (i=1, 2, 81) (j=1, 2,81). The total number of such variants and therefore the distances between the system objects is defined by the formula kmax = ½ N (N -1). This number is equal to 40*81=3240. After all the distances were calculated they were ranked in descending order so that in this case D1 equaled to a maximum value D1=80 (k =1).
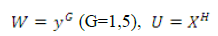
The notations X=Log (k) /Log (kmax); Y = Log (Dk) /Log (D1) are agreed in Fig.3 (left). They are used to present the distribution of the distances between the objects ranked by the “rank-size” principle in Fig.3 (left). (A construction is made on the log-log scale with respect to the variables k and Dk.)
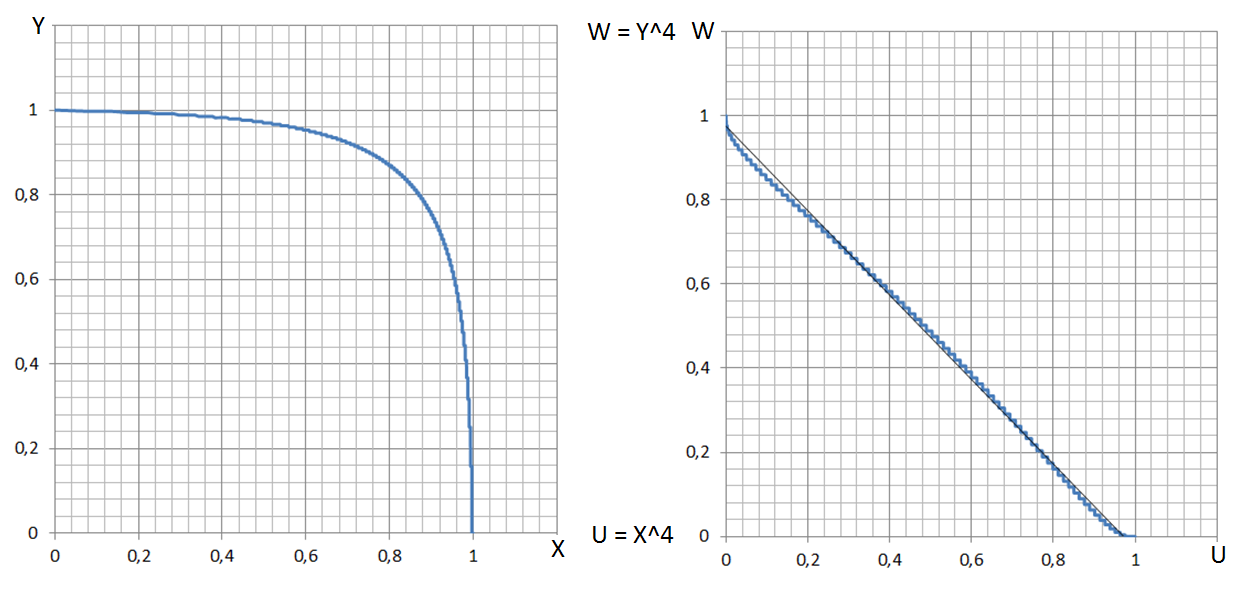
Fig. 3. The distribution of distances between the elements of model 1 (left), its transformation and approximation by the straight line (right).
After the normalization, this distribution is well approximated by the function
X^4+Y^4=1 (8)
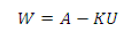
Having made a substitution and going to the new variables U=XA4, W=YA4, we obtain a line, which is well approximated by the straight line (Fig. 3, right):
W = -1,0029 U + 0,9742 with R^2 = 0,9981 (9)
A degree 4 (G=H=4) in the formula (8) corresponds to the maximum value of the criterion RA2 in the approximation (9).
Instead of the distance between the objects of model 1, let us now consider another parameter of the object constraint force, namely, the parameter defined by the formula of the force of mutual attraction of the objects:
F (i, j) =Vi Vj/(Ni-Nj) ^2 (10)
Then the best approximation to the straight line results from the distribution (5) (or (6)-(7)) for y=log(F;2), x= log (k), where F is defined by the formula (10), and k is a rank of a link parameter ranked in descending order:
y^1,25 = -2,0822x^1,25 + 45,8; (11)
with R2 = 0,9996
Seeking for the maximum of RA2 criterion by the variables G and H, we carried out a search in increments of 0,25. Here the points with negligible deviations from the maximum turned out to be the nearest to the point G=1,25 H=1,25 affording the maximum to criterion RA2:
- (G=1,5; H=1) (y^1,5 = -8,6943x + 101,15;) with the value of criterion R² = 0,9981 and
- (G=1,25; H=,5) (y ^1,25= -1,0048x^1,5 + 40,71)) the value of criterion R² = 0,9987.
It is important to note here that if the given weights of objects were distributed at random, the approximation of distribution (9) remained unchanged, because this distribution was ranked in descending order of the value of distance between the objects. However, for the approximation of the type (11) with a random distribution of weights, the situation deteriorates: namely, the criterion maximum is reached at G=2 H=1 (the sum of indices in an approximating straight line has grown by 0,5 and is equal to 3): y^2= -13,89x^1 + 49,788, and the maximum has fallen even though ligibly to R2 = 0,9982.
The point that is closest to the maximum is: G=1,75; H=1,25 (y ^1,75= -5,7383x^1,25 + 28,805) with the result R² = 0,9979.
3.2. “Star-shaped” systems (A group of models #2)
Let us assume that a “star-shaped” system consists of the objects which weights have a centrally symmetrical distribution.
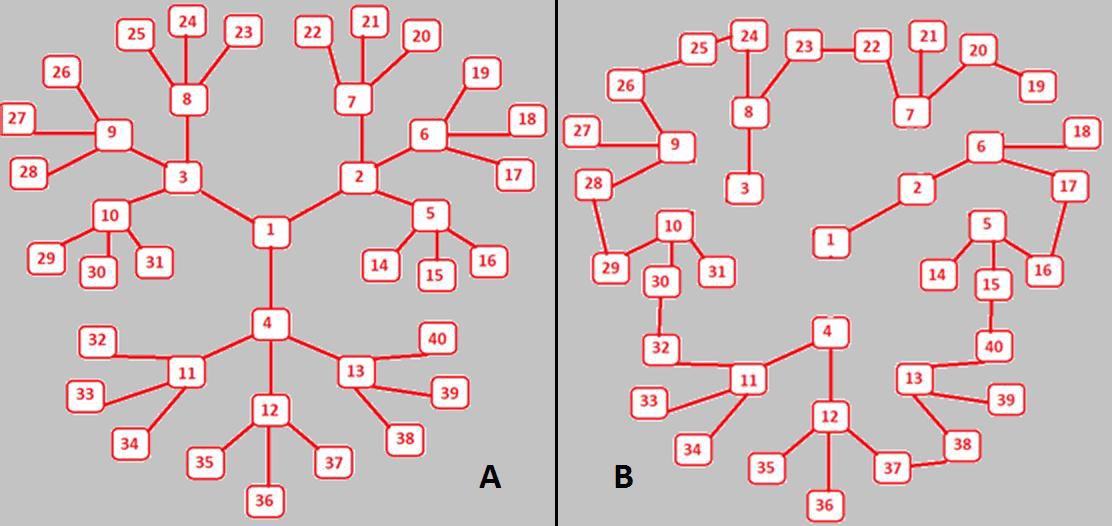
Fig. 4. A centrally symmetrical dendrite A, and a dendrite B with a nearly linear distribution.
Two systems of this type with the different nature of links of elements in a uniform graph are presented in Fig.4. The central symmetry in Fig.4A, becomes apparent in an obvious way through the links between the nodes of graph, which central node 1 is a root of dendrite. The next three nodes, namely, the second, third, and fourth nodes, are linked with the first one. Inversely, this structure repeats itself self-similarly for the second, third and fourth nodes, which form three-rayed continuations finishing with nodes (5,6,7), (8,9,10) and (11,12,13). There is a “parent” node for each node, beginning with the second one. In total, 40 nodes are formed in the structure, which result in three generations from a common root. We will consider these nodes as the objects of a system. The objects of each generation will be given a weight which is inversely related to the number of generation. As a result, the multi-step function distribution occurs, which is similar to Zipfs distribution, with a very low value of criterion RЛ2 (see Fig.5). A similar case is the distribution of settlements in the theory of “central places” and a compilation of a frequency list of words, where a low-frequency part of the list contains many words with the equal frequency of occurrence [21,23,29].
Fig. 5. The multi-step function distribution occurs, similar to Zipf’s distribution, with a very low value of criterion RA2.
Thus, we can test the quality of distribution of links between the objects with the distribution, which is typical of some systems, but which is far from perfection in terms of concordance with Zipfs distribution. For the centrally symmetrical distribution of the weights of objects given in such a way, two models greatly different from each other were constructed: in one of them the links between the objects also have a central symmetry (Fig. 4A), whereas in the other the links form a nearly linear graph configuration with greatly violated links at the graph center. The numerical value of links between two objects i and j D (i,j) is defined by the number of arcs connecting the objects. The length of each arc here is taken to be equal to 1. The values D are ranked in descending order and are designated D(k) for the construction of the ranked distribution of links.
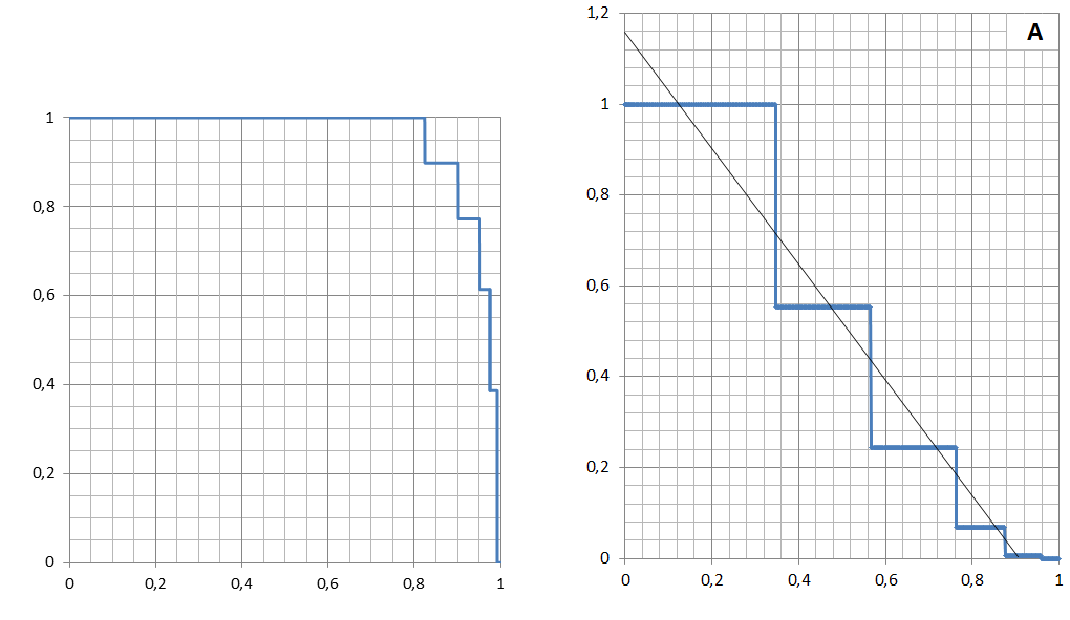
Fig. 6. The distribution of distances between the elements of graph A (left), its transformation and approximation by the straight line (right).
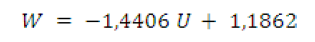
In the notation X=Log (k)/Log (kmax); Y = Log (Dk)/Log (D1), the distribution of distances between the elements of graph (Fig. 4A) is shown in Fig. 6 (left). Introducing the new variables U=X^5,5 and W=Y^5,5, we obtain a line which is approximated by the straight line (Fig. 6, right)
W = -1,2745 U + 1,1576 (12)
at the value of criterion RA2 equaling to 0,9279.
Similarly, we obtain results for a nearly linear asymmetric graph in Fig. 4B. The distribution X,Y is shown in Fig. 7 (left). The distances between the points are described by the distribution presented in Fig. 4B.
This distribution is
X^3+Y^3≈1 (13)
Introducing the new variables U=XA3, W=YA3, we obtain a line which is approximated by the straight line (Fig. 7, right)
W = -1,0195 U + 1,0038 (14)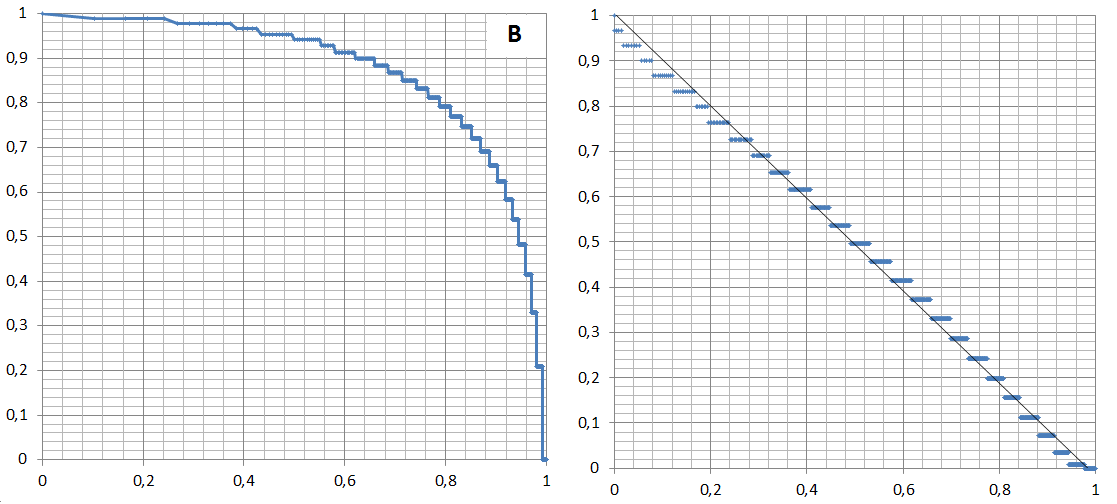
Fig. 7. The distribution of distances between the elements of graph B (left), and its transformation and approximation by the straight line (right).
Using the characteristics {Vi} and {Dk (i, j)}} at two presented graphs, the strength of links can be calculated by the formula
F (i, j) =Vi Vj/( Dk (i, j) ^2) (15)
The distribution of the strength of links is calculated for three cases:
- the first graph (Fig. 4A) with multi-step distributed weights shown in Fig. 5;
- the first graph (Fig. 4A) with the weights distributed according to Zipfs law (V=1/N);
- the second graph (Fig. 4B) with the weights distributed according to Zipfs law (V=1/N).
Table 3.
|
Table 3 |
RA2 |
G for RA2 max |
Comments: a positive factor (+); a negative factor (-) |
|
Case 1 |
0.98 |
1.75 |
(-) a large deviation of weights of nodes from the “ideal” Zipf distribution. |
|
Case 2 |
0.9948 |
1.5 |
(+) Regularity and concordance with Zipfs law and graph symmetry give the best result |
|
Case 3 |
0.9945 |
1.75 |
Good distance distribution (+) vs. (-) irregular weight distribution within the graph. |
It can be seen that the second case corresponds to minimal value of G and maximal criteria RA2. The multi-step deviation of weights (case 1) provides a worse result (RA2 and G) in comparison with the ideal Zipf distribution (cases 2 and 3).
Thus, the perfect distribution of distances between the elements (model 2 - case 1) can smooth out some negative impact of the imperfect weights’ distribution.
3.3. Model 3
Fig. 8 shows the structure of model 3: the system of nodes forming a dendrite similar to two starshaped parts. The length of arch in this case is the distance Dk (i,j) between the nodes (objects) “i” and “j” of a graph:
- The distances between node 23 and nodes 1-22 in the first “star” are equal to 1: D1(1, 23) = D2(2, 23) =- = D22(22, 23) = 1.
- The distances between the nodes of a “bridge” are equal to 10:
- Dk (23, 24)= Dk (23, 24)= Dk(23, 24)= 10.
- The distances between node 26 and nodes 27-40 in the second “star” are equal to 1: Dk1 (27, 26) = Dk2 (28, 26) =- = Dk22(40, 26) = 1.
It is not hard to calculate the remaining distances. The total number of distances is
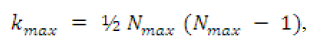
where Nmax=40. This system can exist, for instance, when two settlement systems are combined into one administrative system.
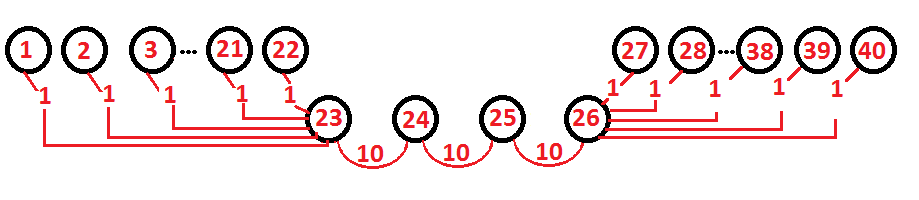
Fig. 8 The dendrite-type structure: two star-shaped parts united by a bridge.
This distribution of pairs of numbers (U=XA7, W=YA7) is presented in Fig. 9.
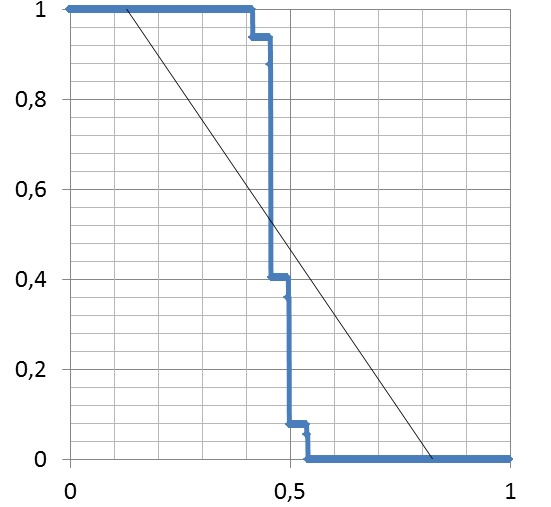
Fig. 9 The distribution of pairs of numbers (U=XA7, W=YA7).
Here ![]() and
and ![]() . This distribution can be ap
. This distribution can be ap
proximated by the straight line:
 (16)
(16)
The value 7 of index of power corresponds to the maximum value of the criterion RA2 in an approximation (16). Here the criterion RA2 reaches the maximum 0,7979.
The weights of nodes are distributed in accordance with Zipfs law V=1/N, which can be approximated by the straight line with RA2= 1 and G=1. Thus, we obtain the distribution for the strength of links between the elements of this system with criterion RA2 0.977 at G=3.25 for the given system of nodes with a very low criterion RA2 = 0,7979.
The cases of models 2 and 3 demonstrate the possible existence of the system which: - is imperfect in terms of the distribution of weights of objects, - has not so perfect (model 4) or perfect (model 5) distribution of distances between the elements of these systems,
yet has a perfect distribution for the strength of links between the elements of each of these systems.
3. CONCLUSIONS
Complex open systems are characterized not only by a hyperbolical function of ranked distribution of their objects. A degree of their perfection, a level of their self-organization must also be evaluated by the distribution patterns of links between the objects. The empirical criterion of perfection of distribution of the type (5), where the variables of G and H take on the values ranging from 1 to 4, is suggested for the links ranked in descending order of their intensity. The criterion itself is defined as a determination coefficient RA2. The compliance of the ranked distribution of the system’s objects with Zipfs law, or, in case of a linguistic system, with Zipf-Mandelbrot law, is a widely recognized required sign of the system perfection. The same criterion is suggested to be applied for the approximation of links between the objects as a second required sign of the system perfection. This sign is of vital importance for the economic-and-geographical, and financial systems of the “stocks and flaws” type. The goods-money systems of stocks and flaws cannot be considered in a one-sided way, i.e. either only stocks or only flaws. Therefore, only the estimation of perfection of each part of a system (stocks and flaws) makes it possible to judge about the perfection of the system as a whole. Previously it was shown that the criterion suggested can be successfully used for the analysis of perfection of holistic texts. Thus, fulfilling the requirement for the criterion of perfection of links between the objects is common for any complex open systems.