Introduction
The Lüshi Chunqiu records a statement of Confucius: “The eye is what you trust, but the eye is not trustworthy.” Do we see things in themselves, or ourselves?
Cross-cultural research is a promising endeavor in psychology (Gutchess, Rajaram, 2023), and it is expected to remain so for as long as human populations differ in terms of race, ethnicity, and culture (Ananyeva et al., 2017). Cultural neuroscience proposes that biological factors may lead to cultural variation at the neural and genetic levels, while cultural factors may lead to variation in brain structure and function and gene expression, and that culture interacts with genes (Chiao, Ambady, 2007). It is interesting enough that no one has taught us the way in which we should perceive the world, people of the same culture coincidentally adopt a similar approach, which seems to be the influence of the implicit culture, where we implicitly learn from those around us to act in such a way (Veissière et al., 2020). It is exactly because these cultural reasons are so complex that in psychological research, very often, it is difficult to explain why, precisely, such cultural differences occur; we can only say that we have discovered such cultural phenomena and can only try to explain them logically.
Most cross-cultural studies have focused on the East and West comparisons. In a study of cognitive psychology, Masuda and Nisbett (2001) found that Americans are more inclined to pay attention to the details in an entire picture, while Japanese are more inclined to pay attention to the background and the whole. They called this phenomenon the holistic thinking of East Asians and the analytical thinking of Westerners, and trace the cause to the influence of economic and social factors, resorting to the distinction between hunters, herders and farmers (Masuda, Nisbett, 2001). Gutchess et al. (2006) conducted a cross-cultural study on objects and contexts using fMRI, demonstrating that there may be cultural differences in brain activity at an early stage during object processing between Western and Eastern people, which is also reflected in different cognitive tasks (Han, Northoff, 2008). There are also cross-cultural differences in the perception of color, with some high-latitude countries perceiving blue more acutely, with more words describing it in that culture (just as there are two words for blue in the Russian language), and with one physiological explanation being that ultraviolet light alters the physiology of the lens (Josserand et al., 2021). All of this suggests that in reality the world is not always the same in the eyes of people from different cultures, and that culture influences our brain activity.
In a similar way to these perceptual cross-cultural findings, face recognition emerges as a result of differences between cultures in the ability of humans to perceive universally, and there is stability in the way people in the same cultural environment perceive faces (Blais et al., 2008). Understanding face recognition, which is arguably the most sophisticated cognitive function of the human brain, ought to be the main goal of research in the fields of cognitive neuroscience and psychophysiology (Rossion et al., 2023). According to the results of the eye tracking experiments, the similarities were that there was no significant difference in where people in both Eastern and Western cultural environments initially gazed at their noses (Or et al., 2015), and there was no significant difference in the eventual result (Caldara, 2017). Putting these commonalities aside, then, over relatively long durations, people in different cultures have shown different strategies for perceptual encoding of faces. When perceiving a face, Westerners tend to favor an analytical strategy, that is, paying attention to the “triangle” or “T-shaped pattern” formed by the eyes and the mouth, whereas Easterners tend to favor a holistic strategy, that is, looking at the nose or the central region of the face (Ananyeva et al., 2017; Blais et al., 2008; Kelly et al., 2010). Multicultural-influenced observers, on the other hand, use an integrative strategy that focuses more on the eyes and nose (Tan et al., 2012). It is worth mentioning a cross-cultural study by Ananyeva et al. (2016) on the perception of faces of different races: whether they perceived Caucasian or Mongolian faces, Tuvians focused more on the left and middle parts of the face, whereas Russian participants paid more attention to the upper, right, and lower parts of the face, and in all cases the Russian participants’ visual fixations were longer. The formation of these ways of perceiving is influenced by culture early on and continues to deepen in response to experience and environmental factors. Children from infants (Liu et al., 2011; Wheeler et al., 2011) to 7 years of age (Kelly et al., 2011) appear to exhibit gaze strategies similar to those of adults. The researchers speculated that even if the first gaze was focused on the same facial area, because they may have initially dispersed their extra-central concave attention to the face separately in different ways, leading to subsequent differences in eye movement patterns (Estéphan et al., 2018).
Recent approaches to the study of spatial frequency have shown that Eastern and Westerners do not use the same spatial frequency when perceiving faces (Tardif et al., 2017), and that within a fairly short period of time — 34 milliseconds into the appearance of the stimulus face — the spatial frequencies of Eastern and Western observers have been shown to be different, with Western observers using higher spatial frequencies to perceive the face (Estéphan et al., 2018). This difference in the use of spatial frequencies may be explained by differences in the spatial frequencies of frequently contacted faces (Blais et al., 2021).
The timing and dynamics of culture-specific perceptual differences still need to continue to be investigated, and with the extremely limited adoption of event-related potentials (ERPs) as a high temporal resolution method for cross-cultural face recognition studies, we are eager to know whether, also as revealed by eye tracking and spatial frequency studies, the brains of culturally-influenced observers show differences in electrical activity in a considerably shorter period of time? In studies of ERPs for face recognition, initial perception to faces was demonstrated at 100 ms (Colombatto, McCarthy, 2017; Irak et al., 2019), structural processing of faces at 170 ms (Bentin et al., 1996; Eimer, 2000a; Eimer, 2000b; Rossion, 2014; Schweinberger, Neumann, 2016), and second-order processing of faces at 200 ms (Latinus, Taylor, 2006; Schweinberger, Neumann, 2016), with subsequent event-related potentials being even more important for recognition of familiar faces and task completion. Using a method of localizing sources of brain activity, we can visualize ERPs in regions of interest, as well as the connectivity of activated brain structures, which will lead to new psychophysiological evidence for cross-cultural visual perception, attention and face recognition.
The other-race effect (ORE), or the own-race bias (ORB), is the recognition of one’s own racial face as superior to that of another (Meissner, Brigham, 2001). For example, in the overview of Ananyeva (2021), it may be generally claimed that all Mongolian faces are similar to those of Caucasians, just as all Mongolians share the “same face”. By using fMRI method, occipito-temporal and midcingulate areas and caudate nucleus are reported in response to the other-race faces (Ficco et al., 2023). In recent years, there has also been a proliferation of studies using ERP method to investigate the ORE (Colombatto, McCarthy, 2017; Hahn et al., 2012; Jiang et al., 2023), and it’s been proven in infants (Sugden, Marquis, 2017) and children (Anzures et al., 2022), seemingly because it is easier to experiment in the same cultural setting. Moreover, people are more accurate in recognizing the emotions of faces of their own race (Khose et al., 2017). Serendipitously and interestingly, we accidentally discovered a reverse of the ORE, and this is consistent with the prediction of Hugenberg and his colleagues (Hugenberg et al., 2010; Hugenberg et al., 2013)!
Materials and methods
Participants
The experiment involved 36 participants (mean age = 21.30 years, SD = 2.97), including: 18 Russians (9 females and 9 males) and 18 Chinese (9 females and 9 males). All participants were right-handed. The education of all participants was high. All participants had no neurological disorders or head injuries; they were not taking antidepressants. All participants gave informed consent to the processing of personal data.
Stimuli
Black-and-white photographs of male faces (20 Russians and 20 Chinese) were used as stimuli. All photos were generated or modified by artificial intelligence, and all were unfamiliar faces to the participants. All images were against a white background. Faces were full faces looking forward with neutral expressions and without any jewelry.
Experimental Design and Procedure
The participant was positioned at a distance of 70 cm from the center of the monitor screen on which the stimuli were presented.
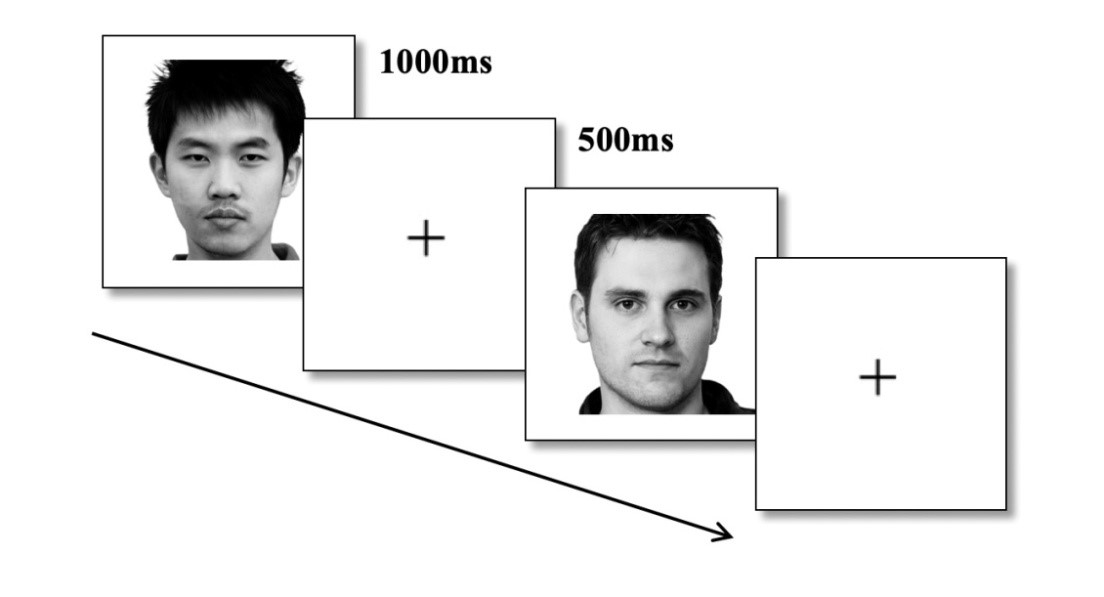
Task 1 — face perception (Figure 1). 20 faces unfamiliar to the participants were presented sequentially in random order. These were 10 faces of Russians and 10 faces of Chinese. Each face was presented for 1000 ms, with a 500 ms interval between each two faces, during which a fixation point in the center of the screen was presented. Each face was presented 10 times, totaling 200 presentations of faces. EEG was recorded. At the moment of face presentation, marks were placed in the EEG for subsequent averaging of ERPs.
Task 2 — face recognition (Figure 2). Participants were presented with photos of faces (40 faces were presented sequentially in random order, 20 of which were faces that were presented in task 1; and 20 were previously unpresented faces of people unknown to the participants (10 Chinese and 10 Russians)).
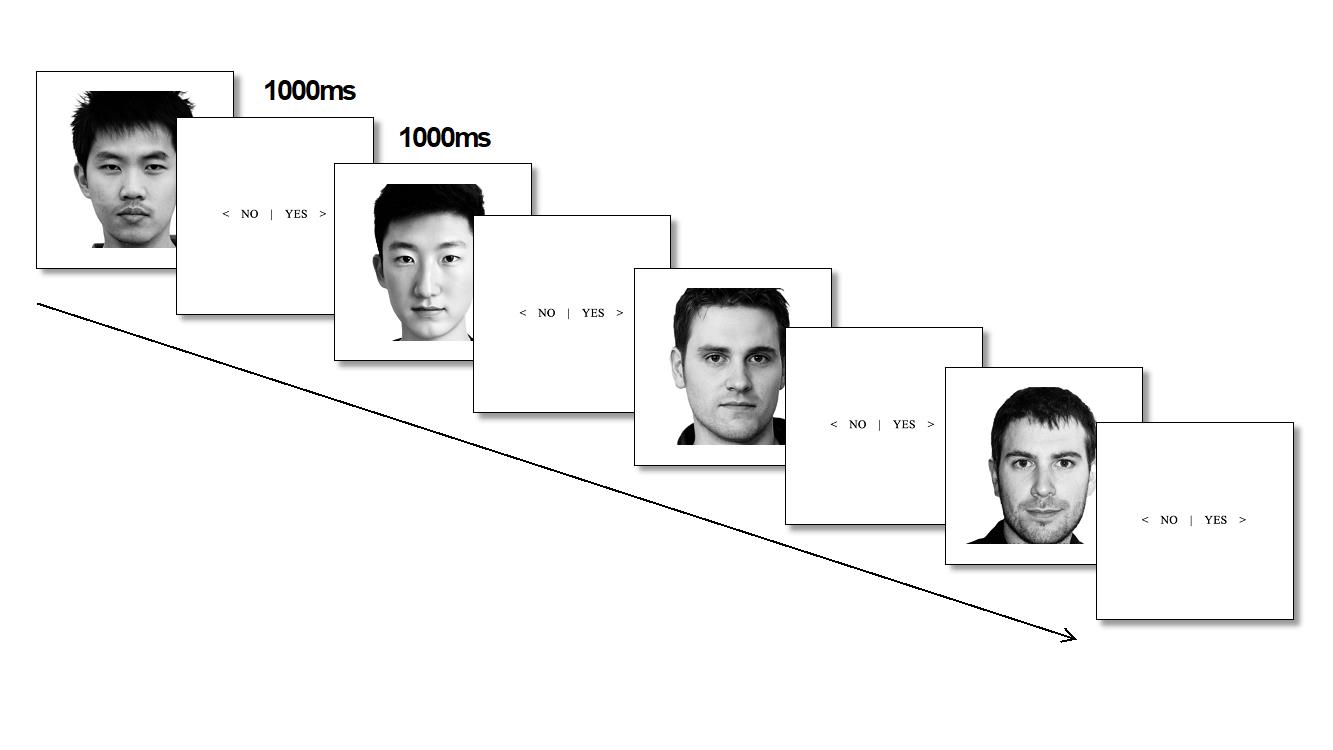
After each face was presented, participants were asked whether or not they had seen the face before. Each face was presented for 1000 ms, and the question of familiarity was also shown for 1000 ms. When the question appeared, participants had to press a key on the keyboard. If they had seen the face before, the right arrow on the keyboard was pressed; if they had not seen the face before, the left arrow was pressed. Each face was presented 10 times, for a total of 400 presentations. The EEG was recorded. At the moment of face presentation, marks were placed in the EEG.
Equipment and data analysis
The Presentation program (version 20.2 of Neurobehavioral Systems, Inc., USA) was used to present stimuli. Brain electrical activity was recorded monopolarly, using a 19-channel electroencephalograph “Neuro-KM” (Company Statokin, Russia). The electrodes were arranged according to the international 10-20% system with two reference electrodes on the mastoids. The BrainSys program (BrainWin, Russia) was used to record and edit EEG to exclude artifacts. The figures of ERPs were plotted using Statistica program (version 10.0). For source localization of brain activity, a method called “Virtually implanted electrode” was used (Vartanov, 2022; Vartanov, 2023; Vartanov & Masherov, 2025).
Activity was examined at 53 points selected from the MNI152 atlas at the center of structures, including Globus Pallidus Medialis L, Globus Pallidus Medialis R, Thalamus L, Thalamus R, Ventral Striatum BA25, V1 BA17 L, V1 BA17 R, V4 L, V4 R, V3v L, V3v R, VO1 L, VO1 R, VO2 L, VO2 R, PHC1 (OFA) L, PHC1 (OFA) R, PHC2 (FFA) L, PHC2 (FFA) R, etc. For each of these structures for the entire period of EEG recording under each of the conditions under study, an integral index of the average signal amplitude (standard deviation) was calculated, and correlation coefficients between all pairs of these structures were calculated as an index of functional connectivity. At the same time, “effective” (i.e., causal) connections were also investigated by searching for the delay (latency shift) of ERPs in one structure relative to ERPs in the other. This made it possible to determine the direction of causal relations on the basis of the fact of precedence of activity changes. As a result, comparative graphs of connectivity of the studied structures were constructed.
Results
Behavioral Results
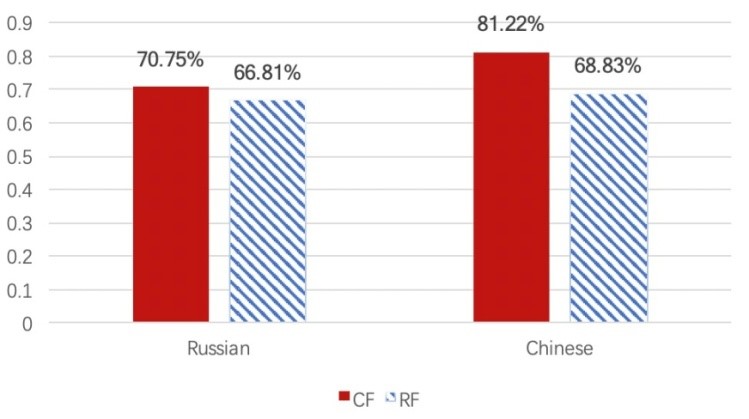
The average percentage of correct answers for participants who performed the task of recognition of face was 71.9% (for Russian participants — 68.78%; for Chinese participants — 75.03%) > 50%. The average percentages of correctness in recognizing Chinese and Russian faces in Russian and Chinese participants, respectively, are shown below (Figure 3). Chinese participants had a higher rate of recognition of same-race faces (81.22% > 68.83) and, incidentally, Russian participants had a higher rate of recognition of other-race faces (66.81% < 70.75%).
Results of Connectivity and Event-Related Potentials (ERPs)
We focused only on the parts with the largest differences, looking first at differences in regions of significant activation in the connectivity graphs and then at differences in the amplitudes of the ERP components in the ERP graphs.
Figures of Connectivity and ERPs for Russians and Chinese
Participants from different cultural backgrounds completed the task of face perception and recognition. The following ERPs were obtained:
Russian — Russian participants
Chinese — Chinese participants
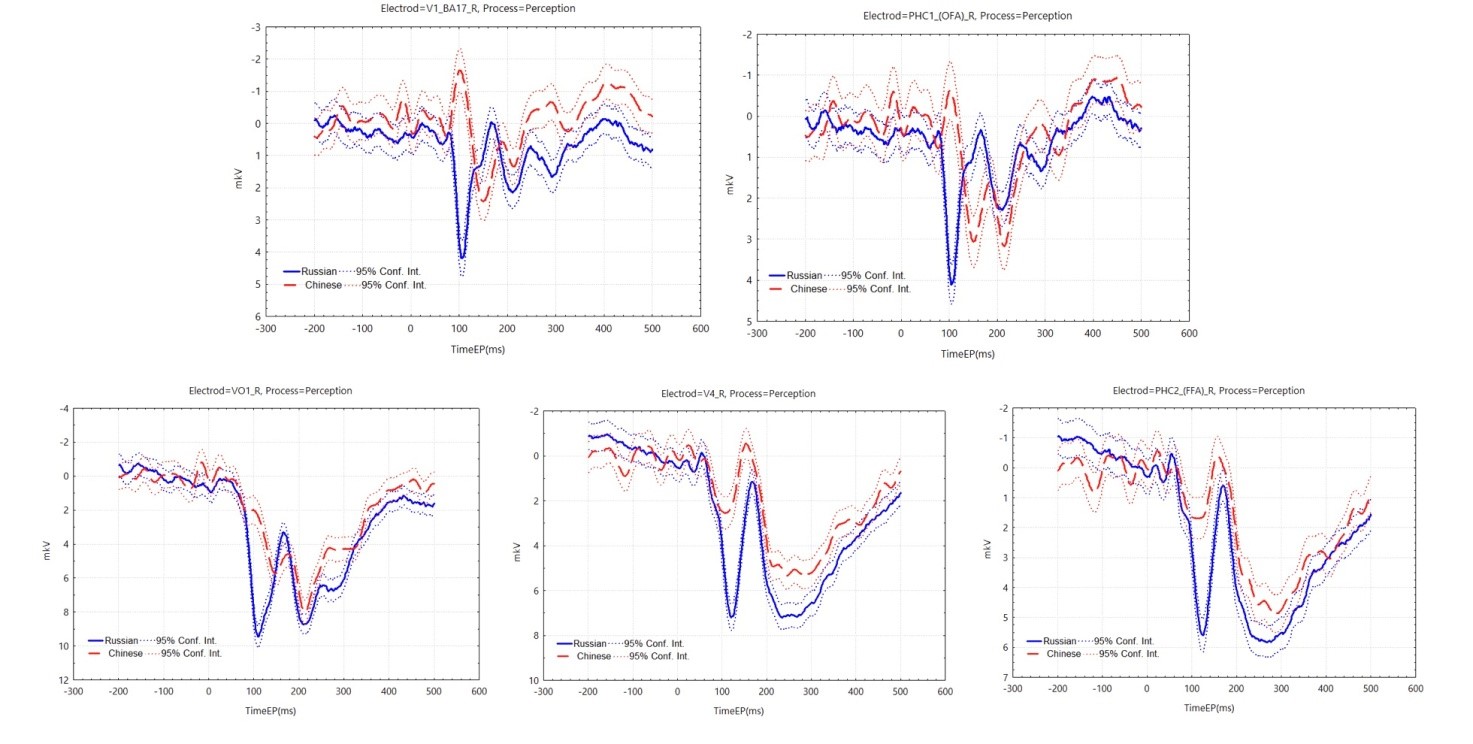
In the face perception task, we were interested in the primary visual cortex, face-selective areas (OFA R and FFA R) (Haxby et al., 2000), and areas significantly activated in the connectivity graph. We focus more on the early components of face processing (Schweinberger & Neumann, 2016).
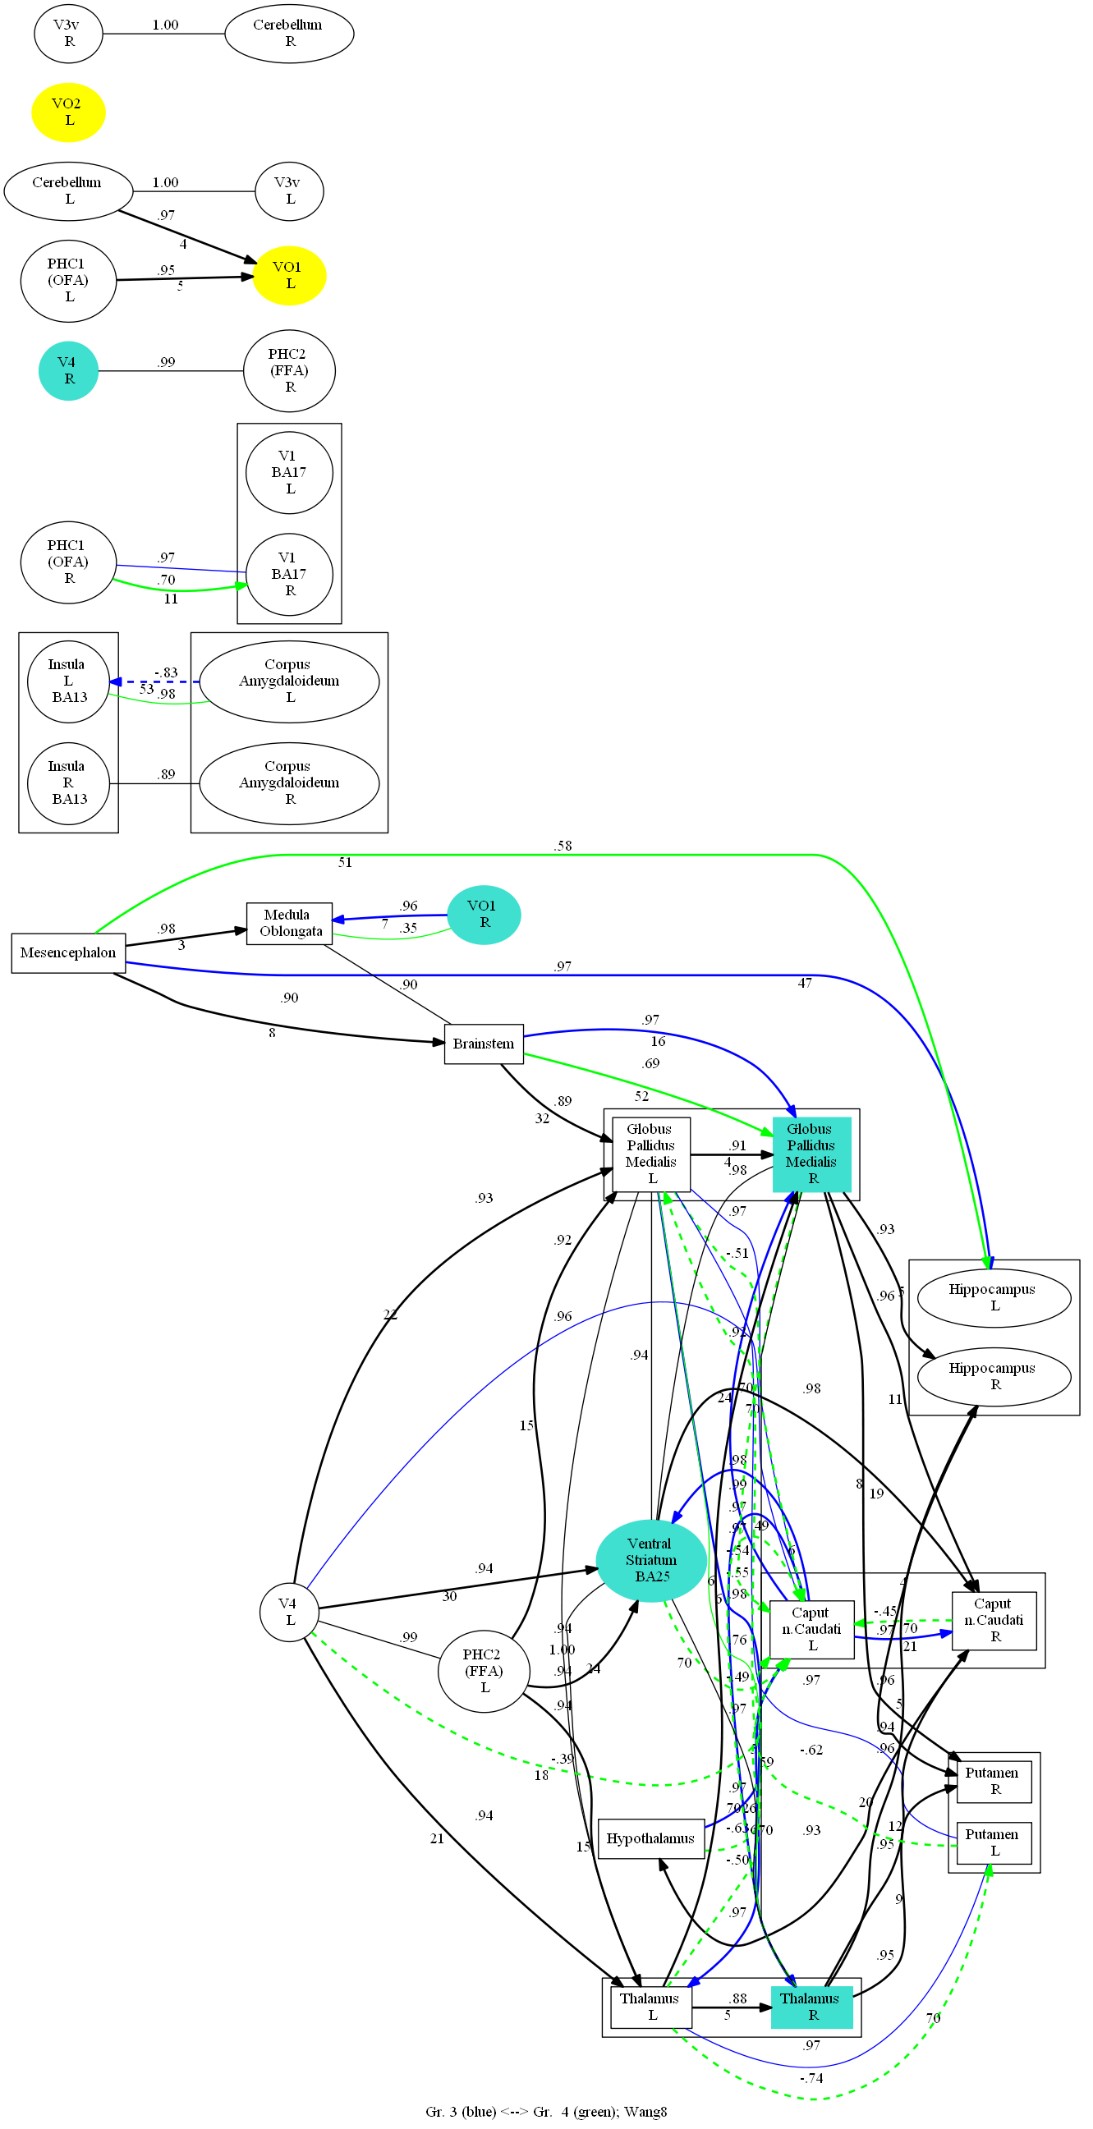
In the connectivity graph (Figure 4), it was found that Chinese and Russian participants co-activated VO1 L, VO2 L, and Russian participants additionally more significantly activated V4 R, VO1 R. In addition, causal connections from the ventral occipital cortex to the thalamus and pallidum and from the cerebellum to the internal globus pallidus (GPi) showed significant differences between the two groups of participants.
In the ERP graphs (Figure 5), it was found that in the primary visual cortex of the right hemisphere and in the OFA area of the right hemisphere, the two groups embodied a great difference in the first 200 ms, with two negative potentials observed in the Chinese participants at around 100 ms and 180 ms, and one positive potential at around 140 ms; and P100 and N170 observed in the Russian participants. The high activation of Russian participants in the VO1 R and V4 R regions seems to correlate with the P100 component (up to 8-10 µV). ERPs in the V4 R and FFA R regions showed external similarities, with Chinese participants having a slightly earlier N170 latency and greater amplitude.
In the face recognition task, the two groups of participants co-activated VO1 L and VO2 L in the early phase, and the Russian participants activated the right GPi, the ventral striatum, and the right thalamus in the late phase of recognition, in addition to the extra activation of V4 R and VO1 R in the first phase (Figure 6).
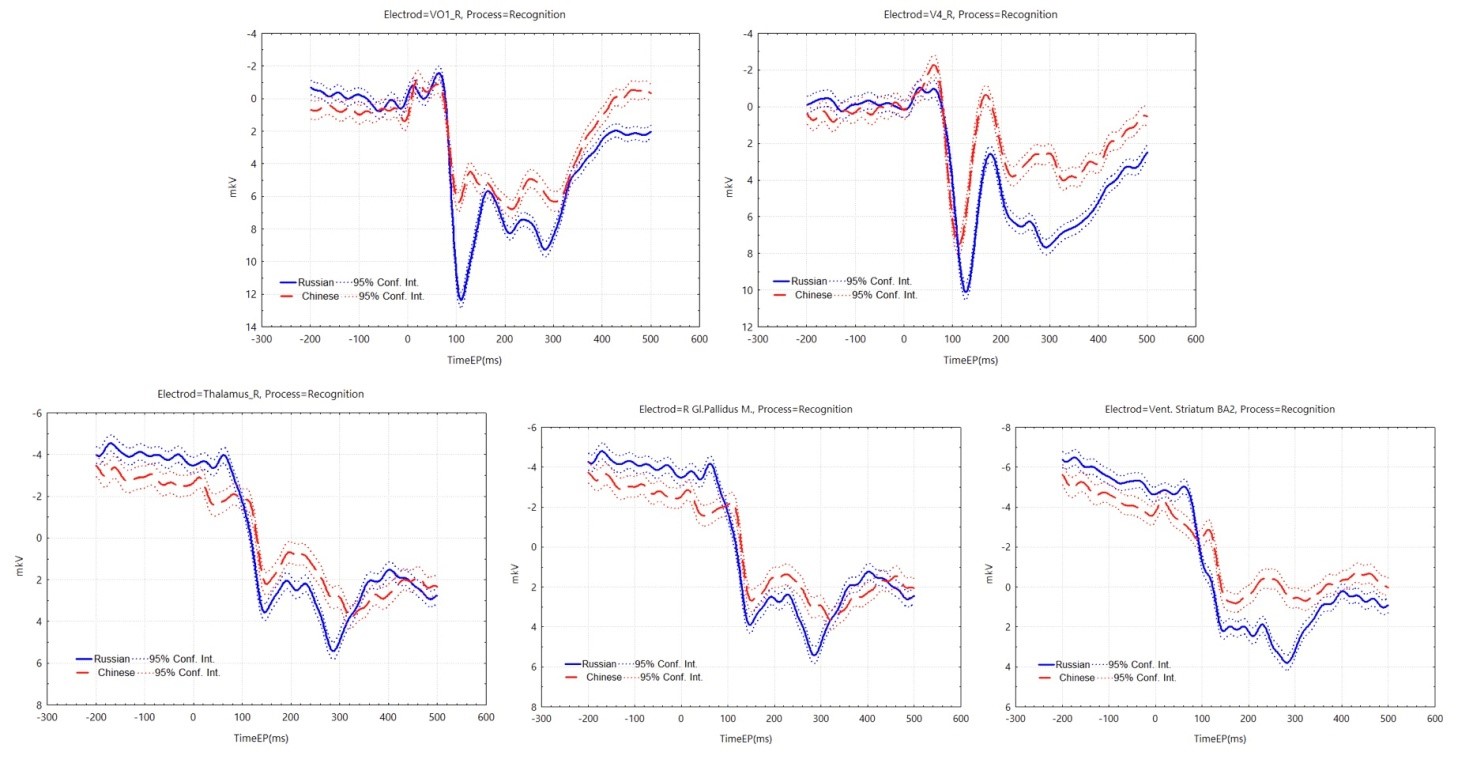
In the ERP graphs (Figure 7), it was found that in the V4 R and VO1 R regions, similar to the perception task, the amplitude of P100 reached 10-12 µV in the Russian participants, and N170 was slightly earlier and of greater amplitude in the Chinese participants. In the later stages of face recognition, differences between Russian and Chinese participants persisted, with Russian participants showing greater positivity in ERPs. In the additional highly activated right thalamus, GPi, and ventral striatum in Russian participants, we found larger P300 amplitudes of 4-6 µV. This seems to be more relevant to the specific task, and perhaps is it related to the reverse in the ORE in the behavioral results?
Figures of connectivity and ERPs for Recognizing Chinese and Russian Faces
The brain areas activated by Russian and Chinese participants showed significant differences during the face recognition task, so it is interesting to see if these differences are determined by the ethnicity of the faces. Regions of interest are OFA R, FFA R and additional highly activated regions in the connectivity graphs.
In task 2 — face recognition, each participant recognized faces of different races — Russian and Chinese, respectively.
The obtained ERPs are as follows:
CF — Chinese faces that participants recognized.
RF — Russian faces that participants recognized.
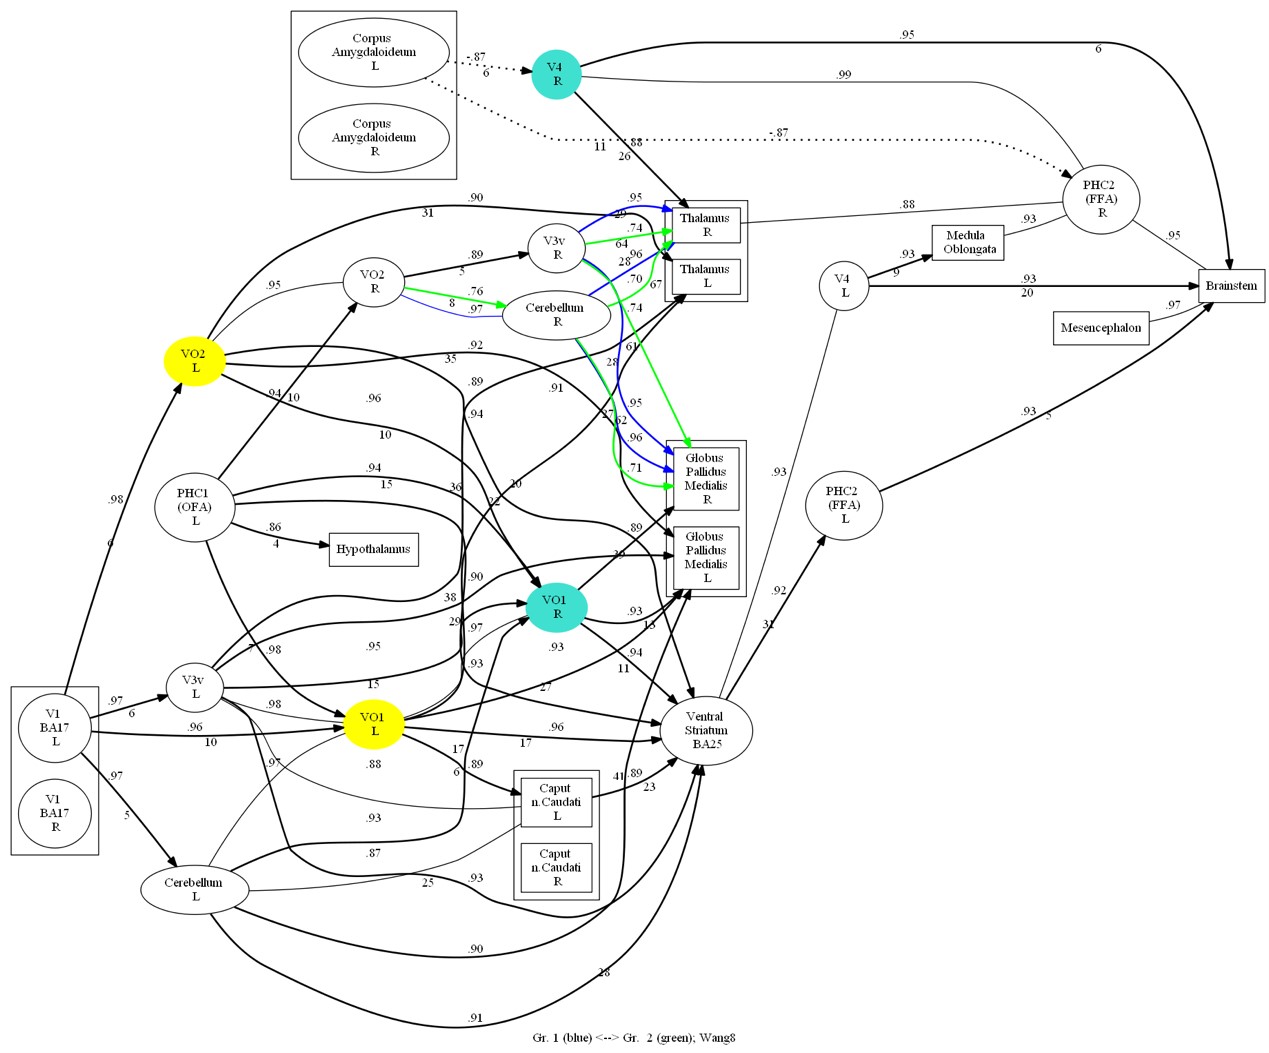
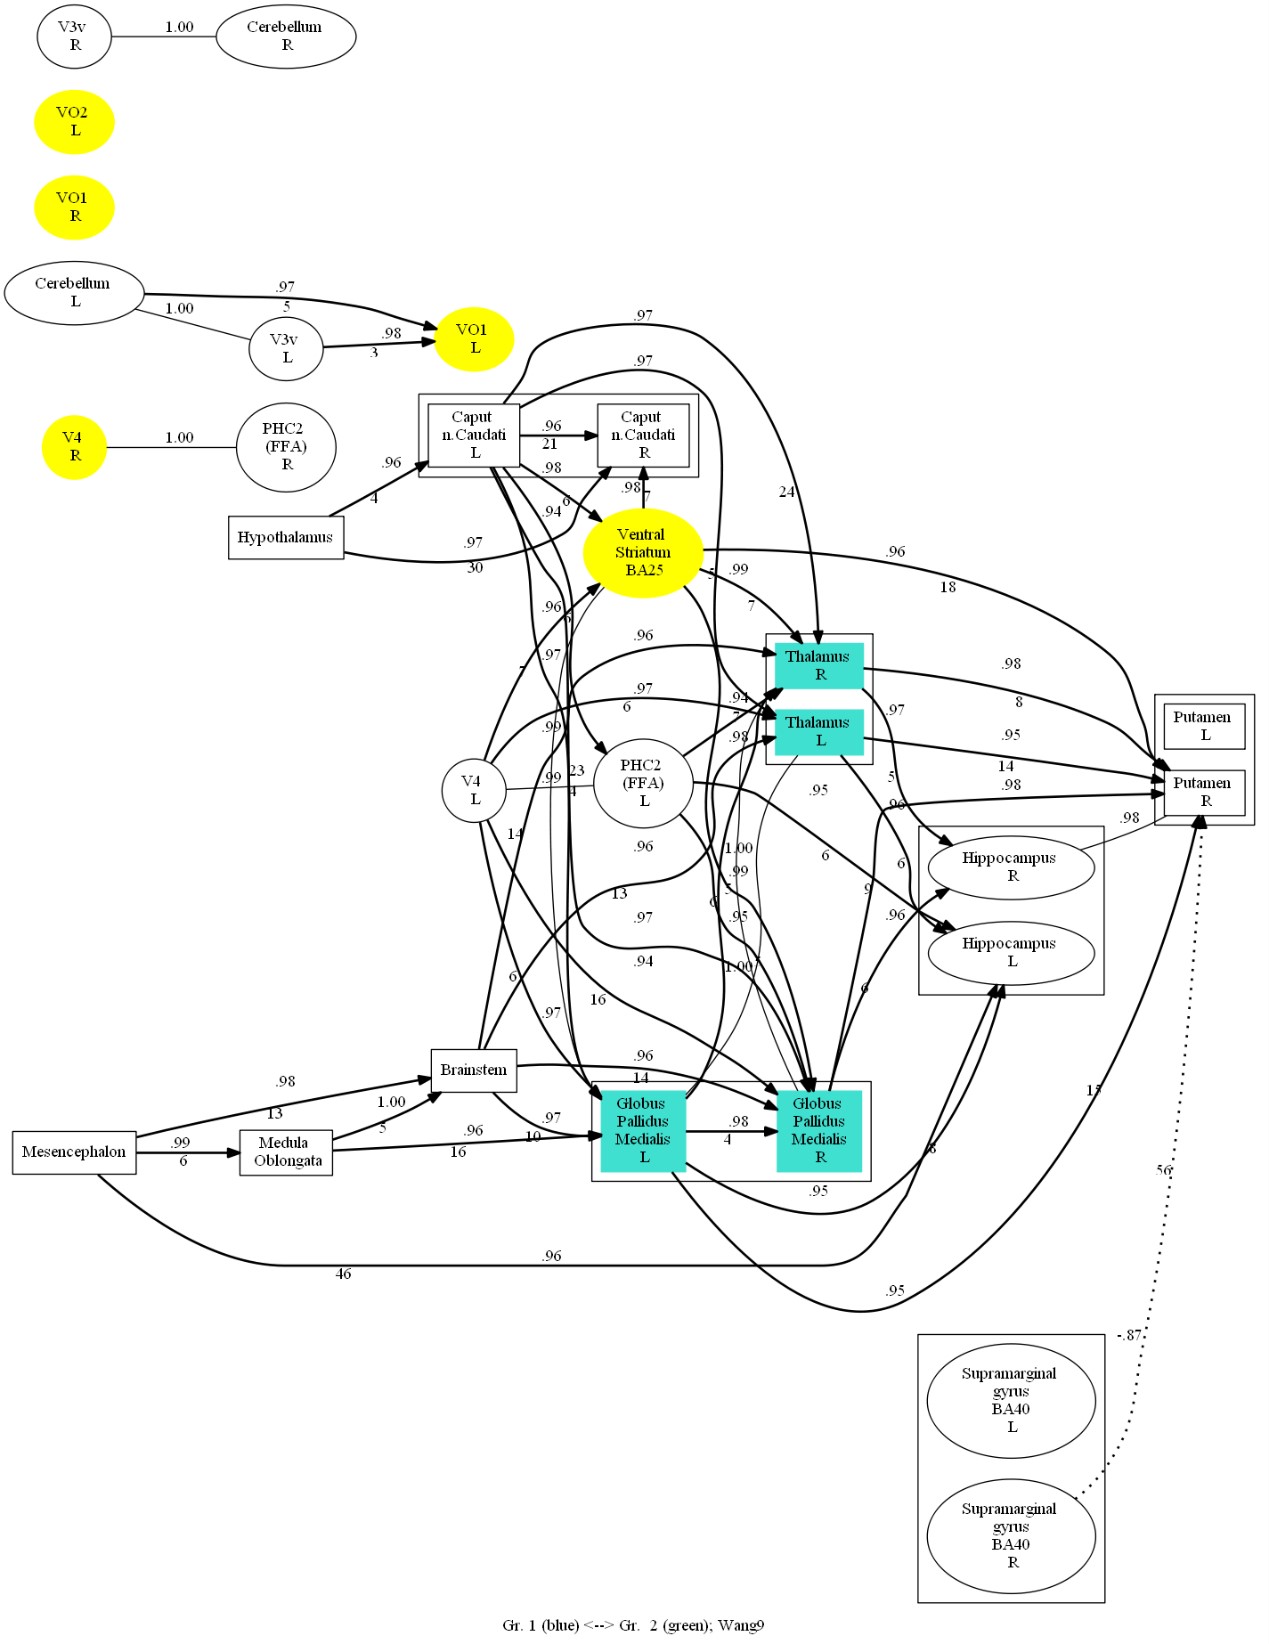
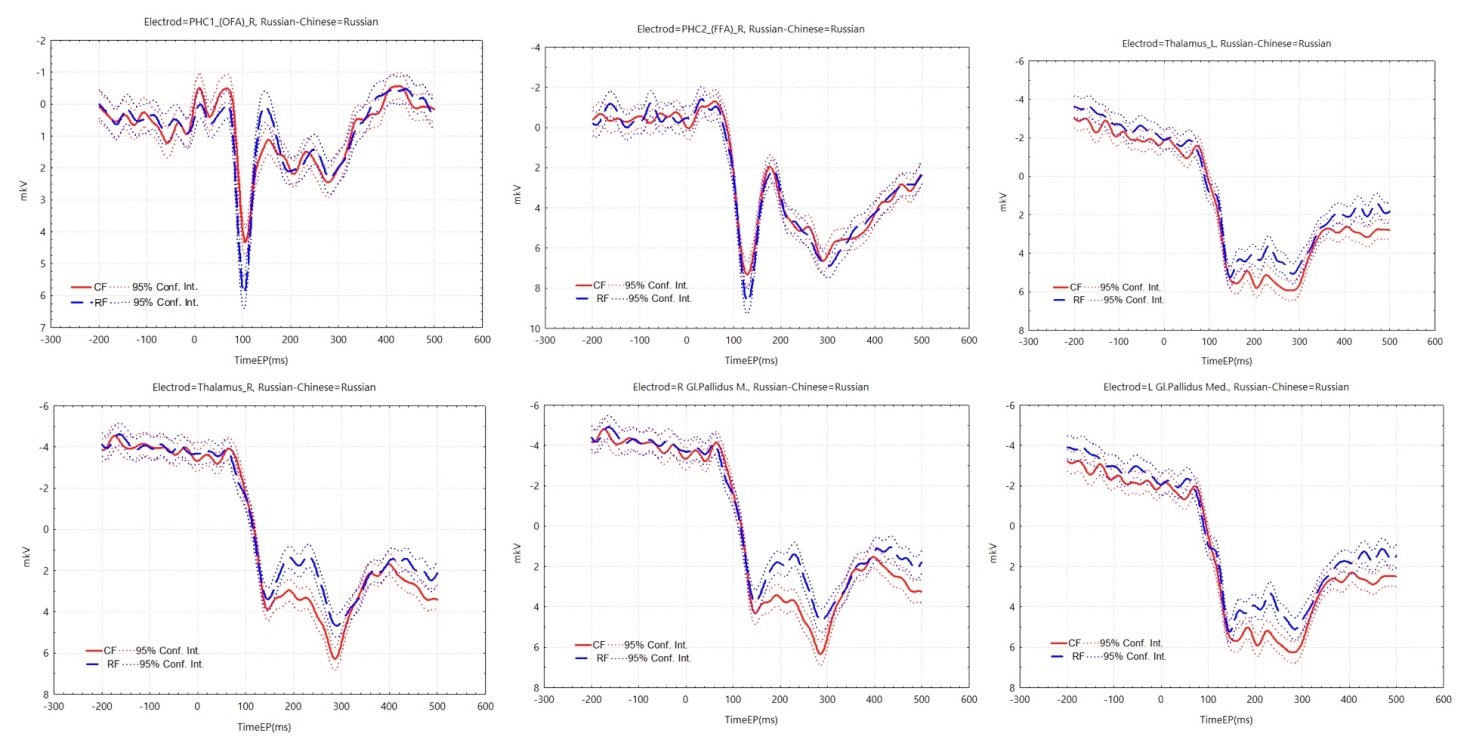
According to the connectivity graph (Figure 8), it was seen that Chinese participants highly activated VO1 L and VO2 L during the recognition task, but there was no significant difference in the areas that were highly activated by same-race faces and other-race faces. In another way, Russian participants looking at Chinese and Russian faces co-activated VO1 L, VO1 R, VO2 L, V4 R, and ventral striatum, and additionally highly activated the thalamus and the GPi on both sides when looking at Chinese faces at a mid- to late-stage of recognition (Figure 9). According to the ERP graphs (Figure 10), it was found that in the OFA R region, P100 and N170 were both greater in amplitude at the same-race faces, and in the FFA R region, P100 was greater in amplitude at the same-race faces, with no significant difference in the late phase; in the two sides of the thalamus and the GPi, there was no significant difference in the early phase, but starting from about 160 ms, the Chinese faces brought about a higher value of positive potentials than the Russian faces, and at about 300 ms, it reached a peak with a significant P300.
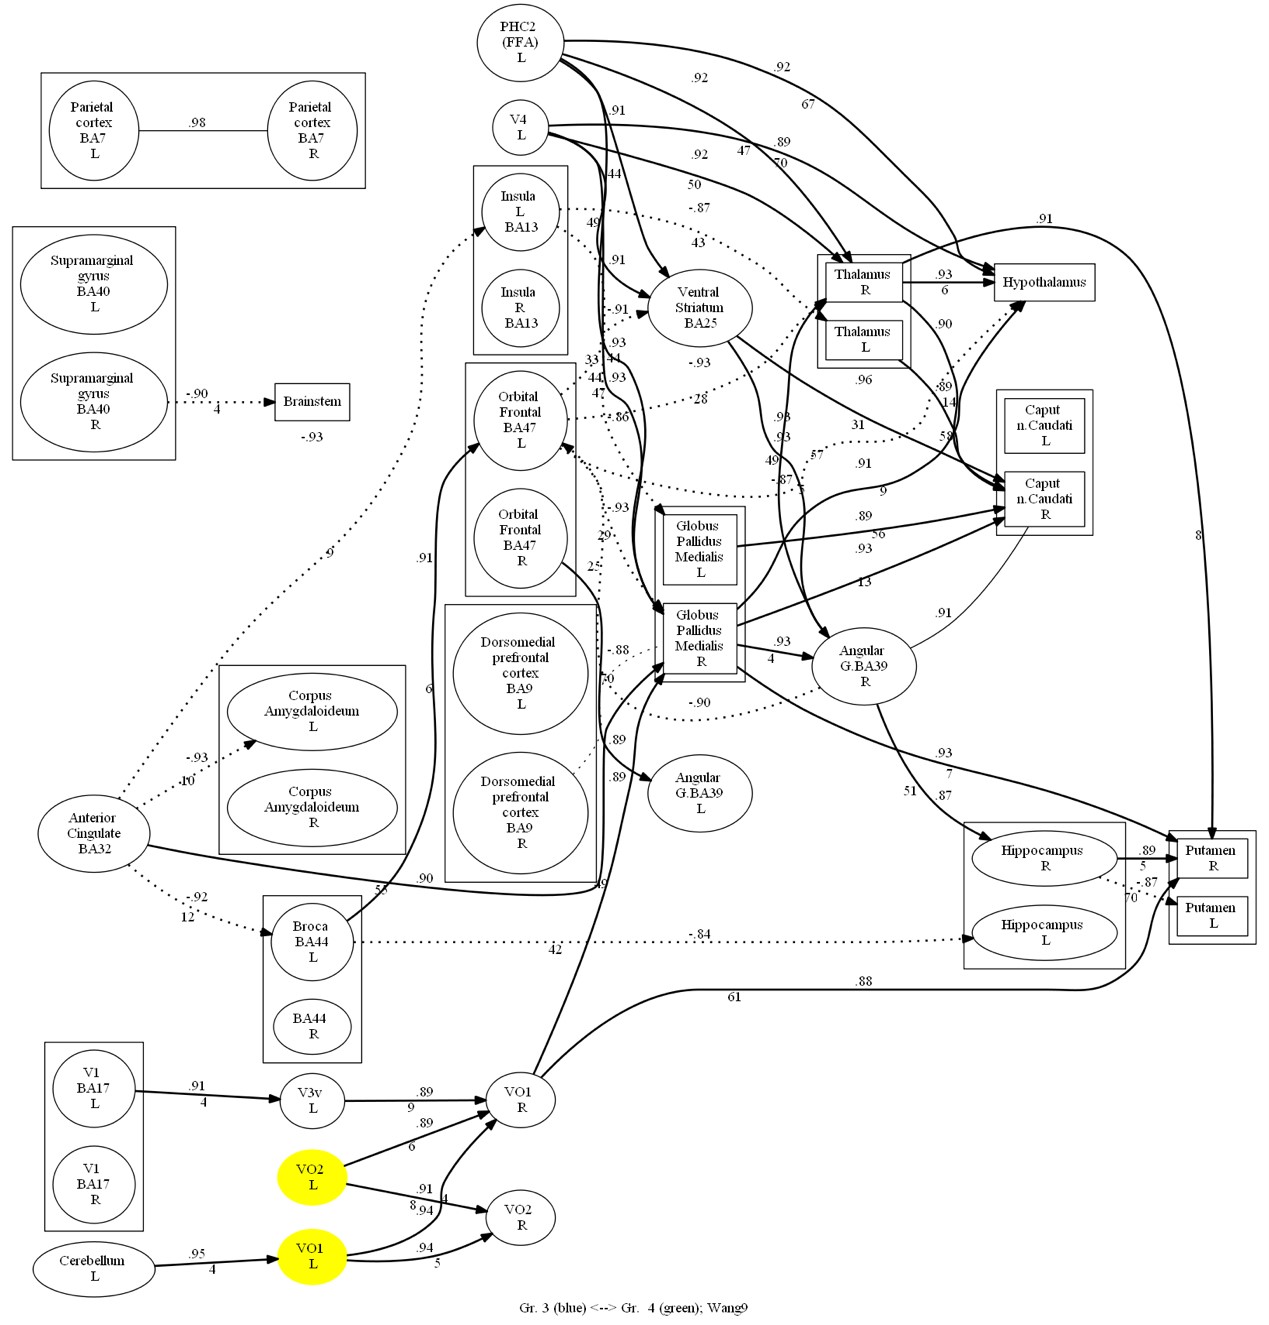
Fig. 8. Comparative oriented connectivity graph of the studied brain structures of Chinese participants recognizing Chinese faces (CF) and Russian faces (RF) in the face recognition task. VO1 L and VO2 L were highly activated in Chinese observers when recognizing both Chinese and Russian faces
Discussion
First of all, Russia is a country that straddles the Eurasian continent and may be influenced by both Eastern and Western cultures. Since eye movement experiments in Russia (Ananyeva et al., 2016; Menshikova, Krivykh, 2017) show that most Russians recognize faces in a manner similar to that of “Westerners” in the literature, we can at least assume that Russians are more inclined to be influenced by Western culture when it comes to face recognition. So, what exactly are the cultural differences between the East and the West? Why does Russia favor the West more than the East?
The first explanation is the collectivist-individualist distinction (Hofstede, 1980). Individualism is more often found in Western countries, while collectivism is more often found in Eastern countries. Generally speaking, collectivism is an ideology and spirit that advocates that the individual is subordinate to society and that individual interests should be subordinate to the interests of the group, the nation, the class and the country, and that its supreme criterion is that all statements and actions are in the interests of the collective. Individualism, which emphasizes individual freedom, individual interests and self-determination, is a world view that starts from the supremacy of the individual and focuses on the individual as the center of the world, society and interpersonal relations, and its core lies in the fact that all individuals are morally equal. According to this interpretive approach, it seems to account for differences in all perceptual phenomena including face perception, i.e., observers in collectivist cultures are more adept at using global strategies while observers in individualist cultures are more adept at using local analytic strategies (Blais et al., 2021; Nisbett et al., 2001).
Based on Hofstede’s original model, an index of individualism dimensions for different countries can be obtained on the website https://www.hofstede-insights.com/country-comparison-tool (accessed on 01 March 2025): China 43, and Russia 46. Russia scores higher on the individualism dimension than China, incorporates more individualism into its collectivism, and has gotten more individualistic in recent years (Knyazev et al., 2017). In addition, one theory of the origins of culturally differentiated agriculture traces it back to the level of germline development, claiming that the long-term driver of cultural differences is the timing of differences in Neolithic agriculture, rather than the more recent historical level of social development (Olsson, Paik, 2016), and this is in some way related to the distinction between hunters, pastoralists and farmers as described by Masuda & Nisbett (2001) as being related to economic and social factors. To put it in more detail, China’s typical monsoon agricultural civilization, the alluvial plains of the Yellow River and Yangtze River Basin, nurtured the production method of intensive farming. This mode of existence, which required observation of the heavens and coordination of water resources, shaped the holistic thinking of “unity of heaven and mankind”. Russia, on the other hand, straddles the cold-temperate forest-steppe belt, where the nomadic-hunting tradition east of the Ural Mountains coexisted with the trading traditions of the city-states in the European part of the country, creating a goal-oriented, pragmatic mindset. Consequently, Russians may be more inclined to the localized, analytical strategies of Westerners.
Subsequent explanations are more specific to the field of face recognition. The second account suggests that these different strategies for face recognition are driven by simple social norms. In daily communication interactions, Westerners (including Russians) prefer more eye contact (Argyle, Cook, 1976; Uono, Hietanen, 2015).
The third suggestion is related to the exposure to particular faces. It may be that the level of heterogeneity of localized features may be different due to the different available spatial frequencies of the faces contacted, resulting in differences in spatial frequency utilization between East Asians and Westerners (Blais et al., 2021). Consequently, the fact that Russians belong to the Caucasian race, and that most of the people they come into contact with are also of Caucasian race, would be able to explain well the way in which they perceive faces.
These explanations seem to explain the phenomenon of recognizing faces well, yet they do not explain well that such cultural differences are not limited to just faces (Kelly, 2010), so they remain a phenomenon and the underlying reasons for these explanations may still stem from deeper cultural factors.
If the hypothesis that Russians identify faces more in favor of Western Caucasians holds true, then we can better explain the ERP data we have obtained. To our surprise, during the perception phase, in the primary visual cortex and OFA areas of the right hemisphere, which were first activated, the Chinese and Russian participants showed completely different brain activity patterns, and the difference in positive and negative potentials at 100 ms might represent different attentional styles and face processing strategies. The positive potentials shown first in the Chinese participants, and the later evoked negative and positive potentials perhaps represent a change in their face-processing pattern after different cultural influences in the Russian locality (since the Chinese participants were all university students at Russian universities), and perhaps they perceived the whole first (corresponding to N100), and the details later (corresponding to P140, N180), and the perception of the details corresponded to the Russian participants’ P100 and N170 components, but their amplitude was not greater than that of the Russian participants. The additional activation of V4 R, VO1 R may indicate two regions that are more important for Russians to perceive faces. In addition, the greater amplitude of VO1R, V4R, and FFA R at P100 perhaps reflects a deeper depth of processing with higher spatial frequencies in the Russian participants. In the V4 R, FFA R regions, the slightly earlier N170 latency and greater amplitude of the Chinese participants may reflect better processing of the faces of both races in the middle phase.
During the recognition phase, Russians remained significant at P100 amplitudes, with greater P300 amplitudes in the additional highly activated right thalamus, right GPi, and ventral striatum, which appeared to be more task-relevant. These three brain regions are associated with advanced cognitive activity (Barón-Quiroz et al., 2021; Haber, 2016; Navid et al., 2022) and may represent the extra effort they put into the task. So, does this extra effort correlate with the race of the face?
According to general results from studies of the ORE, beginning in the first year of an infant’s life, infants consistently improve in their ability to recognize faces of their own race but do not consistently improve in their ability to recognize faces of other races (Sugden, Marquis, 2017). When a person encounters many faces of a particular type, important patterns of variation are extracted from the visual system (Calder, Young, 2005), creating a facial reference system (Sellal, 2022). That is why in our daily life, we feel that it is more difficult to recognize the faces of different races, just like for Caucasians, all Mongolian faces are “the same face”. In the present study, the behavioral results of the Chinese participants supported the other-race effect (Meissner, Brigham, 2001), but the Chinese participants did not show differences in the activated brain regions, probably because the Chinese participants were all university students in Russian universities, had more contact with Russians, and had stronger re-recognition abilities, and their brain recognition methods were already similar to those of native faces. Interestingly, however, in this study, Russian participants were more successful in recognizing other-race faces than same-race faces. In the early-activated OFA R region, P100 and N170 all have larger amplitudes at the same-race faces, and in the FFA region, P100 has a larger amplitude at the same-race faces, suggesting that in the early period, the same-race faces are still processed at a deeper depth. In the late activated brain regions, the extra activation of thalamus and GPi corresponding to P300 may represent the harder extraction of working memory (Donchin, 1981; Linden, 2005; Polich et al., 2007), which may be due to the fact that the Russian participants did not often see Chinese faces and the researcher was Chinese, thus showing a stronger interest and concentration on Chinese faces, which reversed the ORE (Hugenberg et al., 2010; Hugenberg et al., 2013). Exactly, the recognition difference was located in the middle-late phase (160-300 ms), perhaps related to motivation, attention, and stereotyping as described by social cognitive theory (Hugenberg et al., 2010; Hugenberg et al., 2013).
To summarize, ERPs show us the differences in brain electrical activity for perceiving faces in people from different cultural environments with an extremely high temporal resolution, which can well serve as an important method for cross-cultural research on face recognition. During the first 200 ms of perceiving faces, a high degree of cultural difference is manifested in the primary visual cortex and OFA areas of the right hemisphere. The P100 in face recognition clearly suggests the depth of early processing of faces, and might serve as an ERP indicator for studying cultural differences. Deep processing of same-race faces in the earlier period did not affect the shift in the other-race effect in the later period, and P300 in the thalamus and GPi was associated with the transformation in the ORE brought about by socio-cognitive factors. Although it is not possible to explain the sources of cultural differences, our study brings valuable phenomenological evidence to the cross-cultural study of perceptualization.
Conclusions
Our brains are responding to what we see in different ways. Electrophysiological and source localization evidence for cross-cultural face recognition suggests that (1) cultural differences in face recognition appear at a very early time in visual cortex; (2) a deeper processing of same-race faces in the earlier period does not affect the reverse of the other-race effect in the later period, and that activation of the thalamus and the internal globus pallidus, may be related to the reverse of the other-race effect brought about by motivation.