Introduction
Due to the increased frequency of children's use of digital devices (computers, laptops, tablets, smartphones), a growing number of researchers, teachers and education policy makers are concerned about how frequent use of electronic devices and the Internet may affect cognitive functions. Rather, the image of the negative consequences of frequent device and Internet use is spreading in the mainstream media. Just look at some of the headlines in the media: "Depression, laziness and addiction: How smartphones affect the brain. Scientists: smartphones dull human mental abilities"[Avdeeva], "The Internet instead of your convolutions. Scientists have found out how gadgets affect the brain"[Allan]. A new term has emerged, "digital natives", referring to a generation of children for whom the use of the Internet and digital devices is a habitual part of life almost from birth [Kirschner; 29].
While most publications with such scary titles are based on a retelling of published studies, researchers themselves are more cautious about drawing unequivocal conclusions about the harms of using digital devices or the Internet. Existing meta-analyses suggest that research findings on the association between frequent use of digital devices and impairment of certain cognitive functions are inconsistent [38].
On the one hand, some studies have found a negative correlation between certain types of Internet activity, frequent use of digital devices, and cognitive function [Levine]. For example, such a feature of Internet activity as multitasking has received quite a lot of research attention. It has been shown that children and adults who frequently use digital devices become accustomed to quickly switching from one web-page or task to another without immersing themselves in any of the tasks for a long time. This rapid and frequent switching from one task to another can put additional strain on the attention system. Numerous studies have shown that long-term multitasking is associated with impairment of cognitive functions, especially sustained attention or cognitive control [Levine; 28].
Cognitive control (also known as inhibitory control, attention control, or inhibitory function) refers to the ability to inhibit stimuli irrelevant to the task, not to react to extraneous stimuli (distractors) [Friedman]. In a broader sense, cognitive control may refer to the ability to self-regulate, the ability to follow instructions, focus on task performance, and maintain sustained attention without being distracted by extraneous stimuli.
Cognitive control is one of the components of executive function, which is one of the basic elements of working memory [31]. In this regard, many researchers discuss the importance of this function for successful functioning, including a child's academic achievement [Allan].
Studies have also shown changes in memory performance for children and adults who frequently use the Internet and digital devices [Loh]. It has been shown that people who use the Internet more frequently are better at recalling not the information itself, but the resources where that information is stored (e.g., web pages) [32]. Studies also show lower working and long-term memory performance in children with high multitasking scores [36].
At the same time, some researchers have not found a significant relationship between constant multitasking and deterioration of attention, memory, and other functions [Baumgartner; 30; 39]. Moreover, some studies have shown a positive correlation between practicing multitasking and cognitive functions [Alzahabi; Lui]. In particular, a study on an adult sample showed that adults (32-84) who frequently use a computer and practice Internet searching perform better on tests of cognitive control [35].
Studies also show the small to medium negative effects of multitasking and digital device use on different types of educational outcomes [Chen; Dempsey; Kuznekoff]. For example, in a longitudinal study on a large sample of 9-13-year olds, it was shown that students who had and used smartphones at age 9 showed lower math and reading scores later in life compared to students who did not have phones at that age [Dempsey, a].
Another type of activity discussed in terms of possible effects on cognitive processes is video games. Several studies have shown a positive effect of video games on a child's cognitive development. For example, it has been found that children who play video games, on average, show higher scores of cognitive control and are more successful on tasks in which it is necessary to ignore stimuli irrelevant to the task [Chisholm; Chisholm, a; 33]. Children who play video games were also more likely to perform better on tasks involving tracking multiple objects and switching between tasks [Green; 34].
Despite the increased number of studies on digital literacy, its formation, and development, as well as the increased number of studies on the correlation between the use of digital devices and cognitive functions, there is virtually no research that examines the correlation between digital literacy and cognitive functions, taking into account the frequency and specificity of the activity of using digital devices. Our study aims to fill this deficit.
The objectives of the study were:
- To assess the correlation between measures of cognitive control and types of digital device use for students in grades 7-8.
- To assess the correlation between digital literacy and indicators of cognitive control for students in grades 7-8.
- Assessment of the indirect effect of the influence of different types of activity with digital devices on digital literacy through indicators of cognitive control.
Methodology
Sample
The analysis includes data from 2,860 students in grades 7-8 from 102 schools in four regions of the Russian Federation (Stavropol Krai, Krasnoyarsk Krai, Tomsk Oblast, Saint Petersburg) participating in the Federal Project “Digital Educational Environment” (36% of 7th grade students). The share of girls in the sample was 48%, and the average age was 13.60 years (standard deviation 0.61). At the regional level, schools were asked to decide on the number of test participants, including the parallel classes and the number of classes.
Procedure and measurements
Students were tested on individual computers in a computer lab. First they took a verbal-spatial test, followed by a digital literacy test, and then they were presented with a letter flanker test. All testing was administered on a unified system and took 60 minutes to complete.
Digital literacy test
The test is aimed at measuring digital literacy. Digital literacy is a complex latent construct that includes a number of digital skills required to work in the digital environment, which is reflected in the definition - the ability to use digital technologies safely for oneself and others to search, analyze, create, manage information, communicate and work together to solve problems in the digital environment to meet personal and educational needs - and determines the approach to the development of the measurement tool [Avdeeva].
The digital literacy measurement tool was developed based on Evidence-Centered Design (ECD) [Mislevy], which involves finding observable evidence that reflects the construct being measured and evaluating alternative explanations for that observed behavior. This made it possible to model these correlations given their complex nature and to move [27] from the overall construct to the variables on the basis of which test items were subsequently created. Thus, the method of evidence-based argumentation allowed an evidence-based approach to the development of the instrument.
Scenario type was chosen as a form of assignment - assessment based on such assignments actualizes the student's experience with a narrative context in order to add a layer of meaning to the actions in the simulation of the digital environment. In contrast to classical forms [Dempsey; 40], such tasks allow for maximum authenticity. They simulate real-life situations, such as planning a trip to an unknown place, searching for necessary information on the Internet or creating a visualization in a multimedia program [Eshet-Alkalai]. This approach creates an environment conducive to capturing behavior that corresponds with the measured construct [Andrews-Todd] and in general, helps to solve the problem of intrinsic motivation of performance, which is especially important for tests with low stakes [Bergner; Hamari; Madaus; Nichols].
The test version consisted of 4 test items of varying difficulty. In the process of development, the principle of equal coverage was observed, so each task was aimed at assessing one or more components of digital literacy in such a way as to evenly cover each of the subcomponents presented in the frame [Avdeeva]. The unit of measurement is the observed variable rather than the task itself. Each scenario includes a number of subtasks, which the test participant solves using interactive simulations of programs, services, and environments.
At the set testing start time, participants were seated at their workstations and entered an individual account to log into the testing system. In qualitative research (cognitive laboratories) with the target audience, it was found that the interface of both the system and the tasks is user-friendly, clear, keeps attention where it is needed, and is not overloaded with graphic elements. Nevertheless, after logging in to the system, all participants were shown instructions for test tasks, which described, among other things, important elements of the interface that could later affect the assessment.
The tasks were presented sequentially on the computer screen. Each task began with a short text (instruction) describing the general context of the situation, which was necessary to bring the test task closer to real life. The next screen presented a work area - a desktop simulator with a toolbar located at the bottom, specific to each task. Test participants had the opportunity to skip a task (go through the “Next task” button), as well as display instructions multiple times (the “Show task” button), which made it possible to reduce the influence of irrelevant constructs, for example, the ability to memorize. During the performance of each task, several digital simulators were used with the possibility of switching between them (Fig. 1).
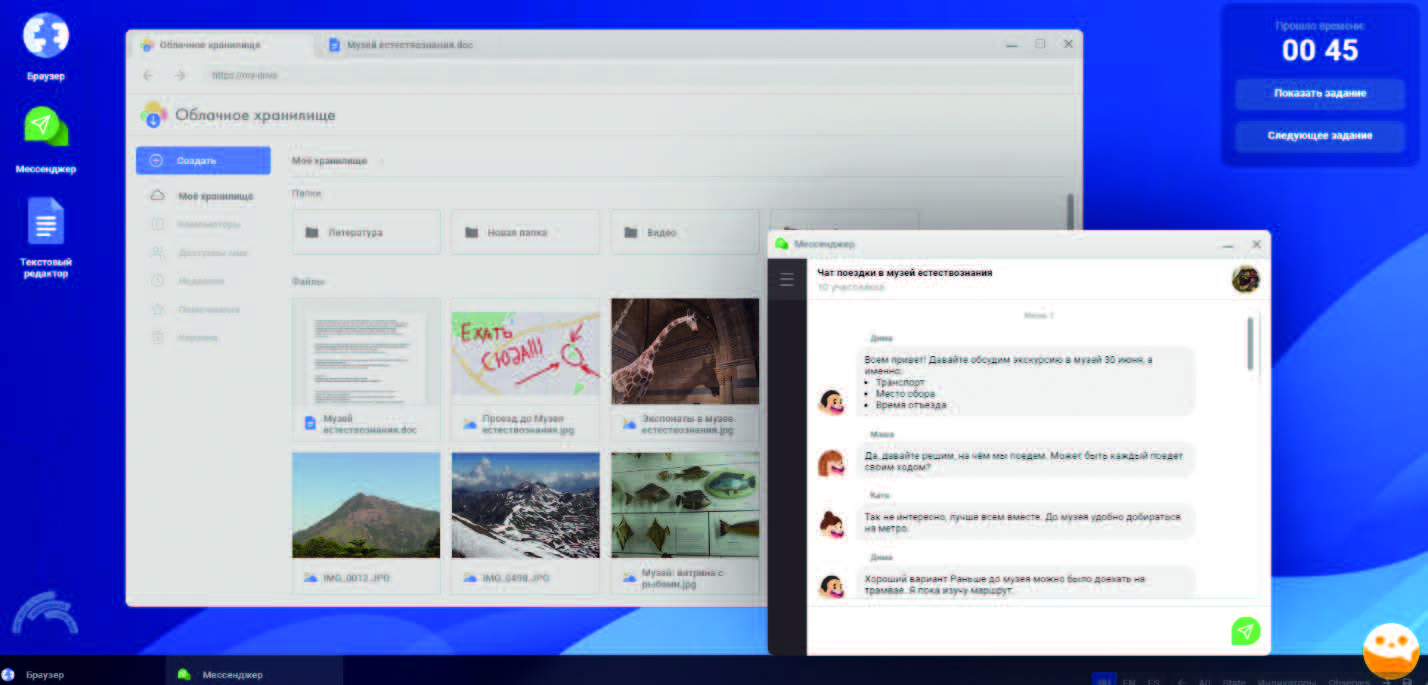
Fig. 1. An example of the workspace of the scenario task for measuring digital literacy. Used simulators: cloud storage (in the browser), messenger, text editor, virtual assistant
Cognitive control
Two tests were used to measure cognitive control (suppression function): the Letter Flanker Test [Eriksen] and a new test developed in the Stroop paradigm (verbal-spatial test). According to the theoretical model of cognitive control proposed by Friedman & Miyake (2004), the Letter Flanker Test is aimed at measuring distractor resistance, while the Stroop Test is aimed at measuring another factor of cognitive control - the ability to suppress the dominant stimulus.
Verbal-Spatial Test
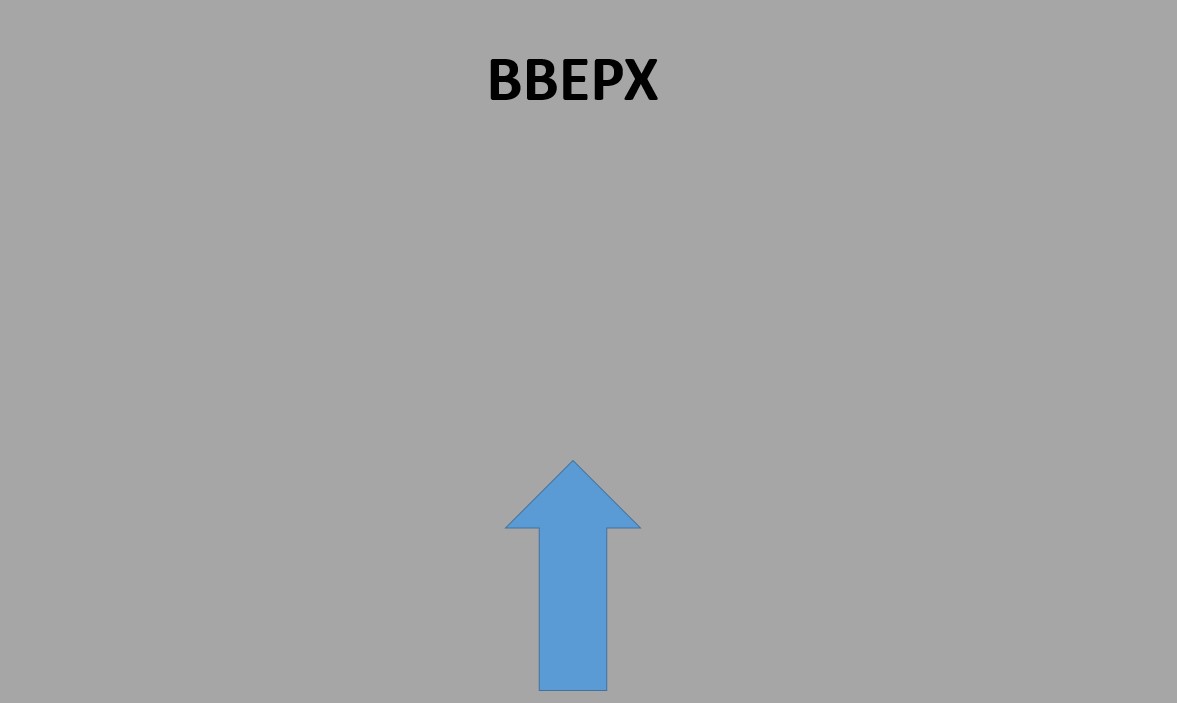
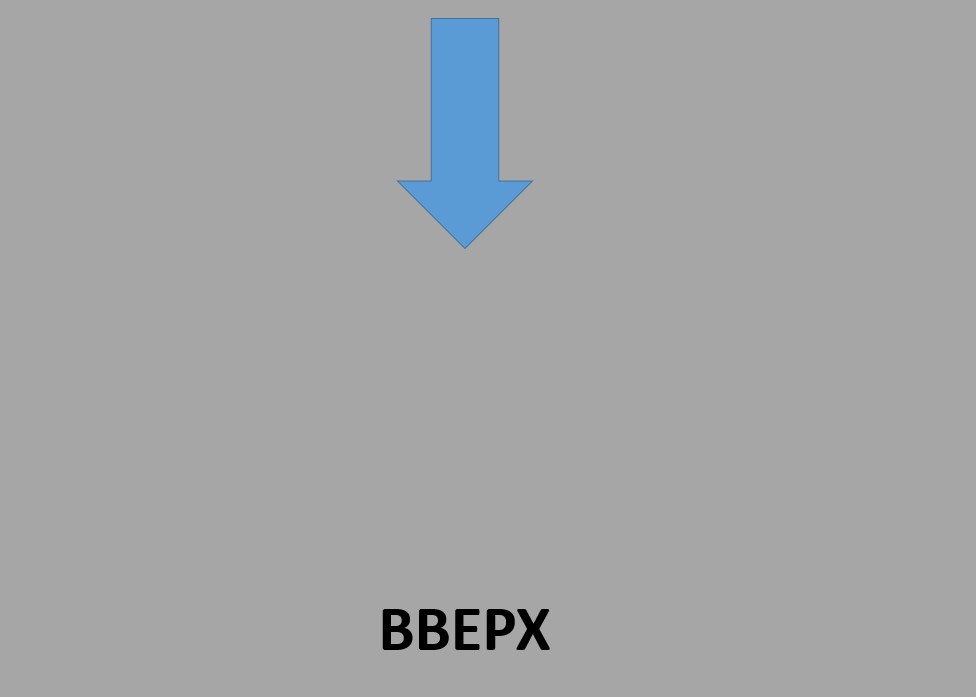
The test is designed in the Stroop paradigm, which is characterized by a combination of congruent and incongruent tasks [MacLeod]. In congruent tasks, the two parameters of each stimulus do not contradict each other, whereas in incongruent tasks, the two parameters of the task may require different actions. The test consisted of 4 blocks, each of which required the execution of a different type of instruction. Each block consisted of 12 tasks, the order of presentation of tasks within each block was randomized for each respondent.
In each block, the words "UP" or "DOWN" could appear on the screen. The words could be located at the top or bottom of the screen. In addition, up or down arrows could appear on the screen along with the words or separately (depending on the block and the type of instruction), which could also be located at the top or bottom of the screen. In the first block, the participant had to press the up or down arrow depending on the meaning of the word while ignoring the location of the word on the screen and the direction of the arrow (Figure 2). In congruent tasks, the meaning of the word and the part of the screen on which the word was located matched. If an arrow was also shown, then its direction also coincided with the meaning of the word (the word “UP” is shown at the top of the screen, the arrow is pointing upward). In incongruent tasks, the meaning of the word and the part of the screen on which the word was written did not match. If an arrow was added, it also did not match the meaning of the word.
|
|
 |
 |
 |
|
Congruent tasks |
Incongruent tasks |
||

Fig. 2. Examples of verbal-spatial test stimuli, block 1
In the second block, it was necessary to press the up or down arrow, depending on the direction of the arrow on the screen, ignoring the meaning of the word and the part of the screen where the arrow is located. In the third block, it was necessary to trace the part of the screen where the arrow was located by pressing the corresponding key (up arrow on the keyboard if the arrow on the screen was at the top of the screen and down arrow if the arrow was at the bottom of the screen). One had to ignore the meaning of the word and the direction of the arrow. In the fourth block, you had to press the up or down arrow on the keyboard, depending on the part of the screen where the word was located. In each block, there were 4 congruent tasks and 8 incongruent tasks.
Letter Flanker Test
The letter flanker test was originally proposed by Eriksen & Eriksen (1974). In the version of the test used in our study, participants were presented with a set of 7 letters (one letter in the center, 3 letters on the left and right (flank letters)). If the center letter was L or H, the participant had to press the left arrow key. If the center letter was E or P, the participant was required to press the right arrow key. In congruent tasks, the central stimulus coincide the flanking stimulus in terms of the required action (e.g., LLLHLLL or EEEPEEE). In noncongruent tasks, the central stimulus did not coincide the flanking stimulus (e.g., PPPHPPP or EEELEEE). There were a total of 32 tasks in the test, half of them noncongruent tasks. The tasks were presented to each participant in random order.
Calculation of indicators
In most studies, a measure of cognitive control is calculated as the difference in accuracy or speed between congruent and incongruent tasks [31]. Some researchers have noted the low reliability of such an indicator [Hedge]. As a possible alternative, some researchers suggest using standardized residuals obtained from a regression model. In this model, accuracy in incongruent tasks serves as the dependent variable, while accuracy in congruent tasks acts as the predictor [Friedman; Hedge]. Positive residuals indicate a higher level of cognitive control, particularly in terms of accuracy.
We used this procedure to calculate a measure of cognitive control. For the letter flanker test, we considered standardized residuals for accuracy. For the verbal-spatial test, given the rather high level of accuracy and low difficulty of the tasks, we used a combined measure of accuracy and speed - the rate of correct scores (RCS) [37]. The RCS is calculated by dividing the sum of correct answers by the total time spent on all tasks. This indicator represents the number of correct answers given per unit of time (in our case, one second).
Types of Internet activity and ways of using digital devices
To take into account the types of online activity and the ways of using digital devices, students were asked questions about different types of activity and the frequency of each type of activity. For example, how often this school year have you done something on a computer, tablet, smartphone: 1) Read on the Internet about something that interests me; 2) Watched movies, TV series, cartoons or videos on YouTube and other services; 3) Played games; 4) Made presentations or projects on school subjects; 5) Spent time on social networks (for example, VKontakte, TikTok, etc.); 6) Studied programming; 7) Took online courses (not to prepare for school).
The student had to choose one of four response categories: 1) Never; 2) 1-3 times a month; 3) 1-3 times a week; 4) every day or almost every day. The two middle categories (1-3 times a month and 1-3 times a week) are combined into one. After analyzing the answers, they were grouped into three categories: never, sometimes (1-3 times a month or 1-3 times a week) and every day.
Statistical approach
Multilevel regression analysis and multilevel mediation analysis were used to assess the relationship between frequency and types of Internet activity and digital device use, digital literacy, and cognitive control. Digital literacy scores were the dependent variable, cognitive control scores were the mediator, and digital device use scores were the predictors.
Variables for different types of activity in different models were used to avoid multicollinearity. Several regression models were analyzed to estimate the indirect effect of different types of activity. The first step analyzed how Internet and digital device use indicators are related to cognitive control indicators (mediator-dependent variable relationship).
In the second step, several regression models with included predictors of indicators of digital device use and cognitive control were tested. The regression measures from this model show a direct effect of digital device use characteristics. In addition, indirect effects (the product of the coefficients of the relevant measures from the first model and the coefficients of the cognitive control test scores from the second model) and standard errors for each indirect effect (bootstrapping method) were calculated.
Several variables were also included for a more precise assessment of effects: gender (0 - boy, 1 - girl), grade (0 - 7th grade, 1 - 8th grade), number of books in the house (0 - less than 100, 1 - more than 100) and resource availability index. The material situation index was calculated as the sum of respondents' answers to the question about what of the listed items they have in the house (e.g., a computer, a separate room, a music center, a dishwasher, etc.).
The variable "Use of computers at school" was also created to capture the specific characteristics of the educational environment. Students were asked to note how often teachers (except for computer science teachers) ask them to use computers and gadgets for the listed activities (at lessons, for doing homework, etc.), on a scale from 0 (never) to 3 (at every or almost every lesson). First, the sum of scale indicators for each student was calculated, then the aggregate indicator for the school as a whole was calculated.
The analysis was made using the Stata 17.0 program.
Results
Descriptive statistics
The average score on the digital literacy test was 0.05 logits (standard deviation of 0.89 logits), with a minimum value of -2.61 logits and a maximum value of 2.62 logits. Table 1 below provides descriptive statistics for cognitive tests. Cognitive control parameters were calculated as standardized residuals from a model in which accuracy or RCS in congruent tasks served as a predictor, while accuracy (or RCS) in incongruent tasks served as the outcome. Table 1 also displays the regression models coefficients used to compute standardized residuals.
Table 1. Descriptive Statistics for Cognitive Control Tests
|
Test |
Test Metrics/Parameters |
Parameters in the Regression Model |
||
|
Congruent Tasks
|
Incongruent Tasks
|
Standardized Regression Coefficient |
R2 |
|
|
Letter Flanker Test (Accuracy) |
0,72 |
0,69 |
0,73 |
0,53 |
|
Verbal-Spatial Test (RCS) |
1,09 |
0,75 |
0,70 |
0,49 |
The standardized residuals for the two tests exhibit a statistically significant weak correlation (r=0.10, p<.001). The weak correlation between the outcomes of the two tests confirms that they likely measure different aspects of cognitive control.
Descriptive statistics for various types of digital device usage are presented in Table 2.
Table 2. Descriptive Statistics for Types of Activities Involving Digital Device Usage
|
Types of Activities |
Never |
Sometimes |
Every day |
|
I read online about something that interested me |
8% |
49% |
43% |
|
I watched movies, TV series, and cartoons |
4% |
38% |
58% |
|
I played games |
6% |
41% |
53% |
|
I created presentations or projects |
23% |
73% |
4% |
|
I spent time on social media |
5% |
20% |
75% |
|
I studied programming |
50% |
44% |
6% |
|
I took online courses (not for school preparation) |
60% |
36% |
4% |
The results indicate that students in the 7th and 8th grades most frequently use digital devices for using social networks (75% reported doing this daily), watching videos (58% daily), playing games (53% daily), and reading (43% daily). At the same time, 60% of the students noted that they had never taken online courses or studied programming. 23% of the participants mentioned that they had never used digital devices for creating presentations and projects. It can be noted that these data may partially reflect the specificity of children's use of digital devices. Students in the 7th and 8th grades prefer to use digital devices not for educational purposes or for learning, but for searching and viewing information of interest to them, entertainment, and communication (i.e., for personal purposes).
The Correlationship Between Cognitive Control and the Use of Digital Devices
Furthermore, we assessed the relationship between the results of two cognitive control tests (verbal-spatial test and letter flanker test) and the frequency and methods of using digital devices. The results of the multilevel regression analysis are presented in Table 3.
Table 3. A Correlationship Between Cognitive Control Test Results and Types of Digital Device Usage (Results of Multilevel Regression Analysis)
|
Variables |
Verbal-Spatial Test |
Letter Flanker Test |
|
Coefficient (Standard Error) |
Coefficient (Standard Error) |
|
|
1 |
2 |
3 |
|
Fixed Effects |
||
|
Internet Reading: |
||
|
- sometimes1 |
0,17* (0,08) |
-0,11 (0,08) |
|
- every day |
0,22** (0,08) |
0,01 (0,08) |
|
Watch video: |
||
|
- sometimes |
0,19 (0,12) |
-0,28 (0,12) |
|
- every day |
-0,16 (0,12) |
-0,34 (0,12) |
|
Games: |
||
|
- sometimes |
0,10 (0,09) |
-0,01 (0,09) |
|
- every day |
-0,03 (0,09) |
-0,10 (0,09) |
|
Creation of Presentations and Projects: |
||
|
- sometimes |
0,10* (0,05) |
0,05 (0,05) |
|
- every day |
-0,07 (0,11) |
-0,12 (0,12) |
|
Social Networks: |
||
|
- sometimes |
-0,06 (0,10) |
0,01 (0,10) |
|
- every day |
-0,10 (0,10) |
0,06 (0,10) |
|
Study Programming: |
||
|
- sometimes |
-0,03 (0,04) |
-0,02 (0,04) |
|
- every day |
0,07 (0,09) |
0,16 (0,10) |
|
Taking Online Courses: |
||
|
- sometimes |
-0,06 (0,04) |
-0,05 (0,04) |
|
- every day |
0,04 (0,11) |
-0,16 (0,11) |
|
Gender (1 = girl) |
0,16*** (0,04) |
0,03 (0,04) |
|
Grade (1 = 8th grade) |
0,07 (0,05) |
0,04 (0,04) |
|
More than 100 books at home |
0,10* (0,04) |
0,04 (0,05) |
|
Material situation index |
0,02 (0,02) |
0,03 (0,02) |
|
Index "Use of computers at school" |
0,05 (0,03) |
-0,02 (0,02) |
|
Random effects |
||
|
Interschool Variance |
0,03 |
0,01 |
|
Intraschool Variance |
0,91 |
0,95 |
Note:1 - here and in other variables indicating types of activities, the reference group is the 'never' category; ***p<0.001, **p<0.01, * p<0.05
The analysis results indicate that among all types of activities, the frequency of reading information on the internet correlates with the results of the verbal-spatial test (those who read sometimes or every day have higher scores in the digital literacy test compared to those who never read), as well as with the creation of presentations (those who occasionally create presentations have slightly higher test scores).
As for the results of the letter flanker test, it only correlates with the frequency of watching videos. Students who reported watching videos sometimes or every day have higher scores on the letter flanker test, which can be interpreted as higher resistance to distractors.
It is also worth noting that girls have higher scores on the verbal-spatial test, while there were no differences between boys and girls in the results of the letter flanker test. The number of books in the house is also associated with the results of the verbal-spatial test.
A Correlationship Between Digital Literacy, the Use of Digital Devices, and Cognitive Control
Next, regression models were tested with digital literacy as the dependent variable. Prior to inclusion in the model, the variable was standardized. First, a null model (a model without predictors) was evaluated to assess the level of intra- and interschool variance and calculate the intraclass correlation coefficient. The intraclass correlation coefficient was found to be 0.23.
The model with predictors includes variables describing the types of digital device usage and cognitive control variables. Table 4 presents the results of the multilevel regression analysis for the model with predictors.
Table 4. A Correlation Between Digital Literacy, Cognitive Control Test Results, and Types of Digital Device Usage (Results of Multilevel Regression Analysis)
|
Variables |
Coefficient (Standard Error) |
|
1 |
2 |
|
Verbal-Spatial Test |
0,16*** (0,02) |
|
Letter Flanker Test |
0,07*** (0,02) |
|
Internet reading: |
|
|
- sometimes |
0,17* (0,07) |
|
- every day |
0,33*** (0,07) |
|
Watching video: |
|
|
- sometimes |
0,21* (0,11) |
|
- every day |
0,30** (0,11) |
|
Games: |
|
|
- sometimes |
-0,02 (0,08) |
|
- every day |
0,04 (0,08) |
|
Creation Presentations and Projects: |
|
|
- sometimes |
0.12** (0.04) |
|
- every day |
-0.20* (0.09) |
|
Social Networks: |
|
|
- sometimes |
-0,09 (0,09) |
|
- every day |
-0,14 (0,09) |
|
Studying Programming: |
|
|
- sometimes |
0,04 (0,04) |
|
- every day |
0,08 (0,09) |
|
Taking Online Courses: |
|
|
- sometimes |
-0,07 (0,04) |
|
- every day |
-0,30*** (0,10) |
|
Gender (1 = girl) |
0,13*** (0,03) |
|
Grade (1 = 8th grade) |
0,05 (0,05) |
|
More than 100 books at home |
0,10* (0,04) |
|
Material situation index |
0,07** (0,02) |
|
Index "Use of computers at school" |
0,10* (0,04) |
|
Random effects |
|
|
Interschool Variance |
0,17 |
|
Intraschool Variance |
0,71 |
Note: ***p<0,001, **p<0,01, * p<0,05
The analysis reveals that internet reading and watching videos are positively associated with digital literacy. Students who reported occasionally creating presentations have higher levels of digital literacy, whereas students who create presentations every day have lower levels of digital literacy compared to those who have never created presentations. Daily participation in online courses is also negatively associated with digital literacy.
It is worth noting that the results of both cognitive control tests are positively related to digital literacy. The analysis also indicates that Material situation index and the number of books in the house are positively associated with digital literacy, as well as the use of computers at school. On average, when accounting for other variables, girls have higher levels of digital literacy.
Analysis of indirect effects
At the final stage, indirect effects of types of digital device use were calculated. Since the analysis of indirect effects assumes the presence of a correlation between the predictor (use of digital devices) and the mediator (cognitive control), the analysis of indirect effects was carried out only for those predictors that showed a significant relationship with one of the tests of cognitive control (Table 5).
Table 5. Results of the analysis of indirect effects
|
Predictors |
Direct path |
Indirect path |
Overall effect |
|
Mediator – Verbal-Spatial Test |
|||
|
Reading (occasionally) |
0,19** (0,07) |
0,03 (0,02) |
0,23*** (0,07) |
|
Reading (every day) |
0,35*** (0,07) |
0,04* (0,02) |
0,39*** (0,07) |
|
Preparation of presentations (sometimes) |
0,13** (0,04) |
0,02* (0,01) |
0,15** (0,04) |
|
Mediator – letter test of flanks |
|||
|
Watching videos (occasionally) |
0,24* (0,10) |
0,02* (0,01) |
0,26** (0,10) |
|
Watching video (every day) |
0,31** (0,10) |
0,03* (0,01) |
0,34*** (0,10) |
Note: ***p<0,001, **p<0,01, * p<0,05
Analysis of indirect effects indicated that some activities may have indirect effects (either through the flanker test or the verbal-spatial test). In terms of direction, indirect effects enhance direct ones, but in all cases the indirect effects were very small.
Discussion
In this study, the results of a digital literacy test and two cognitive control tests, namely the verbal-spatial test (measuring the ability to suppress dominant stimuli) and the letter flanker test (measuring resistance to distractors), were analyzed. The primary objective of the research was to assess the correlations between the digital literacy test, cognitive tests, and certain parameters of digital device usage while controlling for some socio-demographic characteristics.
The results indicate that the use of digital devices for video viewing and reading is positively associated with cognitive test performance and digital literacy. However, different types of activities exhibit varying correlations with cognitive control factors. The ability to suppress dominant stimuli is linked to the frequency of reading information using digital devices. It is possible that children who frequently read online display lower impulsivity, although the study design does not permit causal conclusions. Conversely, there may be a reverse correlation, as children with higher resistance to dominant stimuli may exhibit lower impulsivity and, therefore, engage in more frequent reading with digital devices.
Regarding video viewing, the frequency of this activity is associated with higher levels of resistance to distractors. It is possible that during video viewing, children can concentrate on video content successfully, disregarding distractions. It is also possible that this skill can be transferred to other materials. But again, it must be emphasized that the research design does not allow us to draw conclusions about causal correlations and does not reveal the mechanisms of the discovered correlations. Further research with experimental designs is needed to explore these correlations in greater depth.
It should also be noted that some effects observed in previous studies, such as the positive impact of video games on certain cognitive functions, were not replicated in our study. Additionally, data did not confirm the negative effect of certain types of activities on cognitive functions. For instance, high activity on social media platforms showed no significant correlation with cognitive control or digital literacy.
Digital literacy also correlates with cognitive performance, although the effect size is small. The presence of a correlation between cognitive control and digital literacy may suggest the specificity of the test, indicating that tasks require the ability to sustain attention, ignore irrelevant stimuli, and so forth. On the other hand, this may also suggest that digital literacy is a complex construct associated with general cognitive abilities.
It is worth noting that the school environment is linked to the level of digital literacy. In schools where computer usage was higher on average, individual digital literacy scores were also higher. Additionally, the intraclass correlation coefficient for digital literacy scores was 0.23, indicating a moderate level of variation between schools in digital literacy test results. This finding is comparable to the level of variation observed in some academic achievement measures in international education studies [41]. It suggests that schools may have a certain impact on the development of digital literacy.
Funding
This study was conducted as a part of the strategic project “Digital Transformation: Technologies, Effectiveness, Efficiency” of Higher School of Economics development program granted by the Ministry of science and higher education of Russia “Priority-2030” grant as a part of “Science and Universities” national project. This research was supported by the National Research University Higher School of Economics under the Basic Research Program in 2022.