Introduction
Accurate measuring of complex latent constructs presents a challenge due to its abstract and multifaceted nature. In this context, computer-based assessments (CBAs) have gained popularity due to its ability to handle large and diverse data
[Andrews-Todd, 2021]. CBAs leverage process data — from simple inputs, such as a button press, to complex patterns of actions — to analyze test-takers’ activities that lead to specific outcomes
[Heinonen, 2011]. These actions are typically captured in event log files as process data. Although there is no standardized method for selecting and generating this data, it provides new opportunities for researchers who work with data obtained by assessment tools with tasks in a digitally enriched environment.
Examining a test-taker’s interaction with the elements of the test digital environment allows researchers to delve into the cognitive processes, emotions, motives, decision-making strategies, and problem-solving behaviors of test-takers, offering insights into their performance and construct understanding
[Ercikan, 2017]. These processes are responsible for generating observed variations in test scores. Thus, Yamamoto and Lennon suggested applying process data such as time spent during CBAs to identify response patterns that reflect data fabrication
[Yamamoto, 2018]. Yu and colleagues investigated the utility and fairness of different test-takers’ data sources for predicting college performance success
[Yu, 2020]. They found that combining institutional data and process data (total number of clicks and total time) led to the most significant accuracy increase in predicting both short-term and long-term test-takers’ success. Teig and colleagues expanded the amount of process data used by the colleagues and identified three distinct exploration behaviors — strategic, emergent, and disengaged — that also varied in terms of item accuracy
[Teig, 2020]. Moreover, process data can reveal patterns of response, such as speed-accuracy trade-offs
[Domingue, 2022], or suggest potential sources of measurement error, such as difficulties with certain types of items or response biases
[Zhang, 2023]. This information can be used to refine the scoring algorithms used to interpret test results and improve the accuracy and reliability of test scores
[Zumbo, 2017; Zumbo, 2023].
Unlike conventional information about the correctness of the answer, the study of response processes aims to capture the unique testing situation. Such possibilities provide a foundation for exploring broader aspects of digital literacy (DL) proficiency, a crucial component in today's digital age. DL is a complex latent construct that is defined as the ability to safely use digital technologies for searching, analyzing, creating, managing information, communication, and collaboration to solve problems in a digital environment to meet personal, educational, and professional needs
[Avdeeva, 2023]. DL may be reflected in behavior and reaction patterns that can take on a wide range of forms based on the diverse social practices that enable people to comprehend, communicate, and use information in digital contexts
[Li, 2024]. Researchers and global organizations in the field of education note the importance but challenge of its measurement
[Oliveri, 2019; Peng, 2022; OECD. Recommendation of, 2022; Laanpere, 2019; Vuorikari, 2022]. To address response process validity challenges during measuring DL, the researchers use CBAs, where detailed process data may be gathered and reveal additional validity evidence
[Cui, 2023]. For instance, Bartolomé and colleagues found that the participants’ response time and eye movement patterns varied significantly based on the scores they achieved during students’ DL assessment using CBA
[Bartolomé]. In another study by Li and colleagues, the authors collected object-, time-, and click-related process data from students’ interaction with the CBA tool and extracted feature variables related to DL in order to construct the measurement model
[Li, 2024]. However, to the best of our knowledge, none of the existing studies were focused at revealing the relationship between DL and process data collected during its assessment in the Russian sample. Thus, this study raises a research question: how performance induced by complex latent construct of DL correlates with invested time and the number of actions in the context of DL assessment?
Methods
Participants
The study involved 440 8th-grade schoolchildren (approximately 14—15 years old) from 15 secondary schools in Moscow, Russia. School staff made their own decisions about the number of test-takers, which resulted in a lack of additional descriptive characteristics for the sample. The schoolchildren completed the test individually and online, using school computers and sitting in small isolated groups. The test sessions were overseen by specially trained administrators, ensuring standardized administration.
Instrument
The computer-based DL assessment tool was developed based on an evidence-centered design methodology
[Mislevy, 2012] in a format of ten interlinked interactive scenario-based tasks. Such format offers more authenticity compared to classical test forms
[Wirth, 2008], because it replicates real-world situations that test-takers could face and creates a rich and immersive digital environment that captures behavior that matches the measured construct
[Wang, 2019]. Such types of tasks help to resolve the internal motivation issue of performance and increase the reliability of the results obtained, which is especially important for tests with low stakes
[Bergner, 2019; Hamari, 2016; Nichols, 2012]. Throughout the development process, the equal coverage concept was adhered to, meaning that every task was designed to assess DL components in a way that would fairly cover every subcomponent included in the theoretical frame: information literacy, computational literacy, technical literacy, digital communication, digital security
[Avdeeva, 2023]. Thus, the assessment in the digital environment is based on observable actions of test-takers that reflect the construct of DL being measured.
The test follows a story where a test-taker and their virtual classmate create a digital project for a contest. Each task is a self-contained scenario with some units of activity for a test-taker, which provokes observed behavior and outcome. The narratives of the tasks cover every stage involved: from finding the contest using a simulated search engine to submitting the developed project on the contest’s website in a specific format. During testing, each test-taker's performance trace is recorded in a log file.
Fig. 1 shows a fragment of the task, where a test-taker is instructed to choose a program that meets certain criteria. To do this, a test-taker needs to demonstrate the ability to analyze, interpret, and critically evaluate data, information, and digital content, considering available information about the authority, reliability, and credibility of the source (analysis of data, information, and digital content is a component of the information literacy in DL framework). Here, as a part of the broader program search task, a test-taker has to evaluate feedback from the users based on their reputation and credibility. After drawing a conclusion, a test-taker needs to reply to a virtual classmate in the messenger by sending the name of the chosen program selected from the drop-down list. The following process data is saved in a log file: 1) response time 2) and the number of clicks, including scrolling produced and clicks in the messenger field to select a response. Moreover, the polytomous score (0, 1, or 2) that reflects the test-taker’s proficiency in evaluating the authority of the information source is assigned based on the chosen answer option (program) and is recorded in the same log file.

Fig. 1. Example of the unit of activity in DL assessment tool
Data Analysis Strategy
Analysis was conducted in R version 4.2.1 in package “lavaan”. During data preparation, all test-takers’ profiles with zero values for the response time and the number of clicks were deleted, as well as profiles with missing values for the obtained scores. As a result, the sample consisted of 426 students.
To address the aim, we applied the model proposed by De Boeck and Scalise within the structural equation modeling framework
[De Boeck, 2019]. For the purposes of this study, we decided to analyze data collected only from units of activity that call for the demonstration of cognitive skills linked to analysis of data, information, and digital content. For each unit of activity, we considered the following indicators: 1) the score that was obtained based on predefined evidence rules related to the digital literacy behavior, 2) the time spent from the moment the stem was presented till the moment the answer was sent, 3) and the total number of clicks made. The aggregated data from all the included into analysis units of activity was then categorized into three distinct factors: Performance, Time, and Action. The Performance factor includes scores obtained in the six units of activity; the Time factor includes the log-transformed numbers of seconds spent for completing each unit of activity; the Action factor includes log-transformed numbers of clicks taken by test-takers during each unit of activity. More parameters were added to the model to account for additional dependencies: residual covariances (correlations) for the Action indicators and the Performance indicators, direct effect of the Action indicators on the Time indicators, direct effect of the Performance indicators on the Time indicators. The diagram of the model is shown in Fig. 2.
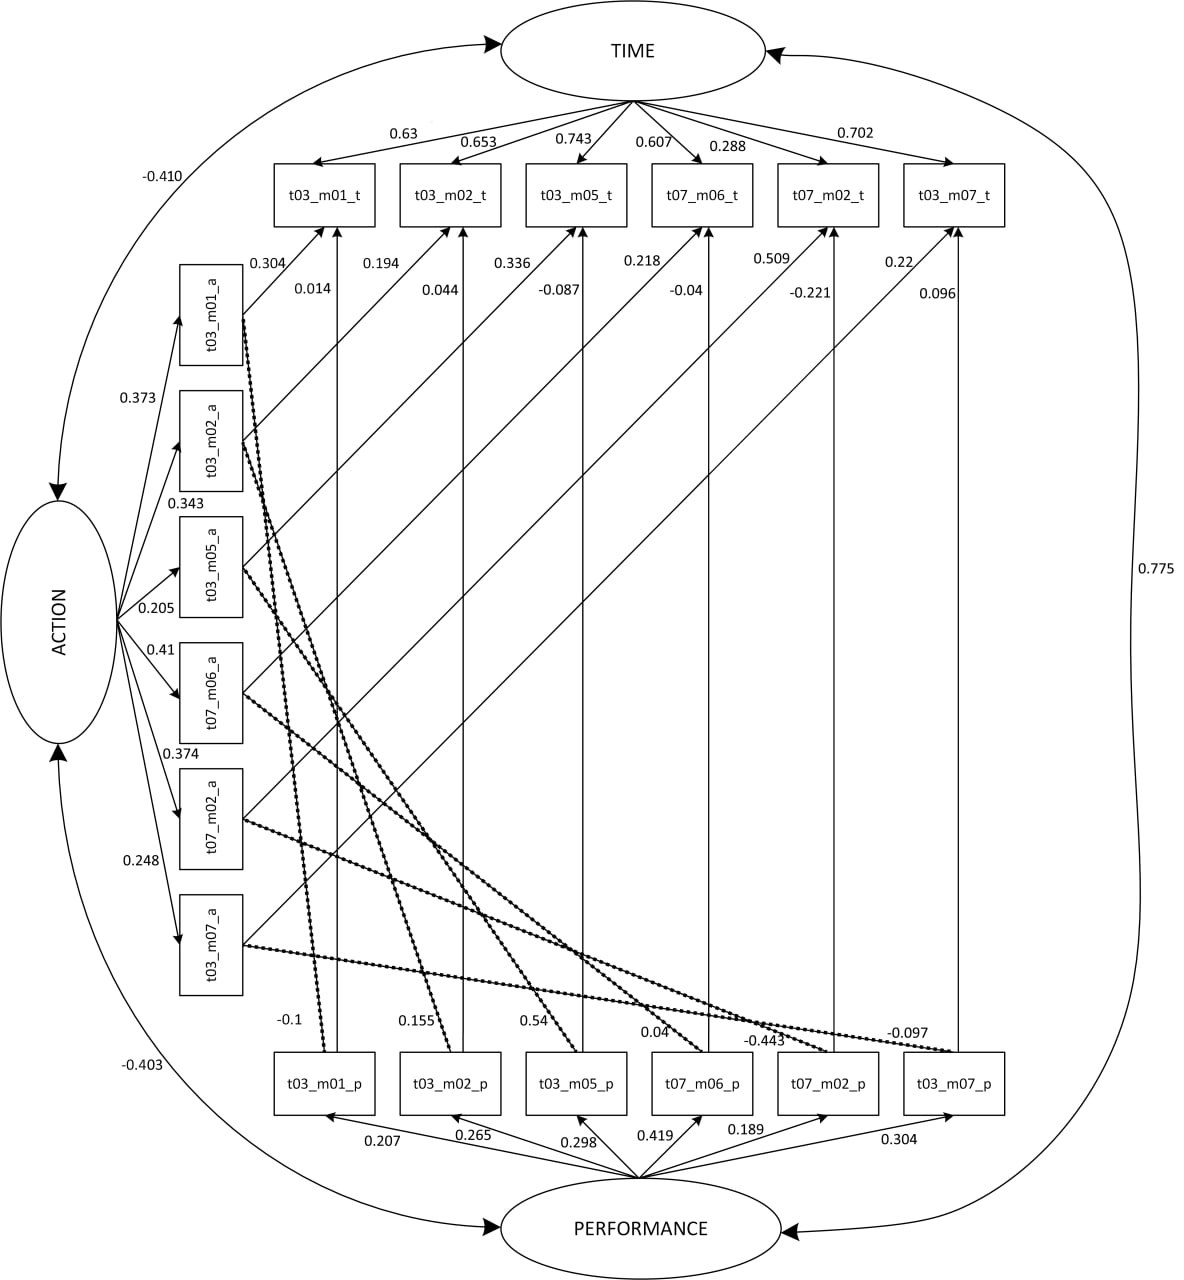
Fig. 2. Diagram for three-factor CFA model with additional dependencies
Note: each variable name follows the format IndicatorName_Factor. For example, the time spent on completing a unit of activity containing indicator t03_m02 is denoted as t03_m02_t; “→” — direct effect; “- - -” — correlated residuals.
The construction of the mentioned model was carried out in three distinct steps. Firstly, a separate confirmatory factor analysis model was constructed for the Performance factor to ensure the internal structure of the scale. Secondly, the three-factor model without dependencies was specified. Lastly, additional dependencies described above were added to the model.
To estimate the models’ parameters, the Robust Maximum Likelihood (MLR) estimator was used to account for the non-normality of the data
[Vuorikari, 2022]. The model fit was assessed according to the following goodness of fit indices: Comparative Fit Index (CFI)>0,95; Tucker-Lewis Index (TLI) > 0,95; Root Mean Square Error of Approximation (RMSEA)<0,06
[Hu, 1999].
Results
Confirmatory one-factor model for the Performance factor showed a good fit to the data (CFI=1; TLI=1; RMSEA=0). Standardized factor loadings ranged from 0,196 to 0,595 and were significant (p<0,05). Thereby, we can use it in the further analysis to investigate the relationship between the Performance, Time, and Action factors.
Then, the three-factor model without dependencies was estimated and showed a poor fit with the data (CFI=0,548; TLI=0,476; RMSEA=0,096). Three-factor model with dependencies demonstrated improved model fit (CFI=0,966; TLI=0,954; RMSEA=0,028). Model comparison using Scaled Chi-Squared Difference Test confirmed that the model with dependencies has significantly better fit (χ2(18)=510,65; p<0,05). For the latter model, standardized loadings of all the Performance, Time, and Action indicators were significant (p<0,05; Tab. 1).
Table 1
Standardized factor loadings in the three-factor model with dependencies
|
Indicator
|
Standardized factor loading
|
|
the Performance factor
|
|
t03_m01_p
|
0,207*
|
|
t03_m02p
|
0,265*
|
|
t03_m05_p
|
0,298*
|
|
t03_m07_p
|
0,304*
|
|
t07_m06_p
|
0,419*
|
|
t07_m02_p
|
0,189*
|
|
the Time factor
|
|
t03_m01_t
|
0,63*
|
|
t03_m02_t
|
0,653*
|
|
t03_m05_t
|
0,743*
|
|
t03_m07_t
|
0,702*
|
|
t07_m06_t
|
0,607*
|
|
t07_m02_t
|
0,288*
|
|
the Action factor
|
|
t03_m01_a
|
0,373*
|
|
t03_m02_a
|
0,343*
|
|
t03_m05_a
|
0,205*
|
|
t03_m07_a
|
0,248*
|
|
t07_m06_a
|
0,41*
|
|
t07_m02_a
|
0,374*
|
Note: «*» — Standardized factor loading was found to be significant at p<0,05.
Following the aim of the paper, we explore correlations between latent factors as well as patterns of additional dependencies (Tab. 2). Correlations between latent factors were as follows: for the Performance and Time factors: r=0,775, p<0,05; for the Performance and Action factors: r=-0,403, p<0,05; for the Action and Time factors: r=-0,410, p<0,05. Thus, higher performance requires more time and fewer actions. The Time factor is negatively related to the Action factor, which means that students who performed more actions were faster in providing answers. However, the additional direct effects of the Action indicators on the Time indicators were positive (ps<0,05). These additional dependencies are not explained by latent factors and can, therefore, be observed because they belong to the same indicators (students’ behavior within the unit of activity has similarities). All the other additional dependencies did not show a stable pattern and were only significant for certain indicators.
Table 2
Standardized effects for dependences in the three-factor model with dependencies
|
Indicator
|
Dependences
|
Standardized effect
|
|
t03_m01
|
t03_m01_p → t03_m01_t
|
0,014
|
|
t03_m01_p ~ t03_m01_a
|
-0,1
|
|
t03_m01_a → t03_m01_t
|
0,304*
|
|
t03_m02
|
t03_m02_p → t03_m02_t
|
0,044
|
|
t03_m02_p ~ t03_m02_a
|
0,155*
|
|
t03_m02_a → t03_m02_t
|
0,194*
|
|
t03_m05
|
t03_m05_p → t03_m05_t
|
-0,087*
|
|
t03_m05_p ~ t03_m05_a
|
0,54
|
|
t03_m05_a →t03_m05_t
|
0,336*
|
|
t03_m07
|
t03_m07_p → t03_m07_t
|
0,096*
|
|
t03_m07_p ~ t03_m07_a
|
-0,097
|
|
t03_m07_a → t03_m07_t
|
0,22*
|
|
t07_m06
|
t07_m06_p → t03_m06_t
|
-0,04
|
|
t07_m06_p ~ t03_m06_a
|
0,04
|
|
t07_m06_a → t03_m06_t
|
0,218*
|
|
t07_m02
|
t07_m02_p → t03_m02_t
|
-0,221*
|
|
t07_m02_p ~ t03_m02_a
|
-0,443*
|
|
t07_m02_a → t03_m02_t
|
0,509*
|
Note: «*» — Standardized factor loading was found to be significant at p<0,05; “~” — residual correlation between the Performance and Action factors; “→” — direct effect (the Action indicators on the Time indicators, the Performance indicators on the Time indicators).
Discussion
In this study, we examined the interrelationship between process data and performance on a digital assessment tool developed in the format of CBA. For a subset of indicators capturing proficiency in the analysis of data, information, and digital content, data for obtained score, time, and number of actions was collected and used to create latent models in the structural equation modeling framework. The initial one-factor model for the Performance factor showed a good fit to the data and optimal and statistically significant standardized factor loadings. The model containing three factors (Performance, Time, and Action) showed a poor fit to the data but improved significantly upon the inclusion of additional dependencies among behavior within the same indicators as was suggested by Boeck and Scalise
[De Boeck, 2019]. This underscores the complexity of factors influencing accurate DL assessment.
Following the aim of the study, special attention should be paid to the correlations between performance and process data. The significant positive correlation between the Performance factor and the Time factor is in line with the previous studies
[De Boeck, 2019]. This could imply that more time invested in processing leads to higher performance. However, this relationship might be attributed to the assessment instrument’s nature in our case. The tasks include extensive information to analyze (in the form of websites). Showing proficiency in such conditions is supposed to be time-consuming. Moreover, the variability in dependencies shows certain patterns only being significant for specific indicators that may reveal context dependency.
Conversely, the negative correlation between the Performance factor and the Action factor was observed. The digital environment in the assessment tool lacked obligatory interactive elements, such as the need for plenty of clicks. That potentially identifies a specific clicking pattern of individuals with low-ability. Such behavior may also reflect attempts to find additional information, hints; understanding of the digital environment functionality; or merely curiosity.
Another negative correlation between the Time factor and the Action factor implies that high levels of interaction with the digital environment do not necessarily lead to increased time spent. It may be explained by the diversity of the sample, including test-takers who prefer trial-and-error methods in situations when they are not sure about the correctness of the answer. However, these results raise questions about the interpretation drawn. The same result was observed with a different instrument measuring a distinct complex latent construct, leading us to believe that this is not related to the construct per se but rather to behavioral patterns in the digital environment
[De Boeck, 2019]. It suggests the need for further exploration of behavioral strategies and latent profiles of test-takers. This also may shed light on how modern children interact with large volumes of information in digital environments, hinting that such behavior might be a characteristic of this cohort. In general, the finding that higher performance needs more time and fewer actions enhances the understanding of DL assessment, implying that quicker response may not always be an indicator of efficacy, particularly if a lot of actions are taken.
Despite these insights, the study has limitations. The sample was restricted to 8th-grade students from Moscow, which may limit the generalizability of our findings. Moreover, due to the high level of anonymity of test-takers associated with a child sample recruited through private and public schools, it is impossible to check whether the findings are consistent in specific subsamples. Additionally, the instrument used has specific characteristics that do not universally apply to all DL assessment tools. Future research should aim to replicate these findings in diverse assessment settings and with varied age groups. Another limitation is that in the formed factors, the data used was not from all the units of activity. Moreover, adding finer-grained process data could reveal more about how test-takers manage and distribute their time and actions throughout the unit of activity. Further research might concentrate on breaking down time into different phases of answering or distinguishing click areas. Moreover, incorporating other process data, such as duration and frequency of pauses or changes in the answer option, may reveal the complex interplay between them and the performance. Additionally, the data analysis was restricted to linear relationships among the factors. Exploring non-linear dynamics could offer a deeper understanding of the complexities involved in the assessment.
Conclusion
This research demonstrates that the obtained score, response time, number of clicks are interdependent, as evidenced by the confirmatory factor analysis outcomes. The findings underscore the need for a comprehensive approach to assessing DL that accounts for these interdependencies. The relationships identified can be used to refine the DL assessment tool tasks, and potentially considered in the development of other instruments for measuring complex latent constructs using CBA. Moreover, educational environments that provide real-time feedback may be designed not only to consider the correctness but also the efficiency of time spent and actions.