Introduction
According to statistics, 81% of people under 34 years old use neural networks to work with information, and 14% of users have turned to neural networks for communication1. People's attitudes toward artificial intelligence (AI) are mixed: some feel uneasy about the development of this technology, while others are motivated to study neural networks, work with them, and delegate some of their tasks to technology. At the same time, people tend to regard AI products as their own. (Mayer, 2025).
How is the use of neural networks changing our lives? This is most clearly evident in the education system, which is made up of active users of AI thanks to students. It is argued that the learning process will soon change due to the fact that AI enables effective self-learning. Consequently, teachers will increasingly act as mentors who prevent mindless acquisition of information (Gocen, Aydemir, 2020). Perhaps this concern is one of the most serious – there is a risk of a decline in critical thinking among representatives of the digital generation who actively use AI tools, which is explained by the theory of cognitive unloading (Gerlich, 2025). In addition to critical thinking, creative thinking is also at risk, as neural networks are beginning to outperform the average person in this area (Bellemare-Pepin et al., 2026), which, in turn, creates the potential threat of their displacement from the arts, as is already happening, for example, in cinema.
Despite the benefits of AI, such as personalized learning (Yu, Guo, 2023) and increased student motivation (Yuan, Liu, 2025), it can be assumed that a significant change will occur in the near future, as the use of neural networks entails a new form of academic dishonesty. Students resort to their help to write various assignments (Subbotina, 2024), and teachers — to check them (Kuzmenko, 2025), which leads to a kind of confrontation between both sides of the educational process. In the context of social anomie (Meshcheryakova, 2012), an easy way to achieve success (including academic) will most likely lead to a sharp decline in academic motivation and a restructuring of the education system: “New technologies will create even greater differentiation between students. Smart students will use them with a degree of intelligence, that is, approaching the issue creatively. Those who were unsuccessful will widen this gap, since they will not test models for the task, but will use them head-on, without the ability to verify the quality of the answer or use the answer in practice” (Kazakova, Kuzminov, 2025, p. 23). A solution to this problem is possible through the joint efforts of society (Yu, Guo, 2023) – only then will AI become an assistant to humans, taking their development to a qualitatively new level.
The impact of AI on humans is a rapidly developing field of psychological science, but it can be stated that this development is still primarily theoretical. Empirical research is complicated by the lack of methodological tools.
The following methodological tools can be found in the field of psychological research:
- The General Attitudes towards Artificial Intelligence Scale. The scale has a two-factor structure: positive attitude and negative attitude (Schepman, Rodway, 2022).
- The Artificial Intelligence Assessment Scale, which “allows educators to choose the appropriate level of use of GenAI in assessment depending on the learning outcomes they want to achieve” (Perkins et al., 2024).
- The AI-Anxiety Scale, which includes anxiety regarding: AI training; AI similarity to humans; replacing humans with artificial intelligence; the possibility that technology could get out of control (Wang, Wang, 2019).
- The Trust in Automation Scale. Although this scale measures trust in automation, it is also applicable to working with AI (McGrath et al., 2025).
However, only one methodology dedicated to assessing attitudes toward technology can be found in Russian (Soldatova et al., 2021), which measures aspects such as technophilia, techno-rationalism, technophobia, and technopessimism.
It can be seen that research focuses on assessing attitudes toward AI as a new technology, while neglecting the area related to the motivations for its use. This fact, as well as the lack of methodological tools for studying the psychological aspects of AI use, determines the relevance and purpose of this study: to adapt a methodology for assessing motives for using artificial intelligence for the Russian population.
Research hypothesis: The Russian-language version of the methodology for diagnosing motives for using AI has satisfactory psychometric properties, and its factor structure coincides with the original methodology and expected value theory.
Theoretical framework
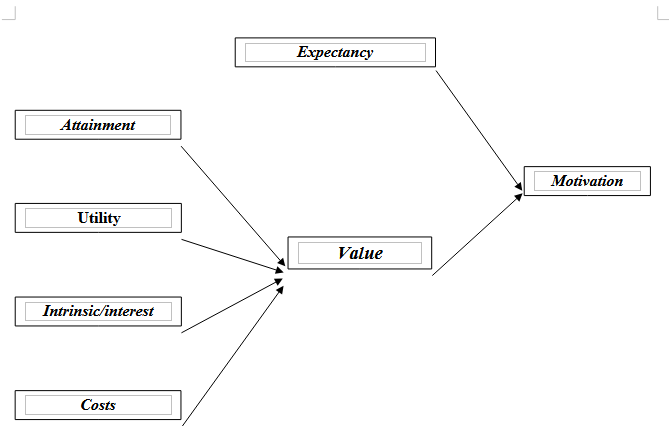
Selecting a theoretical framework to describe changes in human motivation in the AI era is a challenging task for researchers, given the large number of motivational theories in psychology. One of the turning points in the history of motivational development was the expectancy-value theory (EVT), which was formulated by J.W. Atkinson in 1964 and finalized in 2002 by J. Eccles and A. Wigfield (Eccles, Wigfield, 2002). The predecessor of EVT can be considered K. Lewin's field theory, which held that objects have a valence that can be revealed as subjective value for a person. Similarly, in modern EVT (see figure), motivation depends on the subjective value of the task or activity being performed and expectancy. In this context, expectancy is a person's belief that they can effectively solve a task; in other words, it is the expected success, which depends on a subjective assessment of their capabilities, previous experience, and social comparison.
The theory distinguishes four types of subjective value of a task (activity):
- Attainment value. This relates to a person's value system, determining the importance of achieving a goal or solving a problem.
- Utility value. This is determined by how useful what they are currently achieving will be to them in the future.
- Intrinsic/interest value. This is internal motivation, an interest in what they are doing.
- Expected resource expenditure (costs). Since any activity requires a resource, motivation for it depends on its size. A high "cost" of an activity can demotivate a person.
The "Artificial Intelligence Use Motives" questionnaire, validated in 2024 by Turkish scientists Yurt and Kasarci (2024), is based on EVT. The authors selected the questionnaire to adapt it for the Russian population.
Materials and methods
The study consisted of three sequential stages. During the first stage (August 2025), cross-cultural adaptation of the scale was conducted, including translation, back-translation, and expert evaluation, as well as pilot testing to verify the clarity and unambiguity of statement wording. During the second stage (September 2025), the translated version of the questionnaire was piloted on a sample of students from Moscow higher education institutions. During the third stage (October–December 2025), a representative sample was selected in compliance with ethical standards, including the voluntary informed consent of respondents.
Stage 1. The procedure of scale translation
To ensure cultural and linguistic equivalence of the instrument, the scale was adapted using a standardized forward and back translation procedure (Brislin, 1970). An expert forward translation, conducted by three specialists in psychology and management, and subsequent consensus evaluation resulted in an intermediate Russian-language version. Its back translation by an independent bilingual expert and comparison with the original confirmed the semantic consistency of the statements, which is a prerequisite for further psychometric validation.
Stage 2. Pilot testing of the scale
The pilot testing of the questionnaire was conducted on a sample of 20 students enrolled in psychology programs at a university located in Moscow. Based on feedback from pilot participants, the wording of individual statements was adjusted. The final version of the scale for data collection consisted of 20 statements.
Stage 3. Data collection
Previous studies have demonstrated that expectancy and activity value, which form the basis of J. Eccles and A. Wigfield's theory (Wigfield, Eccles, 2000), are decisive factors in career choice and trajectories (Eccles, Wigfield, 2002). Accordingly, the sample was drawn from students, who are active participants in the labor market and, due to their socialization during the development of digital technologies, are confident users of these resources.
A total of 368 students from secondary vocational education institutions (20,1%) and higher education institutions (79,9%) in Moscow and St. Petersburg participated in the anonymous online survey. The average age of respondents was 18,8 years (SD = 2,05). Women predominated in the sample—75% (n = 276), while men accounted for 25% (n = 92).
Questionnaires
The original version of the “Artificial Intelligence Use Motives” scale included 20 items designed to assess self-efficacy related to AI use and the subjective value of the activity or task (Yurt, Kasarci, 2024).
The following questionnaires were used to assess the convergent validity of the scale:
- The Career Engagement Scale, developed by A. Hirschi et al. (2014) and adapted for the Russian context by N.V. Volkova et al. (2026), consists of 10 items. It was used to assess three dimensions of this indicator: career planning (4 statements; Cronbach's alpha coefficient (α) = 0,87), career networking (3 statements; α = 0,84), and career self-development (3 statements; α = 0,73).
- The Technology Attitudes Questionnaire for Adolescents and Parents (Soldatova et al., 2021), which was developed taking into account the cognitive and emotional aspects of attitudes toward technology in adolescents and parents of adolescents aged 14–17, was used to assess technophobia (4 statements; α = 0,8), technophilia (8 statements; α = 0,82), techno-rationalism (4 statements; α = 0,64), and technopessimism (3 statements; α = 0,76). The scale consists of 19 items.
The choice of scales was based on research findings confirming a positive relationship between achievement motivation within the context of EVT (Wigfield, Eccles, 2000) and career choice (Eccles, Wigfield, 2002; Lauermann et al., 2017), as well as academic performance (Ivanyushina et al., 2016), which is associated with self-development and career success.
Statistical analysis of the data was performed using the appropriate libraries of the R programming language.
Results
After checking the questionnaires for correct completion and removing records with gaps, the normality of the data distribution was assessed via the values of asymmetry and kurtosis, the modulus of which did not exceed 2.
Factor structure
The questionnaire item correlation matrix was analyzed before conducting exploratory factor analysis to identify pairs with highly significant coefficients (greater than 0,8). As a result, one item from the “Intrinsic Value” subscale was removed.
Exploratory factor analysis (EFA) was performed to test the questionnaire's theoretical structure and item quality using the maximum likelihood method with promax rotation in the psych package of the R programming language. At this stage, items with low factor loadings (below 0,30) and significant cross-loadings were excluded; the theoretical fit of the items to the identified factors was additionally assessed. As a result, the item from the subscale assessing perceived resource expenditure, which showed the highest loading on the expectancy factor, was excluded. The remaining 18 items were distributed between the two factors, with a combined share of explained variance of 56.7%. The correlation structure of the data is characterized by a high proportion of shared variance (Kaiser–Meyer–Olkin test, KMO = 0,95) and a significant Bartlett's test of sphericity (χ² = 4218,73; df = 153; p < 0,001).
Confirmatory factor analysis (CFA) was performed using the lavaan package in the R programming language to assess the structure of the questionnaire and the theoretical model (see figure). The second-order factor model based on 18 items demonstrated an acceptable fit to the data (Satorra-Bentler χ²(128) = 335,08; CFI = 0,95; RMSEA = 0,066 (90% CI from 0,058 to 0,075), SRMR = 0,05). The scale structure and standardized factor loadings are presented in Table 1.
Table 1
Standardized factor loadings of the questionnaire items
|
Factors |
Subscales |
Items |
Factor loadings |
|
Expectancy |
1 |
0,500 |
|
|
2 |
0,798 |
||
|
3 |
0,801 |
||
|
4 |
0,798 |
||
|
Value
|
Attainment |
5 |
0,674 |
|
6 |
0,816 |
||
|
7 |
0,745 |
||
|
8 |
0,867 |
||
|
Utility |
9 |
0,765 |
|
|
10 |
0,761 |
||
|
11 |
0,736 |
||
|
12 |
0,717 |
||
|
Intrinsic/interest |
13 |
0,676 |
|
|
14 |
0,785 |
||
|
15 |
0,914 |
||
|
Costs |
16 |
0,795 |
|
|
17 |
0,767 |
||
|
18 |
0,809 |
||
Note: the item numbers correspond to the content provided in Appendix.
At the end of the analysis, the reliability indices of the subscales were assessed (Table 2). All statements had statistically significant standardized factor loadings of 0,5 or higher (see Table 1), and each latent construct accounted for at least 50% of the variance in the associated indicators, that is, the average variance extracted (AVE) for each subscale was greater than 0,5, which collectively confirms the convergent validity of the first-order factors (Cheung et al., 2024). The convergent validity of the second-order factor “Value” of the task (activity) was assessed indirectly, through the magnitude and significance of the first-order factor loadings. All standardized loadings were high (λ = 0,865–0,953, p < 0,001), and the confidence intervals did not include zero. In addition, the second-order factor explained a significant proportion of the variance in its subscales (from 75% to 90%), which confirms the convergent validity of the second-order construct.
Table 2
Descriptive statistics and reliability indicators of subscales (N=368)
|
Subscale |
Means |
SD |
AVE |
α |
CR |
|
Expectancy |
3,20 |
0,82 |
0,57 |
0,81 |
0,83 |
|
Attainment |
3,01 |
1,02 |
0,61 |
0,85 |
0,87 |
|
Utility |
3,39 |
1,03 |
0,56 |
0,83 |
0,83 |
|
Intrinsic/interest |
3,26 |
1,05 |
0,65 |
0,83 |
0,85 |
|
Costs |
2,71 |
1,04 |
0,63 |
0,83 |
0,83 |
Note: AVE - average variance extracted; α - The Cronbach's alpha coefficient; CR – construct reliability.
Based on previous research (Rönkkö, Cho, 2022), the discriminant validity between the first-order latent factor Expectancy and the second-order factor Value was confirmed based on the latent correlation (r = 0,743, p < 0,001) whose confidence interval did not include one [95% CI: 0,676; 0,810].
Validity of the questionnaire
The convergent validity of the questionnaire, along with an examination of its factor structure and AVE scores, was assessed through correlation analysis with theoretically relevant constructs that had previously shown significant relationships with the AI Motivation Scale and the use of digital technologies.
Table 3 presents Spearman correlations. All five dimensions of the AI motivation scale correlate positively with the three components of career engagement, as well as technorationalism and technophilia, with which the relationship is strongest. In most cases, technophobia and technopessimism show no significant correlations with the variables, or their relationships are weakly negative. In this way, only two statistically significant correlations were found: between technopessimism and intrinsic interest in using AI (r = -0,13, p < 0,05), and between technophobia and expectancy (r = -0,18, p < 0,001). Accordingly, the data from the correlation analysis confirm the convergent validity of the questionnaire.
Table 3
Correlation analysis
|
Career engagement and attitudes toward technologies Motives of AI use
|
Expectancy |
Attainment |
Utilities |
Intrinsic/interest |
Costs |
|
Career engagement |
|||||
|
Career planning |
0,35*** |
0,31*** |
0,29*** |
0,31*** |
0,29*** |
|
Career networking |
0,30*** |
0,27*** |
0,23*** |
0,22*** |
0,24*** |
|
Career self-development |
0,32*** |
0,31*** |
0,29*** |
0,25*** |
0,25*** |
|
Attitudes towards Technology |
|||||
|
Technophilia |
0,60*** |
0,64*** |
0,63*** |
0,65*** |
0,61*** |
|
Technopessimism |
-0,08 |
-0,08 |
-0,06 |
-0,13* |
-0,09 |
|
Technophobia |
-0,18*** |
0,04 |
-0,03 |
-0,06 |
0,04 |
|
Technorationalism |
0,36*** |
0,35*** |
0,38*** |
0,42*** |
0,34*** |
Note: «*» — correlation is significant at the 0,05 level. «**» — correlation is significant at the 0,01 level. «***» — correlation is significant at the 0,001 level.
It's important to note that motivation for AI use is determined more by positive factors (technophilia, techno-rationalism, and the three dimensions of career engagement) than by negative attitudes (technopessimism and technophobia). Accordingly, strategies for stimulating AI use should focus less on overcoming fears and more on fostering interest, confidence, and the meaningful use of AI in professional and career settings.
Discussion
Factor structure
As a result of the EFA and CFA, two factors were identified in accordance with the theory of J. Eccles and A. Wigfield (2000): expectancy and subjective value of the task (activity), the latter of which consists of four motivational components. The results obtained are generally consistent with the questionnaire proposed by Yurt and Kasarci (2024). However, as a result of the analysis, two statements were excluded, meaning our final version consisted of 18 items. Thus, our validated questionnaire contains 18 statements, distributed among five subscales for assessing motivation for using AI (see Appendix).
Validity
A literature review revealed a positive relationship between expectancy and subjective task (activity) values within the EVT framework (Wigfield, Eccles, 2000) and career choice (Eccles, Wigfield, 2002; Lauermann et al., 2017), as well as academic performance (Ivanyushina et al., 2016), which is related to self-development and career. Accordingly, a theoretical hypothesis was put forward about the relationship between the scale proposed by Yurt and Kasarci (2024) based on this theory and career engagement as a form of proactive career behavior (Hirschi et al., 2014), which is expressed through career planning, career self-development and the establishment of professional connections, which together influence a person's professional development (Volkova et al., 2026). Furthermore, the use of AI applications is closely linked to attitudes toward technology (Soldatova et al., 2021). Correlation coefficients showed significant positive correlations with positive variables (technophilia, technorationalism, and three dimensions of career engagement), and weak or no correlations with technopessimism and technophobia, confirming the questionnaire's validity. Thus, it can be concluded that the questionnaire is a valid and reliable instrument for use with a Russian-speaking sample, both in terms of its formal psychometric properties and in terms of its psychological focus and substantive content.
Practical implications
It is important to note that all five dimensions of motivation for AI use demonstrated moderately high positive correlations (r ≈ 0,54–0,75). Accordingly, an increase in one motivational component (e.g., practical utility or interest) is highly likely accompanied by an increase in others, and motivation for AI use can be viewed as a complex system. In this context, interventions aimed at increasing it, for example, through training programs, should be designed with the simultaneous enhancement of all five motivational components within the context of the EVT.
On the other hand, the use of AI is perceived not as an isolated technological practice, but as a career development tool, since all motivational indicators are moderately and significantly correlated with career planning, career networking, and career self-development (r ≈ 0,22–0,35). Accordingly, the promotion of AI applications will be more effective if they are positioned as a means of enhancing career prospects or as a resource for professional growth and expanding professional networks.
A positive emotional-value attitude toward technology significantly enhances motivation to use AI applications, which can be facilitated by developing a positive technological experience. Skeptical or anxious expectations about technology, expressed through technopessimism, generally do not play a decisive role in shaping motivation to use AI. However, technophobia, which is significantly and moderately negatively related to expectancy, reduces motivation by undermining confidence in one's ability to successfully use AI. Accordingly, training and support measures should be aimed at increasing self-efficacy, especially for individuals with high levels of anxiety.
Technorationalism is moderately correlated with all motivational variables (r ≈ 0,34–0,42) and is also strongly related to technophilia and negatively related to technophobia. Accordingly, a rational, balanced attitude toward technology through an awareness of its capabilities and limitations will support motivation to use AI without excessive optimism or fear.
Conclusions
- We see potential for further development of this research in the adaptation of existing international methodological tools, as well as in the development of new, domestic ones, allowing us to address the psychological phenomena caused by the emergence and development of AI. Our study demonstrated that AI capabilities expand and deepen the individual's motivational sphere, can be used to develop self-efficacy, and enhance the value of activity, which is a crucial resource for students and education in general.
- Psychometric adaptation. An adapted version of the “Artificial Intelligence Use Motives” scale for a Russian-speaking sample confirmed its reliability and validity. In accordance with the EV theory of J. Eccles and A. Wigfield (Wigfield, Eccles, 2000), the scale includes two factors: “expectancy” and “value” of the task (activity). The “Value” factor consists of four motivational components: 1) attainment value, 2) utility value, 3) interest value, and 4) expected resource expenditure or cost value.
- The results confirm the applicability of Eccles and Wigfield's (2002) theory, based on the expectancy of success and subjective values of activity, to the analysis of motivation for using AI in the Russian language.
- The scale allows for a differentiated assessment of motivational components, which may be useful for educators and career counselors. For example, low scores on the “Expected Resource Expenditure (costs)” subscale may indicate a lack of understanding of scenarios where AI skills may be useful and, therefore, require specific training.
- The adapted questionnaire can serve as a basis for developing motivation programs for students and employees of organizations aimed at enhancing the use of AI technologies. Accordingly, the methodological arsenal of practicing psychologists has been supplemented with another reliable and valid psychodiagnostic tool.
- Technorationalism is viewed as a protective factor, expressed in a rational, balanced attitude toward technology, as well as an awareness of its advantages and limitations, and acts as a stable factor in supporting motivation for the use of AI.
Limitations. The study is limited to a sample of students from major Russian cities. In the future, it is advisable to test the scale on other samples, including less populated locations and respondents of different ages. In addition, it is promising to further study the influence of a wider range of socio-demographic factors on the motivation for using neural networks.
1 Demina, K. (2025) Neural Networks: A Tool, Not Magic. VTsIOM News. URL: https://wciom.ru/analytical-reviews/analiticheskii-obzor/neiroseti-instrument-a-ne-magija (date of access: 21.01.2026)