1. INTRODUCTION
The harmony-seeking research for finding harmonious configurations between parts of a whole helps to create things in the real-world environment: buildings, towns, systems of settlements, works of art (such as music, painting, literature), any system resulting from a social activity (even if it is produced by one person in order to present it to the society). There are criteria of harmony based on intuition and art. The harmony sought in this research is indeed what can be called “perfectness”. However, there are no universally recognized quantitative parameters of perfectness [1, 3, 11].
We propose a solution to the problem of measuring and improving the visual quality of architectural facades [5, 6, 9]. The solution is based on evaluating the harmony of facades by measuring the areas of their details, which are parts or elements of a larger whole. If we arrange the areas of details in descending order and assign a rank to each member of the set, then for an ideal facade, the pairs, the rank of detail (N) and the area of detail (RN) must satisfy (coincide with) the distribution

where K parameter is a positive value close to 1.0, RN refers to the characteristic of objects with index (rank) N according to the descending order of the details, R1 is the size of the largest detail being a whole object, and N* is the number of the details which what can be revealed in the object as a whole. It is common in the scientific world that in order to describe many social situations, it is possible to use a similar law called Zipf’s law. To simplify Zipf’s law recognition, it can be plotted on a bi-logarithmic scale. In this case, if we designate

then Zipf’s law assumes the form of a linear function:

where K and B are positive constants.
The discrepancy фN between the theoretical value log (RTN) (which is equal) and the practical value log (RN) is the expression:

The sum of squares of partial discrepancies is functional Ф (K, B) of parameters. The minimization of Ф (by a well-known mathematical “least square” method) affords best values to K and B. After that Ф can be calculated and normalized by the number of details, and then the discrepancy Ф can be used for comparing different variants of the same architectural project, or for different projects. These ideas were implemented in a “Picture” tool-kit [Makagonov, а].
2. RESULTS OF SOME QUANTITATIVE EXPERIMENTS TO PROVE A STATEMENT THAT THE SENSE OF HARMONY IS INHERENT TO HUMAN BEINGS
First, we have made an attempt to prove the fact that the sense of harmony is inherent to human beings by giving the example of 30 recognized masterpieces of architecture belonging to
different historical epochs in different countries and continents, and calculated K, B, and Ф for them. As a result of this sampling cluster analysis, we have found that there are only three parameters which are not indifferent to grouping. They are:
-
Ф or MLS (General discrepancy of method of least square);
-
N is Quantity of architectonic elements (details), and
-
K is a Zipf’s law coefficient, i.e., an inclination of the straight line on a bi-logarithmic scale of Zipf’s law representation.
If we put for i=1, 2, and 3 the following notations for:
1 - temples, theatres, museums, palaces;
3 - private houses and
2 - intermediate cases,
then the results of calculations for sampling of different types of buildings can be expressed by the following tendencies:
K1 < K2 < K3;
N1 > N2 > N3;
Ф1 < Ф2 < Ф3.
The first and second sets of inequalities can be explained by a slow descent of details’ sizes for grand buildings and an incomparable multiplicity of details of large buildings as compared with small private houses. The third set of inequalities reflects the fact that people usually spend less money on private houses, whic hav shorter lifecycle, therefore it is hard to find masterpieces of privately-built houses of previous epochs.
Cluster 1
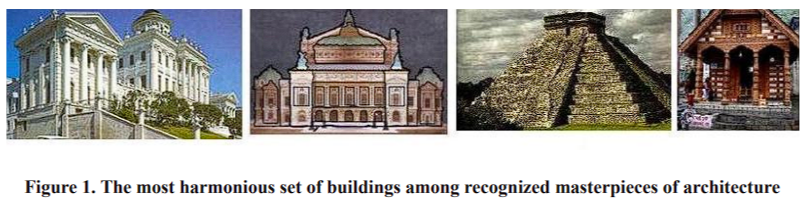
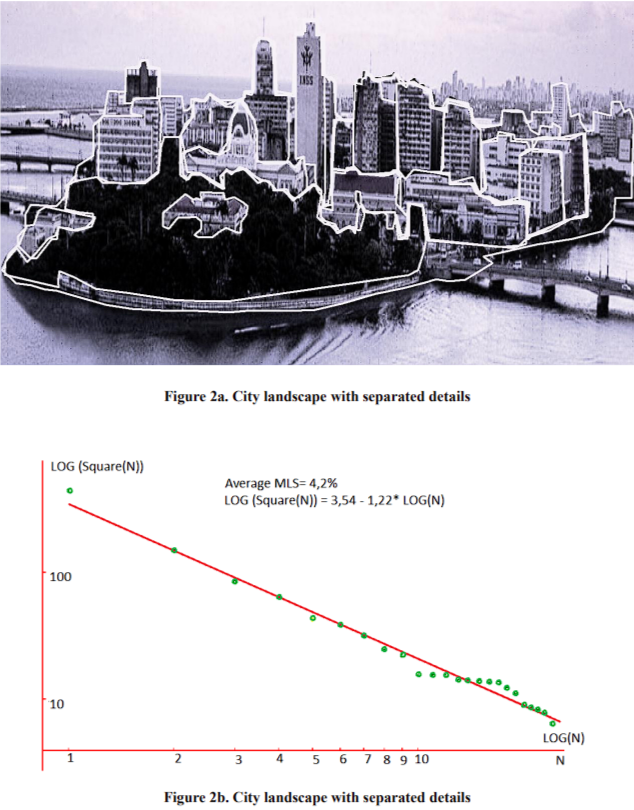
In Fig. 1, cluster 1 includes the most harmonious set of buildings extracted from the sample of 30 recognized masterpieces of architecture (from left to right): Pashkov House (Moscow, XIX century), Grand Opera (Paris, late XIX century), Maya’s Pyramid (about VII century), Temple in Laos (XX century). The results obtained are valid only for our sampling but in a way it confirms the fact that the buildings of the first type potentially exceed the perfectness of private houses. However, this example supports the fact that the human sense of harmony does not depend on geographical and cultural peculiarities, and historical aspects (the epoch of creation) of an architectonic work. This statement is true not only for facades of buildings but also for the city landscapes as a whole. For example, the cityscape details can also be separated and their distribution has also a very small disagreement (4.2%) with Zipf's law, as can be seen in Fig. 2a and Fig.2b. This disagreement is on the same level as for the famous buildings of the first cluster shown in Fig. 1.
To develop the idea that the sense of harmony is an inherent trait of human beings, we performed another set of experiments, focused on the age of a person who was of object’s harmony estimator. We organized the “City through the Russian childrn’s eyes” exhibition in a Mexican town and a master-class on the same opic for Mexican children. Details are presented in [Makagonov, 2006].
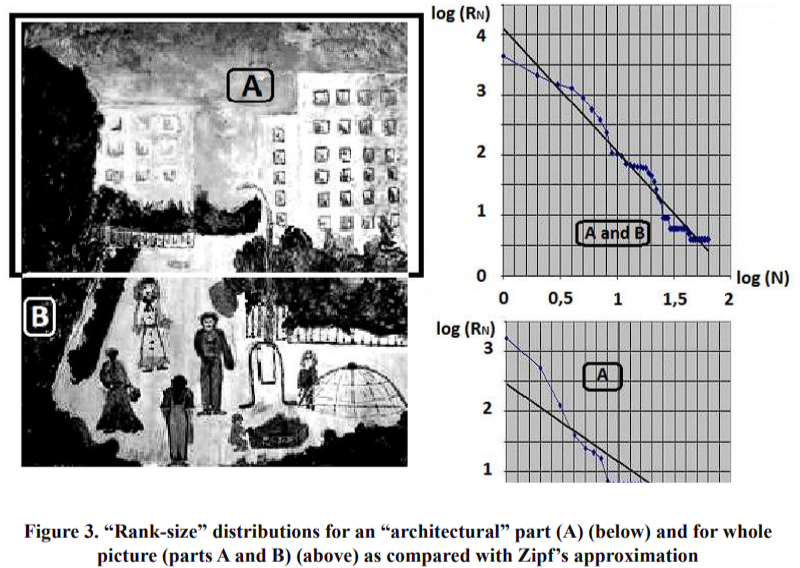
In Figure 3, we present Zipf’s analysis of a painting by a child aged 9, who was asked to paint a picture of an open space with modern urban architecture, classified as aggressive and boring by video-ecologists [Filin, 1998]. The young painter put some figures and details of middle size in the foreground. It can be seen that the whole picture (parts A and B) has a better concordance with Zipf’s law approximation than if we analyze only the “A” upper part of the picture.
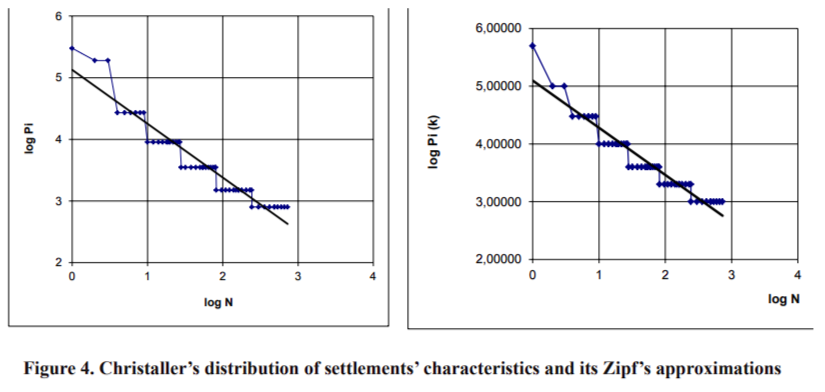
It is thought [Shuper] that Christaller’s self-organizing system of settlements is the final stage of perfectness of a system as a whole, but Zipf's distribution corresponds to the initial stage of development of a settlement’s system. We believe that Zipf’s presentation is also good for the final stage of settlements’ development. In Figure 4, one can see an acceptable concordance of multisteps of Christaller’s distribution of settlements’ sizes and the distribution of settlement population with Zipf’s approximations. (The one borrowed from a Christaller’s system of “central places” is shown in Figure 5).
We can present other cases to prove our assumption. The additional arguments are as follows: More or less the same procedure is used to estimate the integrity of a word list for a sublanguage (for certain domains). In this case there are a lot of words which occur only once, or twice, etc. These series of steps also work if we record the behaviour and distribution of certain words in a list of frequent words of any natural language. In fact, the words with absolute low frequencies have the step effect. But it is not the reason to refuse Zipf’ approximation of words’ distribution.
Today a classical Christaller’s distribution is assumed with corrections for disturbing the symmetry near large cities. Let us consider the distribution of details’ areas of a fractal “Sierpinsky gasket” from the farthest point of view (Fig. 6, left part) and from the point of view near the left down vertex (Fig. 6, right part). It can be seen that this image distortion reduces the discrepancy five times (from 13% to 2.7%), but it does not mean that the fractal image perception becomes worse. This reminds us of the famous saying that “beauty is a slight distortion of regularity”. Thus, we believe that Zipf’s law is a trait of perfectness.
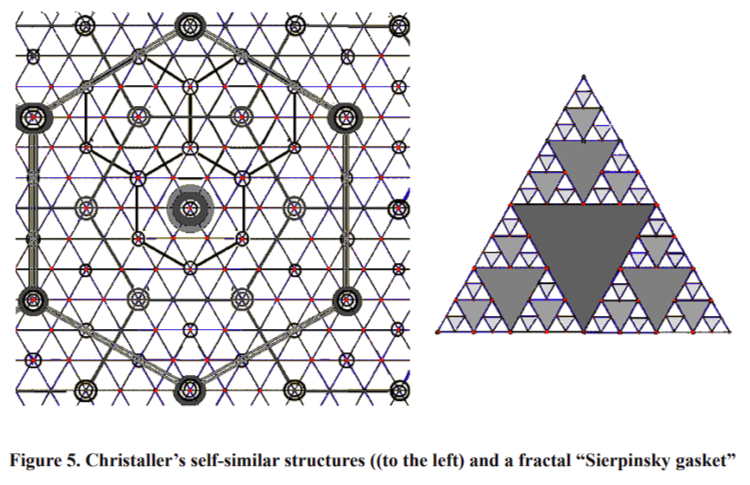
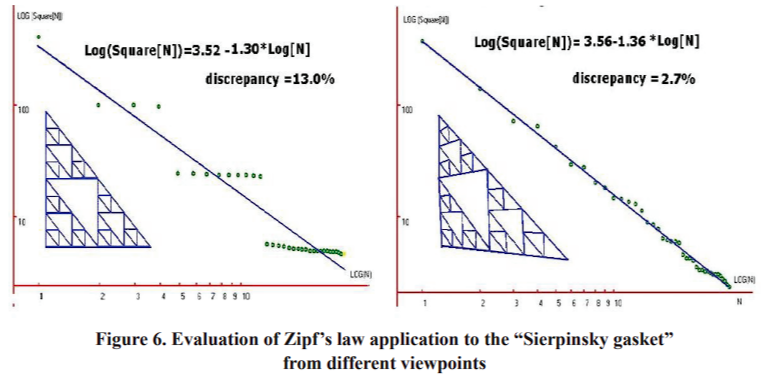
We examine the fractal “Sierpinski’s gasket” for one more reason: this fractal resembles a city or a building because the research has shown that both the city and the fractal are self-similar structures [Zarza, 1996].
By analogy with this example, it is possible to formulate a reverse problem: to search the coordinates from the viewpoint of the building facade that is more harmonious for the viewer (a visual perspective). This would allow a recommendation to be made to the architects to leave this area as a free space, to allow viewing the building with a high level of harmony.
3. SIMILAR DISTRIBUTION OF LINKS BETWEEN OBJECTS FOR DIFFERENT TYPES OF SYSTEMS
Another important feature is relevance of links between elements (parts, details) of the whole object of research. There is a close analogy between social systems that can be presented not only by the analysis of their elements’ distribution, but by the analysis of links between the elements. Three examples of this analysis are presented below: a city map, a building facade, and a list of words’ frequency calculated for narrow domain text collections.
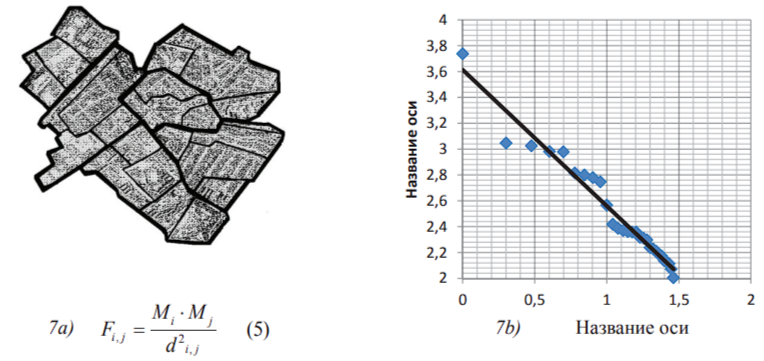
The first example: The distribution of the city elements’ areas and links’ intensity between these elements for the city of Scalitsa (Scalica), Slovakia has been made. The elements were revealed stepwise by the texture of surface’s picture (see Figure 7a) by means of “Picture” toolkit. Each element’s area, and the “centroids” (the centers of gravity) of the area (RN), of each (N) element have been calculated.
Ranked by an areas’ size, these elements are mapped to a bi-logarithmical plot: a logarithm of rank (N) is at the horizontal axis and a logarithm of an element’s size is at the vertical axis. As one can see in Figure 7b, the area-rank distribution of elements’ sizes fits the straight line, which corresponds to Zipf’s law formulas - a linear function on a bi-logarithmic scale.
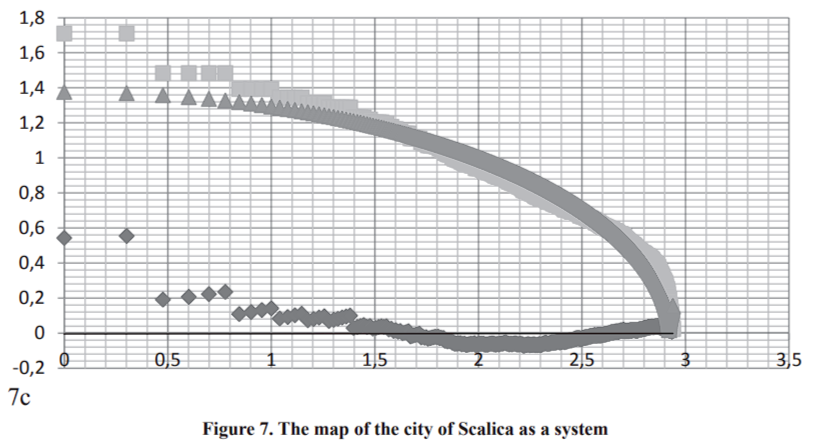
To represent links between all the elements, we need to involve some characteristics which are typical for geographical research but do not have so many large values and a lot of small ones. For example, the distance between the city elements does not satisfy this condition. Due to this, we have chosen a “gravitational” model, which corresponds to the formula (5) of any of two city’s elements with indices i and j and with areas Mi and Mj in Fig. 7a. Here Fi,j is Newtonian force of gravity of two masses of elements with indices i and j. Di,j is the distance between them. We put these values of F in descending order and assign each a value for its rank. Then we plot force against rank by using a logarithmic scale on each axis (Figure 7c).
As can be seen in Fig. 7c, the distribution of links between the elements can be approximated by an elliptical curve. The discrepancy of links’ distribution and points of ellipse is more than 0,1 only in 12 initial points, and more than 0,07 only in 24 initial points out of 870 points of curves.
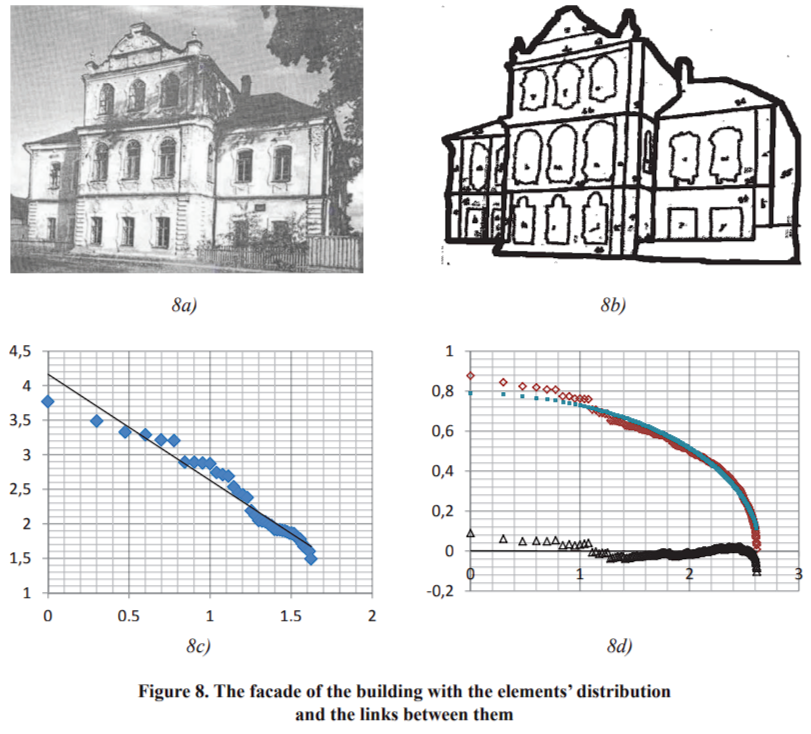
The second example: Likewise, we have obtained Zipf’s distribution of the details of the building facade elements. The building image is shown in Fig. 8a, its stepwise detail revealing is presented in Fig. 8b, the area-to-rank distribution is given in Fig. 8c and the links between the elements of the building picture are given in Fig. 8d. As can be seen, the behavior of samples is similar to that of the city map.
The third example: As it has been borrowed from a linguistic system, we first need to give some explanation. It is well-known that any word frequency list of a text document collection for a narrow domain perfectly satisfies Zipf-Mandelbrot law (formula 6).

Here FN is a word frequency with its rank; F*, K and A are constants. K is the power of decreased value frequency, which is the value practically equal to 1 for many languages. For big values of N, FN can be approximated by Zipf’s law:

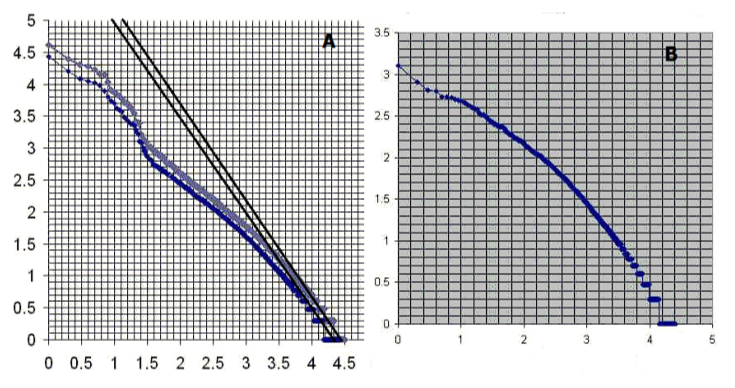
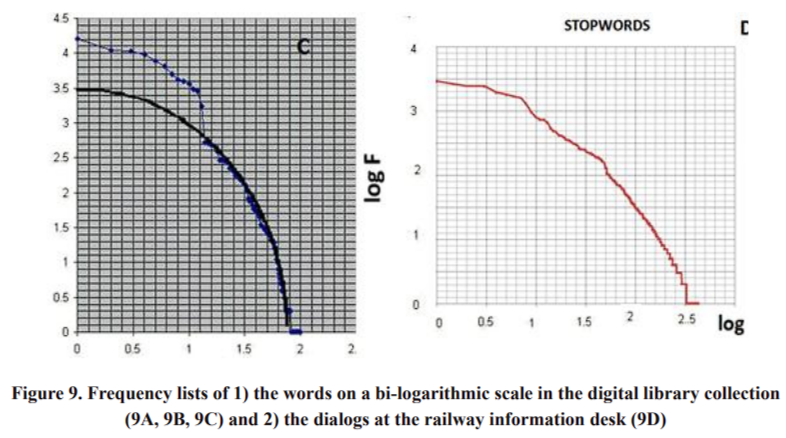
On the bi-logarithmic plot it corresponds to the fact that Zipf’s law is the inclined asymptote of Zipf-Mandelbrot law. The distribution of word frequency lists of two text collections is made on a bi-logarithmic scale and is shown in Figure 9.
On the plot 9A, the distribution of the word frequency from two samples is presented by a group of Spanish Language Newspapers (the grey curve), which serves as a list of frequencies of common language and a group of documents in the library of Mixtec Culture Portal (www.cumix. org.mx). It can be observed that the graphs cross both axes approximately in point 4.5, so that this graph resembles Zipf’s law as is shown in formulas (1 or 7). The coefficients K of every curve almost coincide as the right asymptotes of both curves are parallel. But in both graphs there is an irregular form of logarithms located in the horizontal axis log of words’ rank (N) from 0 to 1.5 which is not typical of Zipf or Zipf-Mandelbrot distributions. This range corresponds to the first 32 words in the frequency lists for both samples. Twenty seven of them coincide. The majority of the first 100 words in both distributions does not correspond to special topics, and the words do not have the meaning outside the context of a phrase grouping. They are auxiliary words, such as anaphors, connectors, modifiers, etc. A list of “stopwords” was compiled from these words for the digital library (bottom left in Fig. 9C). These “stopwords” were eliminated from a complete word frequency list. As a result, the distribution of domain-oriented dictionary [the DOD, 7] words was obtained in the Portal of Mixtec Culture collection of documents without the stop-words (upper right in Fig. 9B). The former are called keywords or autonomous words. In Fig. 9D, the distribution of stopwords for the text collection of dialog records at the railway information desk can be seen. It is evident that the stop-words’ curves have the shape of an upper right branch of elliptical curves (in the example presented in Fig. 9C, only the first 13 words of 300-400 ones do not fit them so much). There are examples of less discrepancy with the shape of ellipse for both text collections. One of them is demonstrated in Figure 9D.
Piotrovsky [Piotrovsky] proposed that if the number of elements (words and letters) in a language is limited, their distribution in a frequency list for a small sample has the form of ZipfMandelbrot law, but as the number of elements increases, the distribution on a bi-logarithmic plot will regenerate the curve with a vertical asymptote at the right end of the curve, and for the letter frequency list, the distribution on a bi-logarithmic plot takes the form of a circumference. The case of letters has been checked, and according to the results, the same hypothesis can be followed, when the circumference is replaced with an ellipse. The upper right branch of an elliptical curve is a closer approximation to the list of stop-word frequency. The list of the DOD words is never saturated, therefore it cannot be approximated as an ellipse, because in any domain knowledge it is necessary to involve new concepts to attract new words - concept words. A lot of them (near half of the list) are hapax legomena, i.e. words which occur only once in a text collection. For this reason, we can formulate the following criteria: if any numerous parts of a word frequency list have an elliptical distribution on a bi-logarithmic plot, then this part is a candidate to form a part of the stop-words list, and if it has the same slope of the right asymptote as the DOD distribution, then it should belong to the DOD.
Thus, any text collection in a restricted domain is a system, which needs both elements and links between these elements. The most important elements are subjects and objects, both are expressed by words which belong to the DOD. The links between the system elements are “auxiliary” parts of speech, or the so-called “stop-words”. It is shown that for typical complete systems the characteristics of their elements’ distribution fit Zipf-Mandelbrot law, and the characteristics of links’ distribution fit a curve of the elliptical form on a bi-logarithmic plot. The word groups which satisfy the condition of a small discrepancy with the elliptical distribution are added to the stopword list. The remaining part of the word-frequency list fits Zipf-Mandelbrot law more exactly, especially at its right lineal asymptote.
To sum up, similarly to other social systems, text collections of restricted domains contain words in the DOD which are elements in the system, otherwise stated, words which function as links between the elements in the system and words which belong to the super-system and some sub-systems. There is a close analogy between the object parameters’ distribution and their interconnections in urban planning and linguistic systems.
4. CONCLUSIONS
Taking into account the marketing goal of the urban area, it is useful to analyse the visual image of a city, or its parts, or even some buildings. A solution to measuring and improving the visual quality of architectural facades has been proposed. This solution is based on assessing the harmony of facades by measuring the discrepancy in the areas of facades’ details (organized through the «range-area” distribution) on the basis of Zipf’s law by using the method of least squares. It is possible to apply this method in order to make brief sketches to improve facades, blueprints, or architectural works built from the standpoint of harmony.
Zipf’s law can also be applied in the field of architecture and urbanism by analyzing either the city skyline as a whole, or its “clusters”. To achieve this, the ‘Picture’ tool kit can be applied to calculate the discrepancy between the city general appearance distribution of details by approaching this distribution with Zipf’s law. This method could also be applied to design facade brief sketches and to improve draft projects or already existing architectural masterpieces from a harmonic point of view. As a result, not only the cityscape proportion of the details can be analyzed, but also the balance among the details. This is important because the city is a system, and in a system there is a need to investigate both its elements’ size, and the link between them.