Introduction
The problem of personality changes has become a relevant research field over the past decade, encompassing both theoretical developments and methodological innovations for diagnosing personality changes (Shilmanskaya, Leontiev, 2021; Manukyan, Murtazina, Grishina, 2020; Bityutskaya, Bazarov, Korneev, 2021). The issue of the effectiveness of psychotherapeutic and other practical psychological work has remained actively debated for many decades.
Traditional approaches are based on comparing statistical measurements of a certain variable before and after a process considered to be the cause of the recorded changes, e.g., psychotherapy or psychological training. Researchers are attempting to approach the problem of personality changes with new tools and instruments, combining qualitative and quantitative methods. Recently, a special issue of the Journal of Counseling Psychology (Vol. 67(4), 2020) of the American Psychological Association was published, devoted to personality changes as a result of psychotherapy and psychological counseling, as well as new research methods.
Methodological approaches to studying personality changes and self-change vary widely, from studying qualitative data in phenomenological, discursive, and narrative approaches to creating special questionnaires that diagnose one or another aspect of personality changes (Grishina et al., 2021). In general, the existing toolkit for diagnosing personality changes relies on various methodological foundations and selectively diagnoses different aspects of change (Manukyan, Murtazina, 2019). The existing toolkit for diagnosing personality changes includes questionnaires measuring: life orientations (Korzhova, 2006); personal dynamism (Sapronov, Leontiev, 2007); styles of responding to change (Bazarov, Sycheva, 2012); subjective authorship of life (Shchukina, 2014); goals of personality change (Hudson, Roberts, 2014); potential for self-change (Manukyan et al., 2020); types of responding to change (Bityutskaya et al., 2021). Along with questionnaire methods, qualitative approaches — phenomenological and biographical methods — are used to deeply study the interaction of personality and environment in change processes (Manukyan, Murtazina, 2019). These methods allow for a comprehensive assessment of various aspects of personal dynamics — from readiness for change and behavioral strategies to conscious striving for transformation.
The potential of visual methods in the study of personality changes
One of the authors has already extensively discussed the current practice of using visual methods in psychological diagnostics (Shilmanskaya, 2020). Cultural-historical psychology, by its very nature, contains a rich potential for such practice. L.S. Vygotsky's idea of “non-classical psychology” assumes that psychological contents exist not only in the space of the individual psyche but also, in externalized form, in cultural objects and artifacts that can be used as tools for understanding human psychology.
The most elaborated approach to using visual materials for the mediated recording of attitudes towards significant aspects of experience or life in general is the psychology of subjective semantics by E.Yu. Artemyeva (1999). E.Yu. Artemyeva studied the subjective attitude toward objects, phenomena, and situations related to the subject of her activity, allowing experimental recording in the form of evaluative judgments or other attributive characteristics of those objects, phenomena, and situations.
Visual methods expand the possibilities for participation and cooperation of respondents within the research process. Existing evidence suggests that the advantages of visual methods mainly lie in their ability to facilitate and enrich communication with respondents.
Expanding the evidence base for the possibilities of visual methods will improve the researcher's informed ethical choice (Shilmanskaya, 2020).
For many years, research in counseling and psychotherapy was predominantly based on quantitative approaches. However, over the past two decades, researchers have increasingly recognized the enormous value of qualitative approaches for understanding the processes and outcomes of counseling and psychotherapy (Lutz, Hill, 2009). Data obtained from each approach can potentially be analyzed using qualitative or quantitative methods or a combination thereof.
We hypothesized that possible changes should manifest not so much in shifts in personality and situational-evaluative variables, but rather in changes in the qualitative parameters of the life development trajectory itself, which can be captured through a non-verbal technique that includes visual images of the current perception of one's own life (Artemyeva, 1999; Leontiev, Miyuzova, 2016).
Materials and methods
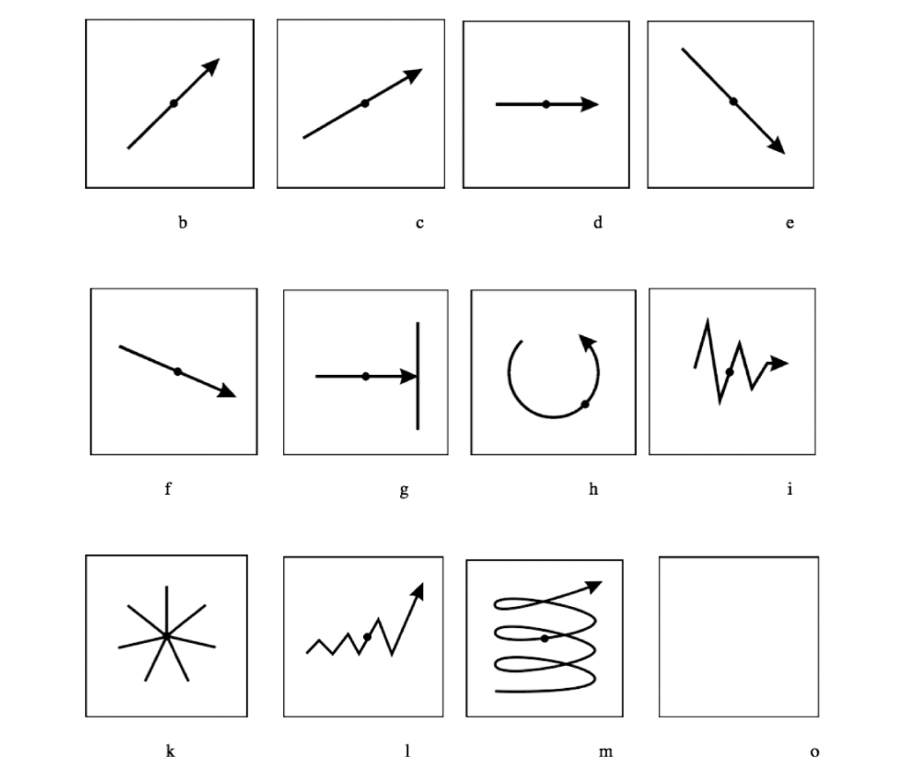
The “Trajectory” graphical method
In order to diagnose the subjectively perceived trajectory of individual development, the graphical method “Trajectory” was developed. The form of the method is a set of squares arranged on a sheet of paper, each containing a schematic symbolic representation of a particular life trajectory (ascending and descending lines of different steepness, zigzags, dead ends, spirals, etc.); the last square is empty. The squares are labeled with letters of the Latin alphabet (Leontiev, Miyuzova, 2015; Shilmanskaya, 2020). Respondents are asked to choose one of the images that best corresponds to their self-perception in their life, or, if none fits, to draw their own version in the last empty square (Shilmanskaya, 2020). In the initial version, the method included only linear images, but during sample expansion and analysis of drawings made in the empty square, non-linear images of the individual development trajectory were added. The final version of the stimulus material is shown in Fig. 1.
The use of visual data implies the implementation of a multimodal approach to the analysis of human experience as opposed to a unimodal approach based on the analysis of textual, verbal material (Shilmanskaya, 2020). Images act not only as memory prompts but can become integrals of experience, that is, bring together significant past events in relation to present events; images can represent an image-attitude toward one's own life or life period.
To test the “Trajectory” method, we set the task, firstly, to verify the stability of the individual choice of trajectory, and secondly, to investigate the existence of relationships between the choice of trajectory and personality characteristics. Based on pilot studies, assumptions were made about the relationship between trajec tory choice (differences in means between groups) and indicators of basic personality traits and other personality variables related to psychological well-being, reflexivity, perfectionism, loneliness experience, and life-meaning orientations to test the convergent validity of the new method.
Sample and procedure
The study involved 231 participants of the summer school of the magazine Russky Reporter (M = 20,2, SD = 2,96, 85,9% women). The majority of respondents had secondary (30,7%), incomplete higher (39,7%), or higher (29,6%) education. All respondents participated voluntarily (informed consent forms were used). The “Trajectory” method was administered twice (before and after participation in the summer school), but this article analyzes only the data from the first administration (before the school). Respondents at the summer school participated non-anonymously (to ensure confidentiality, they signed the forms with any pseudonym; real names appeared only on informed consent forms, which were submitted separately).
Measures
The following questionnaires were used to test convergent validity: “Big Five” (BFQ-2; Russian adaptation by E.N. Osin) (Osin et al., 2015); Satisfaction with Life Scale (SWLS: Diener et al., 1985 / Osin, Leontiev, 2020); Brief Differential Perfectionism Inventory (BDPI; Russian adaptation by A.A. Zolotareva, 2018); Differential Test of Reflexivity (DTR) (Leontiev, Osin, 2014); Differential Loneliness Experience Questionnaire (DLEQ: Osin, Leontiev, 2013); The Purpose-in-Life Test (PIL: Leontiev, 1992).
All participants completed the above battery of questionnaires twice: before and after participation in the Russky Reporter summer school, along with a brief demographic questionnaire. In this publication, we analyze the first battery of tests. Data processing was carried out using SPSS Statistics 29.0.
Results
Descriptive statistics. Mean values and other descriptive statistics for all study variables, as well as instrument reliability data, are presented in Table 1.
Sample distribution by trajectory type. Table 2 presents the frequencies of choice of each trajectory, as well as the average age and proportion of women in each group. Of the twelve initial images, trajectory “a” (straight line) was not chosen by any respondent; due to the small number of trajectories e, f, g, h, they were subsequently combined into one group (e–f–g–h).
Table 1
Descriptive statistics of variables (N = 231)
|
Scale |
M |
SD |
Cronbach's Alpha |
|
Extraversion (E) |
45,50 |
7,93 |
0,88 |
|
Agreeableness (A) |
50,83 |
6,50 |
0,87 |
|
Conscientiousness (C) |
42,77 |
8,58 |
0,87 |
|
Emotional Stability (S) |
35,49 |
10,27 |
0,91 |
|
Openness to Experience (O) |
62,40 |
7,05 |
0,86 |
|
Social Desirability (L) |
31,98 |
7,15 |
0,81 |
|
Satisfaction with Life Scale (SWLS) |
22,54 |
5,36 |
0,83 |
|
Noetic Orientations Test (NOT) |
102,15 |
16,84 |
0,82 |
|
Systemic Reflection (SR) |
40,25 |
5,42 |
0,78 |
|
Quasi-Reflection (SK) |
28,67 |
5,38 |
0,83 |
|
Introspection (FA) |
26,22 |
5,49 |
0,83 |
|
Normal Perfectionism (P_NORM) |
4,92 |
0,71 |
0,87 |
|
Pathological Perfectionism (P_PATO) |
4,09 |
0,91 |
0,82 |
|
General Loneliness (L_GEN) |
2,22 |
0,81 |
0,87 |
|
Communication Dependency (L_DCOM) |
2,40 |
0,88 |
0,86 |
|
Positive Solitude (L_POS) |
3,83 |
0,62 |
0,81 |
Table 2
Sample distribution across trajectory types (N = 231)
|
Trajectory |
n |
% of sample |
Age (M±SD) |
Women (%) |
|
b |
18 |
7,8 |
20,3±2,9 |
83,3 |
|
c |
19 |
8,2 |
20,1±2,8 |
84,2 |
|
d |
6 |
2,6 |
20,5±3,1 |
83,3 |
|
e |
1 |
0,4 |
21,0 |
100 |
|
f |
2 |
0,9 |
19,5±2,1 |
100 |
|
g |
3 |
1,3 |
20,0±2,0 |
66,7 |
|
h |
3 |
1,3 |
20,7±2,5 |
100 |
|
i |
25 |
11,3 |
20,4±3,0 |
88,5 |
|
k |
26 |
11,7 |
20,0±2,9 |
85,2 |
|
l |
49 |
21,6 |
20,2±2,9 |
86,0 |
|
m |
45 |
19,9 |
20,1±3,0 |
86,9 |
|
o |
34 |
14,7 |
20,3±3,0 |
85,3 |
Note: Trajectories e, f, g, h were combined into the group "e-f-g-h" (n = 9). The groups did not differ significantly by age (ANOVA, p = 0,31) or gender (χ², p = 0,47).
Analysis of differences between trajectory groups. Preliminary one-way ANOVA showed that the choice of trajectory can act as a factor influencing the distribution of certain traits and other personality variables. Variances for most measured variables were equal across the 11 trajectory groups (Levene's test Sig. = 0,012 to 0,38). Of the 12 proposed images, trajectory “a” was not chosen, so 11 groups were included in the initial ANOVA. After combining the small trajectories e, f, g, h (n < 4), the number of groups was reduced to 8. Pillai's criterion showed no significant differences between e, f, g, h (p = 0,28).
Table 3 presents the initial one-way ANOVA results (11 groups) with significant differences on Extraversion, Emotional Stability, SWLS, PIL, Normal and Pathological Perfectionism, and General Loneliness.
Based on descriptive statistics and plots of means, a description can be given for each scale where non-random mean differences were found. For example, on the Extraversion (E) scale, the scores of ascending trajectories (b, m) are significantly higher than those of descending trajectories (f, g), indicating that the first group of trajectories reflects greater energy, activity, talkativeness, sociability, and enthusiasm compared to trajectories (f, g).
On the Emotional Stability (S) scale, the lowest emotional stability is found for the descending trajectory (e), while the highest is found for the spiral trajectory (m).
On the Satisfaction with Life (SWLS) scale, the lowest scores are also for the descending trajectory (e), indicating a low assessment of quality of life, in contrast to all other trajectories, which show similar high scores on this scale.
On the Normal Perfectionism (P_NORM) scale, the highest normal perfectionism corresponds to the steeply ascending trajectory (b), and the lowest to non-ascending trajectories (f, d). The highest scores on the General Loneliness (L_GEN) scale correspond to the steeply descending trajectory (e). Respondents who chose this trajectory have a pronounced current experience of isolation, lack of emotional closeness or contact with others, and awareness of themselves as lonely, isolated individuals, in contrast to ascending or flat trajectories (b, c, d, l, m). High scores on the Purpose-in-Life test (PIL) correspond to ascending trajectories (b, c, m), and the lowest to descending trajectories (e, f, g).
To go further and find out where exactly the differences lie, i.e., which trajectories differ from each other, it is necessary to perform pairwise comparisons of the means of the existing groups. For this, the Holm method was chosen, but no statistically significant differences were found for the 12 trajectory groups.
Preliminary analysis showed that some trajectories exhibit the same pattern, so for further analysis we combined trajectories (e, f, g, h) into one group, since the number of cases in each trajectory group was insufficient for further analysis. After combining the low-frequency trajectories e, f, g, h (n < 4), the number of groups was reduced to 9 (b, c, d, e–f–g–h, i, k, l, m, o). Pillai’s criterion showed no significant differences between trajectories e, f, g, h (p = 0,28), which allowed us to combine them. On this basis, analysis of variance (ANOVA) was applied for further analysis.
All groups have practical significance for the study. Levene’s test for equality of variances showed that the variances of the dependent variables are not equal. For the case of unequal variances (i.e., in a situation of heteroscedasticity), Welch’s correction was used; the results of testing the initial assumption of equality of all means are presented in Table 4 with the results of robust tests.
At this stage, we focus on those variables for which the analysis of variance revealed statistically significant differences in means between groups (p < 0,05). Significant differences were obtained for several variables: Extraversion, Emotional Stability, Life Satisfaction, Normal Perfectionism, Pathological Perfectionism, General Loneliness, and Meaning in Life (see Table 5). The results are consistent with the results of the initial one-way ANOVA, which used 12 types of trajectories.
We established that mean differences exist; therefore, the next step in data analysis is to determine, using post-hoc range criteria and pairwise multiple comparisons, which means differ significantly. For the analysis of pairwise multiple comparisons, the Holm criterion was chosen, which is used to perform all pairwise comparisons between groups. Table 6 presents only the group means that differ significantly at the alpha level of 0,05.
According to the results, significant pairwise differences between trajectory groups after Holm correction were found for a number of comparisons.
Table 3
One-way ANOVA results
|
Scale |
df1 |
df2 |
F |
p |
η² (partial) |
|
Extraversion (E) |
11 |
231 |
1,88 |
0,04 |
0,08 |
|
Agreeableness (A) |
11 |
231 |
0,91 |
0,52 |
0,04 |
|
Conscientiousness (C) |
11 |
231 |
0,99 |
0,45 |
0,04 |
|
Emotional Stability (S) |
11 |
231 |
2,00 |
0,02 |
0,08 |
|
Openness to Experience (O) |
11 |
231 |
1,37 |
0,18 |
0,06 |
|
Social Desirability (L) |
11 |
231 |
1,10 |
0,36 |
0,05 |
|
Satisfaction with Life Scale (SWLS) |
11 |
231 |
2,68 |
0,00 |
0,10 |
|
Noetic Orientations Test (NOT) |
11 |
231 |
5,00 |
0,00 |
0,18 |
|
Systemic Reflection (SR) |
11 |
231 |
0,25 |
0,99 |
0,01 |
|
Quasi-Reflection (SK) |
11 |
231 |
1,71 |
0,07 |
0,07 |
|
Introspection (FA) |
11 |
231 |
0,66 |
0,77 |
0,03 |
|
Normal Perfectionism (P_NORM) |
11 |
231 |
2,70 |
0,00 |
0,11 |
|
Pathological Perfectionism (P_PATO) |
11 |
231 |
1,82 |
0,05 |
0,07 |
|
General Loneliness (L_GEN) |
11 |
231 |
2,05 |
0,02 |
0,08 |
|
Communication Dependency (L_DCOM) |
11 |
231 |
1,37 |
0,18 |
0,06 |
|
Positive Solitude (L_POS) |
11 |
231 |
0,67 |
0,76 |
0,03 |
Note: η² = (F × df1) / (F × df1 + df2). For non-significant effects, η² is shown for completeness.
Table 4
Robust tests of equality of means
|
Scale |
df1 (Welch) |
df2 (Welch) |
Статистика Уэлча (F) / Welch F |
p |
η² (partial) |
|
Extraversion (E) |
8 |
51,20 |
2,28 |
0,036 |
0,08 |
|
Agreeableness (A) |
8 |
52,38 |
1,35 |
0,242 |
0,04 |
|
Conscientiousness (C) |
8 |
52,16 |
1,46 |
0,196 |
0,04 |
|
Emotional Stability (S) |
8 |
52,45 |
2,60 |
0,018 |
0,08 |
|
Openness to Experience (O) |
8 |
51,53 |
1,57 |
0,156 |
0,06 |
|
Social Desirability (L) |
8 |
54,05 |
0,86 |
0,552 |
0,04 |
|
Satisfaction with Life Scale (SWLS) |
8 |
51,13 |
3,14 |
0,006 |
0,10 |
|
Noetic Orientations Test (NOT) |
8 |
51,33 |
7,24 |
0,000 |
0,18 |
|
Systemic Reflection (SR) |
8 |
55,11 |
0,28 |
0,971 |
0,01 |
|
Quasi-Reflection (SK) |
8 |
55,87 |
2,04 |
0,050 |
0,07 |
|
Introspection (FA) |
8 |
52,04 |
0,88 |
0,537 |
0,03 |
|
Normal Perfectionism (P_NORM) |
8 |
51,06 |
2,35 |
0,031 |
0,10 |
|
Pathological Perfectionism (P_PATO) |
8 |
51,73 |
2,00 |
0,036 |
0,07 |
|
General Loneliness (L_GEN) |
8 |
51,23 |
2,71 |
0,014 |
0,08 |
|
Communication Dependency (L_DCOM) |
8 |
50,87 |
0,97 |
0,468 |
0,05 |
|
Positive Solitude (L_POS) |
8 |
51,47 |
0,59 |
0,785 |
0,03 |
Note: Welch’s test was used due to heterogeneity of variances. η² computed as (F×df1)/(F×df1+df2) for uniformity.
Table 5
One-way ANOVA results
|
Scale |
df1 |
df2 |
F |
p |
η² (partial) |
|
Extraversion |
8 |
231 |
2,47 |
0,00 |
0,08 |
|
Agreeableness |
8 |
231 |
1,25 |
0,27 |
0,04 |
|
Conscientiousness |
8 |
231 |
1,09 |
0,37 |
0,04 |
|
Emotional Stability |
8 |
231 |
2,45 |
0,01 |
0,08 |
|
Openness to Experience |
8 |
231 |
1,70 |
0,10 |
0,06 |
|
Social Desirability |
8 |
231 |
1,12 |
0,35 |
0,04 |
|
Satisfaction with Life Scale (SWLS) |
8 |
231 |
2,98 |
0,00 |
0,09 |
|
The Purpose in Life Test |
8 |
231 |
6,79 |
0,00 |
0,19 |
|
Systemic Reflection |
8 |
231 |
0,29 |
0,97 |
0,01 |
|
Quasi-Reflection |
8 |
231 |
2,25 |
0,02 |
0,07 |
|
Introspection |
8 |
231 |
0,74 |
0,65 |
0,03 |
|
Normal Perfectionism |
8 |
231 |
3,20 |
0,00 |
0,10 |
|
Pathological Perfectionism |
8 |
231 |
2,06 |
0,04 |
0,07 |
|
General Loneliness |
8 |
231 |
2,40 |
0,02 |
0,08 |
|
Communication Dependency |
8 |
231 |
1,18 |
0,32 |
0,04 |
|
Positive Solitude |
8 |
231 |
0,63 |
0,75 |
0,02 |
Note: η² = (F × df1) / (F × df1 + df2). For non-significant effects, η² is shown for completeness. Bold p-values indicate significance at α = 0,05.
Table 6
Significant pairwise differences between trajectory groups after Holm
|
Scale |
Comparison (I — J) |
(I—J) Mean difference |
Std, error |
p (Holm-corrected) |
|
Extraversion (E) |
b — e-f-g-h |
0,787 |
0,246 |
0,041 |
|
Emotional Stability (S) |
m — e-f-g-h |
0,964 |
0,285 |
0,028 |
|
Satisfaction with Life Scale |
b — e-f-g-h |
6,833 |
2,113 |
0,041 |
|
Satisfaction with Life Scale |
b — i |
5,415 |
1,586 |
0,029 |
|
Satisfaction with Life Scale |
b — o |
4,868 |
1,494 |
0,039 |
|
Noetic Orientations Test |
b — e-f-g-h |
29,611 |
6,269 |
<0,001 |
|
Noetic Orientations Test |
b — i |
19,840 |
4,709 |
0,002 |
|
Noetic Orientations Test |
b — k |
17,919 |
4,673 |
0,008 |
|
Noetic Orientations Test |
b — o |
14,297 |
4,454 |
0,044 |
|
Noetic Orientations Test |
c — e-f-g-h |
26,989 |
6,164 |
0,002 |
|
Noetic Orientations Test |
c — i |
17,218 |
4,568 |
0,010 |
|
Noetic Orientations Test |
l — e-f-g-h |
21,798 |
5,552 |
0,008 |
|
Noetic Orientations Test |
m — e-f-g-h |
25,503 |
5,569 |
<0,001 |
|
Normal Perfectionism |
b — d |
1,148 |
0,326 |
0,022 |
|
Normal Perfectionism |
b — e-f-g-h |
0,991 |
0,282 |
0,022 |
|
Normal Perfectionism |
b — i |
0,705 |
0,210 |
0,033 |
|
General Loneliness |
o — l |
0,558 |
0,173 |
0,042 |
Respondents who chose the steeply ascending trajectory (b) have higher scores on the Extraversion scale, indicating their expansiveness, enthusiasm, confidence, and assertiveness, in contrast to the group of trajectories (e, f, g, h). On the Emotional Stability scale, significant differences were found between respondents who chose the spiral trajectory (m), indicating their ability to control irritation, discontent, and anger, as well as their ability to cope with anxiety and emotions, in contrast to the group of trajectories (e, f, g, h). On the Life Satisfaction scale, differences were found between respondents who chose trajectory (b) and the group of trajectories (e, f, g, h, i, o), indicating greater overall satisfaction with their lives for the former and low satisfaction for the group (e, f, g, h, i, o). As shown in Table 6, respondents who chose the steeply ascending trajectory (b) scored significantly higher on Normal Perfectionism compared to those who chose trajectory d (flat horizontal line), the combined descending group (e–f–g–h), and the dead‑end trajectory i. This suggests that individuals with an upward perceived life trajectory tend to set high standards for themselves and strive for excellence in an adaptive, non‑debilitating manner.
On the General Loneliness scale, which reflects the degree of current feeling of loneliness and lack of close communication with others, significant differences were found between respondents who chose trajectory (o) (empty field) and (l) (ascending broken line). These data may indicate that the former have a pronounced current experience of isolation, lack of emotional closeness or contact with people, while the latter do not experience painful loneliness associated with lack of closeness or communication and do not consider themselves lonely.
To illustrate the identified differences, Figure 2 presents the mean values of life satisfaction (SWLS) and meaning in life (PIL) in each trajectory group with 95% confidence intervals. It can be seen that groups with ascending and spiral trajectories (b–c, l, m) show the highest scores on both scales, while descending trajectories (e–f– g–h) and trajectory i (dead end/zigzag) show the lowest.
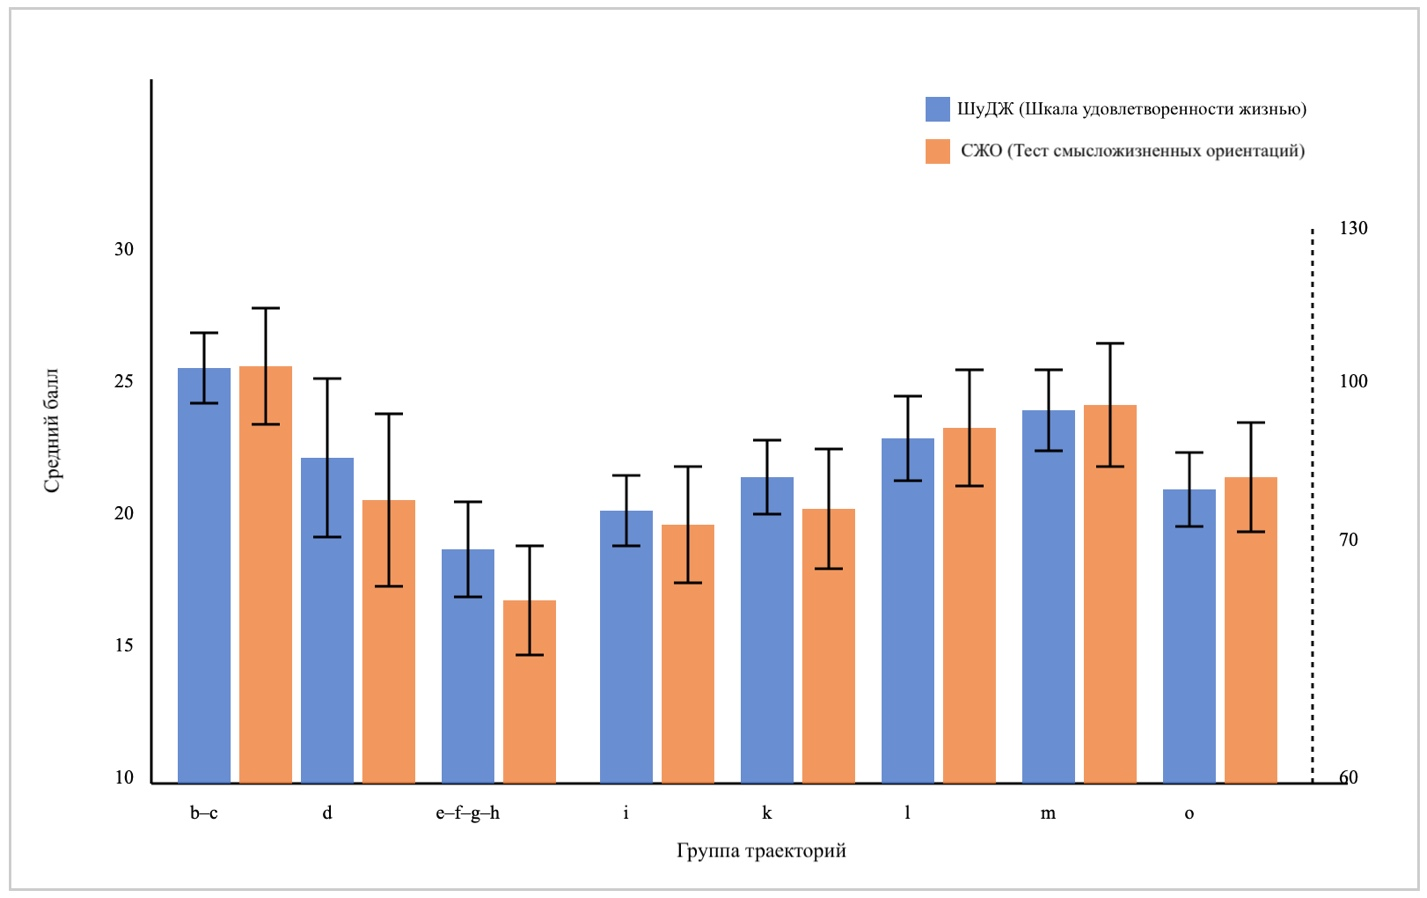
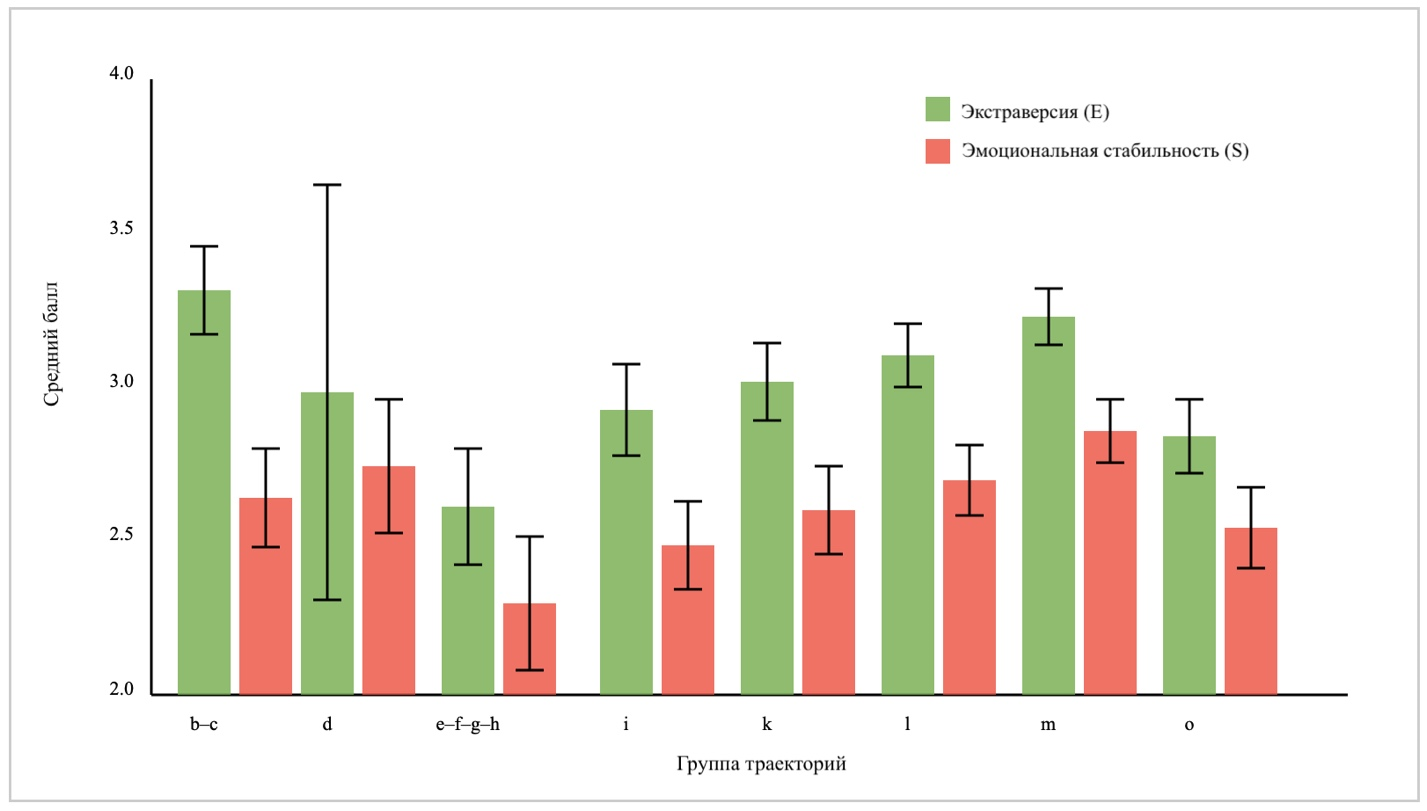
Figure 3 shows the mean values of extraversion and emotional stability across groups. Group b–c significantly exceeds group e–f–g–h in extraversion, and group m (spiral) significantly exceeds group e–f–g–h in emotional stability. Error bars correspond to standard errors of the mean.
Discussion
The objective of this study was to test the new graphic method “Trajectory”, which explores the possibility of using visual data as integrals of experience. In our case, we used a schematic image of the life trajectory as a visual representation of the current subjective attitude towards one’s own life.
The results confirmed stable relationships between the choice of a visual image of the life trajectory and indicators of basic personality traits and some other personality variables. The obtained data indicate that the choice of trajectory can act as a factor influencing the distribution of certain traits and other personality variables. When we divide people into groups according to their choice of trajectory, they turn out to differ in the expression of various psychological parameters.
We found that mean differences exist. Therefore, the next step in data analysis was to determine, using post-hoc range criteria and pairwise multiple comparisons, which mean values differ significantly in terms of energy, emotional stability, life satisfaction, meaning in life, reflection, perfectionism, and the experience of loneliness.
The obtained results are consistent with theoretical notions that visual methods can serve as effective tools for diagnosing subjective experiences and personality characteristics (Shilmanskaya, 2020; Artemyeva, 1999). The choice of a particular type of trajectory reflects not only cognitive representations of one’s own life path but also the emotional attitude towards it, which manifests in its relationship with emotional stability and life satisfaction scores. Of particular interest is the relationship between trajectory choice and perfectionism indicators. Respondents who choose steeply ascending trajectories demonstrate higher levels of normal perfectionism, which may indicate a striving for high standards combined with the ability to adaptively regulate their behaviour.
Conclusion
The conducted analysis allows us to conclude that the phenomenon of personality change is complex and multifaceted, requiring an integration of quantitative and qualitative approaches for its study. Contemporary psychology shows a clear “visual turn”, expressed in the development and active use of methods such as “Trajectory” to diagnose the subjective picture of the life path.
These visual methods, complementing traditional questionnaires (such as scales of meaning in life, self‑change potential, and response styles to change), make it possible to obtain unique data about a person’s experience of change processes, their readiness for change, and the subjective authorship of their own life.
Thus, a promising direction for further research is an in‑depth study of the relationships between ob jective indicators of personality dynamics and their subjective representation using visual and narrative methods.
Limitations. The main limitations of the study are related to the need to expand the sample for more reliable data. There is also a question about studying the change or stability of trajectory choice over different time intervals. The study sample was relatively homogeneous in terms of age and educational status, which limits the ability to generalize results to other age and social groups.