Introduction
An important element of psychodiagnostics for preschool-age children is their intellectual development evaluation. Data obtained through research of children's intelligence help us understand the nature of learning difficulties and develop solutions for the educational process (Kanonir et al., 2024; Khoroshilov, 2007). The most common methods for assessing the intellectual development level in children in Russia are the Wechsler Intelligence Scale for Children, Raven's Progressive Matrices (RPM), the Cattell Culture Fair Intelligence Test (CFIT), and the Amthauer Intelligence Structure Test (IST) (Kanonir et al., 2024).
Raven's Progressive Matrices are one of the most popular tests for intellectual abilities assessment in practice and research, both in Russia as well as in other countries (Raven, Raven, Kurt, 2002; Pind, Gunnarsdottir, Johannesson, 2003; Kazem et al., 2009). Raven's Progressive Matrices is generally considered a tool for studying nonverbal intelligence. A distinction should be made between tests that measure nonverbal intelligence and tests that study intelligence and use stimuli that do not require verbal responses. The very concept of "nonverbal intelligence" does not imply specific intellectual operations or problem-solving techniques; it emphasizes that a person can effectively solve problems that do not require the use of speech; nonverbal intelligence "is not so much associated with knowledge as with the individual's skills formed on the basis of this knowledge and his/her psychophysiological, sensorimotor, and perceptual characteristics" (Filimonenko, Timofeev, 2001, p. 72). Thus, the classic Wechsler's test version consisted of two scales: tasks that required the use of speech (this included, among other things, arithmetic problems and a subtest related to memorizing numbers), and tasks that the respondent could perform silently, manipulating the objects offered to him/her. Moreover, a higher quality of non-verbal problem solving could depend on the subject’s past experience, for example, his/her occupation, in which he/she developed the habit of working with coding or symbolization, which did not necessarily mean that he/she had better developed the corresponding mental operations. J. Raven created a test for measuring productive mental activity, believing that previously developed scales, primarily the Stanford-Binet, diagnose reproductive ability, that includes “memorization, recall, and reproduction of primarily verbal material, which represents a cultural reserve of explicit knowledge, fixed in linguistic form” (Raven, Kurt, Raven, 1997, Sec. 1, p. 3). Productive ability consists of “resolving doubts, forming a new vision of a problem, going beyond the existing data in order to see the hidden, the non-obvious, … understanding complex problems with many interdependent variables” (Raven, Kurt, Raven, 1997, Sec. 1, p. 3). The nonverbal form was chosen to create universal tasks, so its completion would not require mastery of a general culture; in addition, Gestalt psychological theory, which was close to J. Raven, provided schemes for interpreting the specific abilities required to solve problems in series where the tasks were composed using different structuring principles. Further studies demonstrated that the data obtained as a result of diagnosing intelligence via J. Raven's methods may relate to different factors, for example, perceptual, visual-spatial and even verbal (Goharpey, Crewther, Crewther, 2013), just as the same errors may have qualitative differences and indicate dissimilar intellectual abilities, depending on both age and individual characteristics (Vucicevich, 2023, p. 65). Given this context, the expression "nonverbal intelligence", commonly applied in relation to Raven's Progressive Matrices, is used in our study in a broader sense as intelligence diagnosed by tests with nonverbal tasks; while the qualitative specificity of measured intelligence requires further research.
The Progressive Matrices were developed in 1936 by J. Raven and L. Penrose, based on the forms perception theory from Gestalt psychology and Charles Spearman's theory of neogenesis. The matrices’ nonverbal nature eliminates the possibility of low scores due to a child's speech difficulties, makes the test accessible to a wide age range, and provides the ability to evaluate tasks performance speed to study the thought processes effectiveness (Scalisi, Cannoni, Traversari, 2020; Schmittmann, Hamel, 2006). In addition, the non-verbal test is convenient for mass diagnostic examinations (Khoroshilov, 2007) if the detailed author's manuals for the main test versions are available (Raven, Kurt, Raven, 1996, Sec. 1, 2, 3).
The age range for applying Raven's Progressive Matrices begins at 4 years and 6 months and has no upper limit. The method has several different variations. The most common test variants are the Standard Progressive Matrices (SPM), designed for adolescents of 8 to 11 years old and adults of 20 to 65 years old, the Colored Progressive Matrices (CPM), used for children of 4 years 6 months old up to 11 years old, people over 65 years and people with intellectual disabilities, and the Advanced Progressive Matrices (APM) for people with average and above intellectual abilities (Raven, 2008; Semago, Semago, 2005).
Due to the test’s non-verbal nature, which allows it to be used in different cultures without translation, the norms for the CPM of children from the USA, obtained during the standardization of the methodology in 1986 (Raven, Kurt, Raven, 1996), are widely used. Despite the data showing that, given the similarity of such socio-cultural factors as the country’s urbanization degree, educational status, industrial development and ethnic homogeneity, there is a similarity in normative values (Raven, Kurt, Raven, 1996, Sec. 1, 2, 3, 4), Russian researchers highlight the problem of using the Raven’s test in Russia, associated with reliance on generally accepted international norms and the lack of standardization of the Progressive Matrices on large-scale Russian samples (Kanonir et al., 2024; Khoroshilov, 2007; Davydov, Chmykhova, 2016).
The most recent data on normative indicators for children in Moscow and the Moscow region, based on the Colored Progressive Matrices (CPM), date back to 1983–1997 (Semago, Semago, 2005). Earlier studies of norms for CPM are difficult to locate for social rather than scientific reasons. In the USSR, following the 1936 decree of the Central Committee of the All-Union Communist Party "On Pedological Perversions in the System of People's Commissariats of Education", testing was practically banned, especially intelligence diagnostics, which could lead to gathering the data on intellectual differences between social classes and nationalities that could prove unacceptable to the dominant ideology of the time. Subsequently, although the decree was not repealed, psychodiagnostic procedures were used and developed in soviet psychology, but they were applied very locally and under control. L. Chuprov, describing the difficulties of the R. Amthauer's intelligence structure test adaptation in the USSR under the "severe restrictions on the intelligence research, especially in children", designates this work as "in fact... 'underground' activity of reviving psychometrics", when "tests for the sake of conspiracy were called methods", being developed mainly in defectology in the presence of "publishers and popularizers who, in the wake of an acute shortage of diagnostic tools, were actually engaged in spoiling the work of others, distributing techniques’ counterfeit defective versions" (see: Sabanin, 2017, p. 227). Typographic printing of stimulus material was minimized; copying it independently was difficult, especially where color printing was required. As recently as the 1990s, in research and in practice, the copied Colored Progressive Matrices looked like sheets of gray-black images that psychologists colored by hand with colored pencils. The use of outdated norms negatively impacts the data quality reported by researchers (Raven, 2021).
The problem of the need to update norms is exacerbated by the study of two opposing effects discovered in the intelligence testing: the Flynn effect and the anti-Flynn effect. According to the Flynn effect, an increase in scores on tests aimed at measuring intelligence is observed over time (Flynn, 1984; Flynn, 1987), which is confirmed by both international (Pietschnig, Voracek, 2015; Williams, 2013; Wongupparaj, Kumari, Morris, 2015) as well as Russian studies (Sugonyaev, 2015; Sugonyaev, Grigoriev, 2019), which, among other things, introduce new explanatory principles for understanding this effect, associating it not so much with a quantitative increase, but with a redistribution of human cognitive potential in the 20th century (Valueva et al., 2017). The reverse Flynn effect demonstrates a decline in intellectual level in intergenerational samples (see: Teasdale, Owen, 2005; Platt, Keyes, McLaughlin, Kaufman, 2019), although it is difficult to draw systematic conclusions about the generality degree of this effect, since it is observed to varying extent in different countries and at different ages (Flynn, Shayer, 2018). Currently, its causes can only be discussed at the hypothetical level: roots of the problem are considered in the social, economic, cultural, educational, and even environmental spheres; the increasing role of digital culture and time spent interacting with gadgets also falls into this range, but any other explanation that identifies technological or cultural changes chronologically coinciding with the anti-Flynn effect manifestation could be offered with equal success.
In recent years, international scientific articles have appeared highlighting modern norms for the CPM, both for school (Qiu, Hatton, Hou, 2020; Eissa et al., 2012) and preschool ages (Bildiren, 2017; Scalisi, Cannoni, Traversari, 2020), which is explained by widespread international CPM use in scientific research and psychological practice, as well as by the absence of specific norms for some countries and the outdated norms presence for others.
Methods and materials
Methods. To assess the preschoolers’nonverbal intelligence, this study used Raven's Colored Progressive Matrices (CPM) (Raven, Kurt, Raven, 1996). Each test task consists of a colored geometric matrix with a missing piece, which the respondent must select from six options (see Figure 1). The test has 36 tasks, divided into 3 series (A, Ab, B) with 12 matrices in each:
- A Series includes simple patterns (simple analysis of the structure’s integrity).
- Ab Series – more complex analogies and transformations.
- B Series – complex spatial and logical problems.
There is no strict time limit for the task completion.
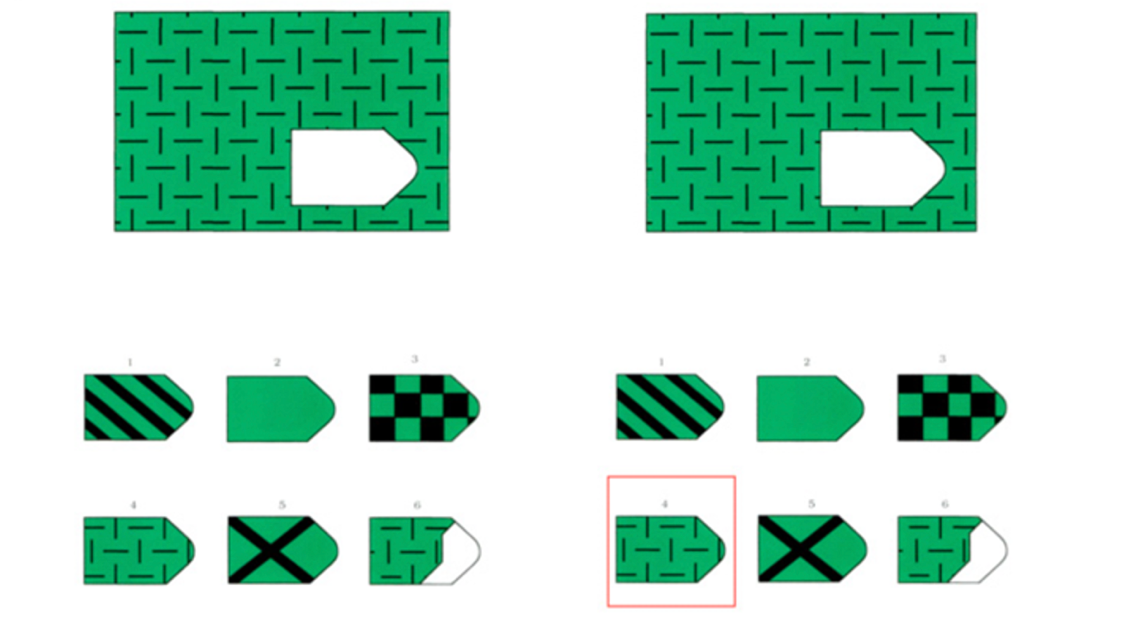
When the tasks are presented, the child hears an instruction. We used a modified version of the instructions by T. Rozanova and T. Egorova, tested on children with intellectual disabilities (Rozanova, 1978), with simplified vocabulary to make them easier for younger children to understand: "A little mouse came at night and gnawed holes in the carpets. Please help to fix them. Look, do you see a hole in the carpet? You need to pick out a piece out of these that matches the pattern. Only one of the pieces is correct. Show me which one."
The first task is designed to familiarize the child with the task type. If the child makes a mistake, he/she is asked to look at the options once again and select the one that matches the carpet pattern. If the child doesn't give the correct answer on the second attempt, he/she is corrected and the logic behind the task is explained. Answers cannot be corrected in subsequent tasks. Therefore, the minimum possible score in the test is 1, and the maximum is 36 (based on the number of tasks). The test is terminated if the child makes five consecutive errors at the beginning of any of the three series.
The Raven's Colored Progressive Matrices test was given individually to each child. The testing procedure was presented as a game. Responses were recorded and then processed to obtain a final score as well as scores for each series.
Procedure. The evaluations took place in the first half of the day in isolated, quiet rooms at the Moscow kindergartens that children attended. Each child was individually tested with the Raven Colored Progressive Matrices. The average duration of each evaluation was approximately 7-10 minutes, including instructions.
The full testing procedure included: (1) standardized instructions, (2) one practice task, (3) the main part of 35 tasks (series A, Ab, B), (4) recording of responses in a protocol. Optimal conditions were ensured during testing: no distractions, neutral feedback, and the possibility to stop at any time. Upon completion, all participants received a reward sticker.
The obtained data were stored in encrypted form with unique identifiers being assigned. The study was approved by the Research Ethics Committee of the Federal Scientific Center for Psychological and Multi-disciplinary Research (conclusion No. 4 dated January 31, 2024). Research ethical procedures included written voluntary informed consent from parents for diagnostic testing of their children and emphasized the participants' right to withdraw from further testing at any time.
Data analysis was conducted via Microsoft Excel 2010 and Jamovi 2.3.21.0. Contingency tables (Pearson's chi-square test) were used to verify the distribution uniformity of children across age and gender subgroups. The Exploration module was used to calculate descriptive statistics (means, standard deviations, percentiles for normalization, etc.) and to plot diagrams. To avoid dependence on the distribution type and equality of variances, nonparametric methods or nonparametric corrections for parametric methods were used for subgroup comparisons. The Mann-Whitney U test and ANOVA with Welch's nonparametric correction were applied to assess gender differences and pairwise comparisons of age groups across semiannual intervals.
Sample. Although the age range for the Raven's Colored Progressive Matrices begins at 4 years 6 months (Raven, Kurt, Raven, 1996), in this study we attempted to expand the age range by including children as young as 3 years old to track the dynamics of children's nonverbal intelligence. A total of 425 preschoolers (219 boys, 206 girls) of 3 to 7 years old (M = 4,8 years; SD = 1,2) participated in the study. All children attended public kindergartens. The sample was stratified into four main age groups:
- Junior group: 3 years – 3 years 11 months (n = 109; 62 boys, 47 girls)
- Middle group: 4 years – 4 years 11 months (n = 104; 47 boys, 57 girls)
- Senior group: 5 years – 5 years 11 months (n = 89; 42 boys, 47 girls)
- Preschool group: 6 years – 6 years 11 months (n = 123; 68 boys, 55 girls).
Results
The total sample (n = 425) was stratified not only by four age groups (junior, middle, senior, preschool group) but also by semiannual intervals within each group. Such a stratification proved itself in creating cognitive development norms for preschoolers (Filimonenko and Timofeev, 2001) and was used in our previous studies (Almazova et al., 2024; Veraksa, Almazova, Bukhalenkova, 2020).
The distribution of children by gender in each subgroup is presented in Table 1 as absolute values (n) and percentages (%). Statistical analysis using the Pearson chi-square test revealed no significant differences in the gender distribution between age groups (χ² = 4,87; p = 0,676), indicating the homogeneity of the sample and its suitability for further analysis.
Table 1
Distribution of preschool children in the sample by gender and age group
|
Группа детского сада / Age group |
Возраст (лет (мес.)) / Age (years (months)) |
Показатель / Indicator |
Мальчики / Boys |
Девочки / Girls |
|
Младшая группа / Junior |
3 (0) – 3 (5) |
Абсолютное число (n) / Absolute number |
18 |
15 |
|
% |
54,5 % |
45,5 % |
||
|
3 (6) – 3 (11) |
Абсолютное число (n) / Absolute number |
44 |
32 |
|
|
% |
57,9 % |
42,1 % |
||
|
Средняя группа / Middle |
4 (0) – 4 (5) |
Абсолютное число (n) / Absolute number |
15 |
20 |
|
% |
42,9 % |
57,1 % |
||
|
4 (6) – 4 (11) |
Абсолютное число (n) / Absolute number |
32 |
37 |
|
|
% |
46,4 % |
53,6 % |
||
|
Старшая группа / Senior |
5 (0) – 5 (5) |
Абсолютное число (n) / Absolute number |
20 |
25 |
|
% |
44,4 % |
55,6 % |
||
|
5 (6) – 5 (11) |
Абсолютное число (n) / Absolute number |
22 |
22 |
|
|
% |
50,0 % |
50,0 % |
||
|
Подготовительная группа / Preschool |
6 (0) – 6 (5) |
Абсолютное число (n) / Absolute number |
34 |
29 |
|
% |
54,0 % |
46,0 % |
||
|
6 (6) – 6 (11) |
Абсолютное число (n) / Absolute number |
34 |
26 |
|
|
% |
56,7 % |
43,3 % |
||
|
Всего / Total |
Абсолютное число (n) / Absolute number |
219 |
206 |
|
|
% |
51,5 % |
48,5 % |
||
Age dynamics analysis of non-verbal intelligence development in 3-7-year-old children.
One-way analysis of variance (ANOVA with Welch's nonparametric correction, see Table 2) showed that for almost all age groups across semiannual intervals there were statistically significant differences both in all test series and in the total score (p < 0,001).
Table 2
Results of one-factor ANOVA of Welch's series of Raven's Color Progressive Matrices test for age groups by semiannual intervals in children 3-7 years old
|
Показатель / Indicator |
Баллы по серии A / Series A scores |
Баллы по серии Ab / Series Ab scores |
Баллы по серии B / Series B scores |
Общий балл / Total score |
|
ANOVA Уэлча F / Non-parametric ANOVA (df1; df2) |
36.30 (7; 159) |
58.81 (7; 160) |
33.14 (7; 143) |
68,293 (7;160) |
|
p – value |
< 0,001 |
< 0,001 |
< 0,001 |
< 0,001 |
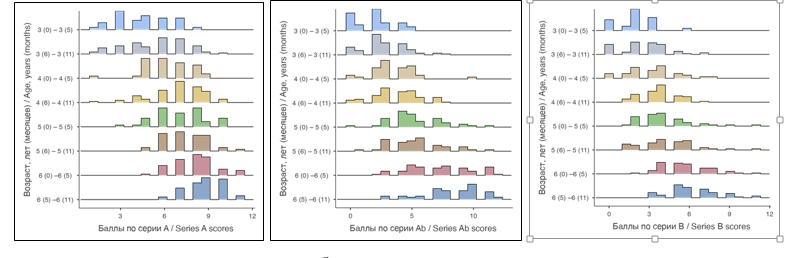
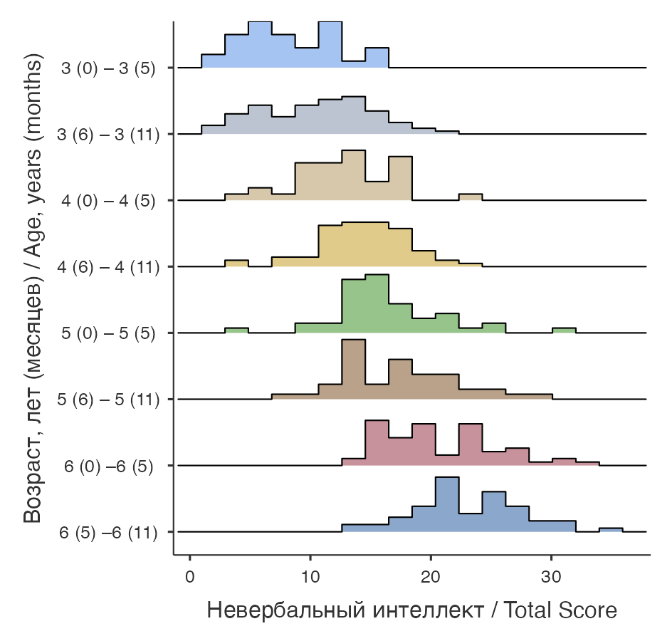
The Games-Howell multiple comparison method allowed us to trace a clearly interpretable stable age-related dynamic: the scores for each test series and the overall score consistently improve with age (see Figure 2, Figure 3).
Gender differences’ analysis in the non-verbal intelligence development in 3-7-year-old children.
Gender differences’ analysis in task performance across the series revealed virtually no significant differences between boys and girls in most age categories (Mann-Whitney U, p> 0,05). The only statistically significant difference was found in the scores on the Ab series among children of the age of 4 years to 4 years 5 months in the kindergarten’s middle groups (p = 0,033), but the difference in mean values was less than 0,5 points (see Figure 4).
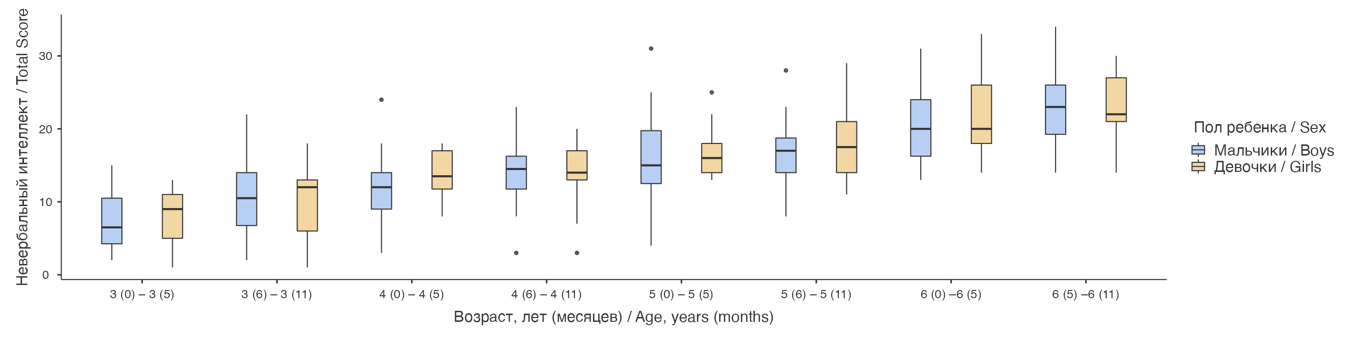
Fig. 4. Analysis of gender differences in the total score of the Raven's Colored Progressive Matrices test for age groups by semiannual intervals in children 3-7 years old.
Age norms creation of the non-verbal intelligence development in 3-7-year-old children.
As a result, detailed age-specific standards of completing the methodology (see Table 3) were calculated, allowing to evaluate the nonverbal intelligence development level in preschool children of 3 to 7 years old. A distinctive feature of the developed standards is their semiannual gradation, which ensures a more accurate assessment of nonverbal intelligence development during the preschool period. Due to the lack of gender differences, gender was excluded when constructing the standards.
Normative values were calculated applying the percentile method, where the level boundaries were determined by the 15th (low level) and the 85th (high level) percentiles for each semiannual age interval. This method is widely used in psychometrics (Shmelev, 2013), as it helps to avoid rigid adherence to a normal distribution, while also kind of creating its imitation (with 15% of results at the extremes and 70% in the middle). When working with child samples, this is crucial, since it is difficult to maintain normal distribution in each individual sample; however, when combining samples, according to the central limit theorem, the distribution will begin to tend toward normality (Shiryaev, 2004).
The obtained data demonstrate a steady progress in indicators for all series of tasks as the children’s age increases (see Figure 1, Figure 2).
Table 3
Age-specific norms for performing the Raven's Color Progressive Matrices test for children 3-7 years old
|
Возрастная группа (лет (мес.)/ Age group (years (months) |
Уровень / Level |
Серия A / Series A |
Серия Ab / Series Ab |
Серия B / Series B |
Общий балл / Total Score |
|
3 (0) – 3 (5) |
Низкий / Low |
≤ 2 |
0 |
0 |
≤ 3 |
|
Средний / Medium |
3 –7 |
1 –4 |
1–3 |
4–12 |
|
|
Высокий / High |
≥ 8 |
≥ 5 |
≥ 4 |
≥ 13 |
|
|
3 (6) – 3 (11) |
Низкий / Low |
≤ 2 |
≤ 1 |
0 |
≤ 4 |
|
Средний / Medium |
3 – 7 |
2 – 4 |
1 – 4 |
5 – 15 |
|
|
Высокий / High |
≥ 8 |
≥ 5 |
≥ 5 |
≥ 16 |
|
|
4 (0) – 4 (5) |
Низкий / Low |
≤ 4 |
≤ 1 |
0 |
≤ 8 |
|
Средний / Medium |
5 – 8 |
2 – 5 |
1 – 5 |
9 – 17 |
|
|
Высокий / High |
≥ 9 |
≥ 6 |
≥ 6 |
≥ 18 |
|
|
4 (6) – 4 (11) |
Низкий / Low |
≤ 4 |
≤ 1 |
≤ 1 |
≤ 10 |
|
Средний / Medium |
5 – 9 |
2 – 6 |
2 – 5 |
11 – 18 |
|
|
Высокий / High |
≥ 10 |
≥ 7 |
≥ 6 |
≥ 19 |
|
|
5 (0) – 5 (5) |
Низкий / Low |
≤ 5 |
≤ 2 |
≤ 1 |
≤ 12 |
|
Средний / Medium |
6 – 9 |
3 – 7 |
2 – 6 |
13 – 21 |
|
|
Высокий / High |
≥ 10 |
≥ 8 |
≥ 7 |
≥ 22 |
|
|
5 (6) – 5 (11) |
Низкий / Low |
≤ 5 |
≤ 2 |
≤ 1 |
≤ 15 |
|
Средний / Medium |
6 – 9 |
3 – 8 |
2 – 6 |
16 – 26 |
|
|
Высокий / High |
≥ 10 |
≥ 9 |
≥ 7 |
≥ 27 |
|
|
6 (0) –6 (5) |
Низкий / Low |
≤ 6 |
≤ 4 |
≤ 3 |
≤ 15 |
|
Средний / Medium |
7 – 9 |
5 – 10 |
4 – 8 |
16 – 26 |
|
|
Высокий / High |
≥ 10 |
≥ 11 |
≥ 9 |
≥ 27 |
|
|
6 (5) –6 (11) |
Низкий / Low |
≤ 6 |
≤ 5 |
≤ 4 |
≤ 18 |
|
Средний / Medium |
7 – 10 |
6 – 10 |
5 – 8 |
19 – 28 |
|
|
Высокий / High |
≥ 11 |
≥ 11 |
≥ 9 |
≥ 29 |
The appendix to this article presents detailed descriptive statistics for the series of performance of the Raven's Colored Progressive Matrices test for 3-7-year-old children at semiannual intervals.
Discussion
Large-scale testing to clarify age norms for the CPM are regularly conducted in various countries. The lower limit of testing usually depends on the age at which formal education begins or on the available resources: for example, the Icelandic study begins at 6 years (Pind, Gunnarsdottir, Johannesson, 2003), the Buenos Aires study begins at 5 years 6 months (Raven, Raven, Kurt, 2002, Sec. 2), and the study of age norms in Oman cuts the lower limit to 5 years (Kazem et al., 2009). Research specifically examining norms for preschool children is not a priority. A serious problem in each case is the sample’s quantitative characteristics: for example, in Iceland (Pind, Gunnarsdottir, Johannesson, 2003), the sample consisted of 550 children of 6 to 16 years old, meaning that norms for each age were formed based on data obtained from a study of 50 children.
The modern standard indicators we identified for preschool children of 4 years 6 months to 7 years old attending kindergartens in Moscow are, on average (see the descriptive table in the appendix to the article), inferior to the standard indicators for children of the same age in 1983-1997 [6], presented in Table 4. When examining the results of 6-7-year-old children, there is a correspondence between the obtained average values and the indicators from thirty years ago. The presence of differences in the normative indicators for non-verbal intelligence in this study and the indicators identified about 30 years ago can be explained by the absence in the 1983-1997 sample of children with low results (below 8 points) on the CPM, as evidenced by the scatter of the obtained data presented in Table 4.
Table 4
Average age-specific norms of CPM performance by children of Moscow city and Moscow region (1983-1997)
|
Возраст / Age |
Средние значения (баллы) / Mean (points) |
Разброс (в баллах) / Range (in points) |
|
4 years 6 months -5 years 5 months |
14 |
8-22 |
|
5 years 6 months – 5 years 11 months |
17 |
12-24 |
|
6 years – 6 years 5 months |
18 |
13-27 |
|
6 years 6 months – 7 months |
20 |
14-29 |
A significant question is the extent to which the CPM could be used for children between 3 years old and 4 years 6 months old, as the lower limit specified in the instructions is 4.5 years old (Raven, Raven, Court, 1998). For J. Raven, this limit was not random. According to J. Raven, the development of children's productive intellectual ability begins with the ability to distinguish identical figures and separate them from others, it passes through the ability to evaluate the figure’s location in the perceptual field and only then reaches the ability to analyze the whole and identify its essential parts. J. Raven believed that a three-year-old child, given a matrix board with a drawn pattern and a cut-out hole for placing figures, will insert fragments with any pattern, rejoicing that everything fits the shape. Though, he also noted that already at this age “some children successfully complete the drawing in the first two or three matrices of Series A and leave the correct fragment in the correct position” (Raven, Kurt, Raven, 1997, Sec. 1, p. 23). A four-year-old child already pays attention to the pattern, although he/she ignores the elements’ arrangement (for example, not distinguishing between vertically and horizontally depicted lines; “he/she only needs instructions to… try to select the correct fragment on the first try” (Raven, Kurt, Raven, 1997, Sec. 1, p. 24). At the same time, J. Raven had a general mistrust of the intelligence testing of children under 6 years of age, since in young children “attention and interest… are usually too fluid, and the results of intellectual activity are too inconsistent for any intelligence test to be able to reliably predict subsequent intellectual development” (Raven, Kurt, Raven, 1997, Sec. 2, p. 17). However, if we recall that this test was created to study productive mental activity, then the capabilities of younger children allow us to make more optimistic assumptions, both based on the views of Gestalt psychologists, on whom J. Raven relied and who believed that the ability to perceive "good form" is given to everyone from birth, as well as based on creative thinking research in preschoolers, which showed that four-year-olds can already "make a forecast of a situation ... and use a reproductive image to anticipate the object’s behavior" (Veraksa, 2021, p. 83). The main problem with using the CPM to study the young children’s intelligence is, rather, establishing a rapport; as our research demonstrates, it is feasible to develop norms for children aged 3 to 4 years 6 months. This is consistent with the fact that even the reference materials for the standard CPM manual cite normative data obtained in Spain and the Netherlands in 1982, in which the youngest children tested were 3 years 9 months old (Raven, 2002).
Contemporary international research also emphasizes the importance of considering not only quantitative but also qualitative characteristics of the CMP tasks completion, including the time spent on them, which allows for a more thorough assessment of children's cognitive potential (Smirni, 2020; Smirni, Smirni, 2022). Smirni, in her work (Smirni, 2020), demonstrates that this allows for the identification of hidden potential and characteristics of a child's thinking that are not apparent in a quantitative interpretation of the results.
Conclusion
The study identified current normative indicators for preschool age among Russian-speaking children in Moscow. A slight decrease in the current average indicators for Moscow children at the age of 4 years 6 months to 6 years (see table in the appendix) was found in comparison with data presented 30 years ago. The results of today's children and those of 6-7-year-old children between 1983 and 1997 were similar (see Table 4). Furthermore, when comparing the obtained results with generally accepted normative values established in the United States in 1986, it was shown that the results of Moscow children at the age of 5 years to 6 years 6 months were inferior to those of US children at the lower limit of the norm and superior at the upper limit of the norm for children at the age of 5 years 6 months to 7 years. No gender differences were revealed in the research.
Promising areas for further research include identifying normative indicators, evaluating task completion speed, and investigating regional differences in preschoolers' nonverbal intelligence assessments. Continuous study of nonverbal intelligence in children at the age of 3 and older also appears necessary to confirm the test's applicability, such as by evaluating correlations with other tests measuring children's cognitive abilities at this age.
Limitations. The present study was limited to preschool children from Moscow and did not encompass evaluations of nonverbal intelligence in children from other Russian regions. Therefore, the derived norms should be applied with caution when assessing children from other geographical areas. A small sample is an important limitation of this work. Therefore, the results obtained should be considered as preliminary. In the future, it is planned to increase the sample size, expand the geography of the study and include a wider age range. This makes it possible to increase the reliability and representativeness of the obtained age norms