Introduction
Computational thinking (CT) is a structured problem-solving approach that draws on techniques and methodologies from computer science. It involves decomposing complex problems, identifying patterns, abstracting key information, and developing stepwise solutions executable by computers or comprehensible to humans (
Wing, 2006). CT is defined as the ability to apply cognitive processes for problem analysis, sequence planning, and solution identification (Henderson Cortina, Wing, 2007). This capability involves engaging in higher-order thinking within cognitive frameworks (Arfé et al., 2019; Román-González, Pérez-González, Jiménez-Fernández, 2017; Tang, Chou, Tsai, 2020;
Tikva, Tambouris, 2021). Higher-order thinking corresponds to Bloom’s taxonomy (Bloom, Krathwohl, Masia, 1984), which outlines levels such as analysis, application, evaluation, and creation, and requires cognitive processing associated with CT. These four levels are closely tied to the problem-solving process and align with Guilford’s (Guilford, 1967) theory of problem solving, which includes stages such as preparation, analysis, production, verification, and reapplication. Although CT is often mentioned in connection with programmers and IT specialists, it is a cognitive skill employed by most. CT is not limited to computer science; it is applicable across various fields, enhancing critical thinking and analytical skills (
Shute, Sun, Asbell-Clarke, 2017). As technology permeates all areas of life, fostering CT early prepares individuals for future academic and professional challenges (
Bers, Strawhacker, Sullivan, 2022), with empirical evidence showing that early coding instruction produces measurable gains in young children’s CT (
Relkin, de Ruiter, Bers, 2021). Moreover, it encourages logical reasoning and effective communication, equipping learners with tools necessary for tackling complex issues in an increasingly digital world (
Hurt et al., 2023;
Robledo-Castro, Castillo-Ossa, Hederich-Martínez, 2023). Research using eye-tracking has revealed cognitive processes tied to programming expertise and underscored the need to enhance Integrated Development Environment (IDE) features to reduce cognitive load from complex code (Davis, Zhu, 2022a, 2022b). Although a single, universally agreed-upon definition of CT has not yet emerged, modern frameworks commonly identify the following components.
Decomposition involves breaking down a complex problem into smaller, more manageable components. This makes it easier to understand the problem and identify specific tasks that need to be addressed. Several studies have explored the concept of decomposition in CT. One study found that students’ methods for breaking down tasks to navigate a 2D grid varied according to their age and math skills (
Mousa, Molnár, 2020). Another study revealed that the patterns used by students in Scratch projects, such as bottom-up development and fine-grained programming, did not conform to traditional decomposition practices (
Kakavás, Ugolini, 2019). Additionally, researchers created a measure of Game Computational Sophistication based on an analysis of Scratch games, which was linked to how students decomposed their games into code (
Rich et al., 2018).
Pattern recognition. There has been a plethora of scientific inquiries on the topic of pattern recognition in the fields of cognitive and neurosciences. However, works that focus on the ability to recognize patterns in the context of CT remain rare. Acosta et al. (2024) reveal a link between CT and algebraic thinking in early childhood education. By utilizing technological resources as a teaching framework, the study identifies pattern recognition as a key skill that bridges both types of thinking. Empirical work supports this connection: CT-infused activities on number patterns improved secondary students’ performance in the mathematical pattern domain, indicating practical overlap between computational and algebraic thinking in pattern-based tasks (Chan et al., 2021). Likewise, in early-childhood educational contexts, pattern recognition has been characterized as central to the development of CT (
Acosta, Alsina, Pincheira, 2024). Patterns serve as a basis for fostering mathematical thinking and play a significant role in the broader processes of representation and abstraction within mathematics (
McGarvey, 2012;
Rizos, Gkrekas, 2024).
Abstraction involves removing unnecessary information from a problem to distill it down to its most critical elements. This simplification enables individuals to navigate complexity more effectively and to identify relevant patterns and solutions (
Cansu, Cansu, 2019). In CT, abstraction works alongside other key processes such as decomposition (breaking down problems) and pattern recognition (identifying similarities) to facilitate a clearer understanding of tasks (
Qian, Choi, 2023).
Algorithmic thinking. J. Wing discusses algorithmic thinking as a crucial component of CT in her foundational works on the subject. In her 2006 article, she defines it as the thought processes involved in formulating problems and their solutions, emphasizing that these solutions can be represented in a way that is executable by an information-processing agent, such as a computer. This definition inherently includes the concept of algorithms, as they are essential for expressing solutions to problems in a structured manner (
Wing, 2006). Algorithmic thinking, a subset of CT, specifically focuses on the formulation of step-by-step procedures to solve problems. This skill is crucial as it allows students to break down intricate tasks into manageable parts and devise algorithms that lead to effective solutions. Studies have shown that developing algorithmic thinking skills not only supports programming education but also fosters a deeper understanding of various STEM concepts through practical applications (
Yusuf, Noor, 2024). The capacity for algorithmic thinking aids in developing logical frameworks that can address computational challenges (
Moon et al., 2020).
These elements are not always explicitly captured in existing CT measurement scales. Rather, such instruments often assess broader or related constructs, leaving some aspects of these components implicitly represented rather than distinctly measured.
Computational thinking scales
Rating scales became widely used in the latter part of the 20th century as a reaction to the waning interest in projective techniques (
Ertugrul-Akyol, 2019). This shift emphasized scientific measurement, refined diagnostic terminology, introduced new juvenile psychopathology models, highlighted the need for clinical outcome measures, and increased awareness of internalizing disorders in youth (
Uher, 2018). The term “rating scale” broadly encompasses checklists, questionnaires, inventories, self- and other-reports, indices, and related tools (
Myers, Winters, 2002). Different approaches to CT scales have been proposed. First, since CT is a skill implemented in everyday life and not reserved uniquely to programming, some authors suggest scales based on real-life events and scenarios (
Kang et al., 2023). Others are dedicated to formulating and validating a scale reserved solely for CT in the context of programming (Chu, Liang, Tsai, 2019). Several promising CT scales have been proposed, with diverse psychometric approaches to capturing distinct CT components (Román-González, 2015;
Sawiji et al., 2024).
The
Korkmaz Computational Thinking Scale (CTS) is a measurement tool designed to assess CT skills among students. Developed by Korkmaz et al. (2017), it includes 29 items across five factors that assess creativity, algorithmic thinking, critical thinking, problem-solving, and cooperativity, originally designed for university students. The Korkmaz CTS has undergone rigorous validation processes, including exploratory and confirmatory factor analyses. These studies demonstrate acceptable psychometric properties, indicating that the scale reliably measures CT skills (
Korkmaz, Çakir, Özden, 2017). It has been adapted for different cultural contexts, such as a Thai version for junior high school students (
Junpho, Songsriwittaya, Tep, 2022); these adaptations maintain the core structure while ensuring relevance to local educational settings.
The
Computational Thinking Scale (CTS), developed by Meng-Jung Tsai, Jyh-Chong Liang, and Chung-Yuan Hsu (2021), is a validated 19-item tool for evaluating students’ CT skills in various educational settings. The scale, vital for computer literacy education, targets five CT dimensions: abstraction, decomposition, algorithmic thinking, evaluation, and generalization. It has been rigorously validated through exploratory and confirmatory factor analyses to ensure reliability and accuracy (Tsai, Liang, Hsu, 2021). Gök and Karamete (2023) conducted a Turkish adaptation of the scale to assess secondary school students’ CT skills. The study, involving 454 high school students, demonstrated the instrument’s validity and reliability, confirming the original five-factor structure. The Cronbach alpha coefficients obtained were 0.84, and McDonald’s omega coefficients were 0.86 (
Gök, Karamete, 2023). Both scales identify five factors representing key components, but with different conceptual emphases. The Korkmaz scale incorporates a broader set of dispositions, including creativity and cooperativity, while the Tsai scale operationalizes the Selby and Woollard (
Selby, Woollard, 2013) CT framework, focusing on abstraction, decomposition, algorithmic thinking, evaluation, and generalization.
Computational thinking in Russia
Global digital transformation has increased demand for skilled programmers in Russia, supported by a strong Soviet-era foundation in mathematics and science education. The 1985 introduction of “Foundations of Informatics” into Soviet schools aimed to develop algorithmic thinking and required the training of thousands of teachers (
Khenner, Semakin, 2014). In the 1990s and 2000s, curriculum autonomy in Russian schools emphasized algorithmic thinking, computer modeling, and logical reasoning through programming, and Informatics moved into middle school under the guidance of the Federal Educational Standards (FES), which permit flexible content choices and offer basic or advanced high-school options; elements of informatics are also introduced in elementary education (
Khenner, Semakin, 2014). While the FES outline broad learning outcomes, textbooks intended for use in schools must pass certification confirming compliance with FES requirements (
Khenner, Semakin, 2014). Russian universities require Unified National Examinations for admission, with Informatics offered as an optional examination subject (
Khenner, Semakin, 2014). Some tools for measuring digital literacy, such as the DIGLIT instrument, are notable yet remain scarce in Russia (
Авдеева, Тарасова, 2023). Despite this educational foundation, CT as a research construct remains relatively understudied in the Russian context.
The present study
The present study aims to adapt and compare two validated CT scales within a population of Russian programmers. Despite growing demand for IT specialists in Russia, CT remains underexplored. Government initiatives promote IT careers, underscoring the importance of computational skills. Adapting CT scales to Russia will enhance understanding and inform educational program development. We selected two validated CT scales for adaptation based on their established validity, relevance to programming populations, and suitability for the Russian context. Using two scales — rather than one or several — allows for a focused yet comprehensive comparative analysis while maintaining feasibility within the study scope. The comparison aims to evaluate and contrast the psychometric properties of both instruments, including reliability and construct validity, to determine which scale more accurately captures programmers’ self-assessed CT. We hypothesized that both scales would be applicable within the context of Russian programmers; we further hypothesized that the scales would operationalize distinct constructs within CT.
Materials and methods
Scale selection and translation
During the literature review process, several promising CT scales were identified for further consideration. We reviewed over 21 scales; the two scales described below were chosen because they comprehensively and reliably assess core aspects of CT.
Inclusion criteria:
- Items must directly relate to the construct of CT. This was assessed via the items’ relevance towards the key CT components;
- The scale should be based on existing theoretical frameworks and supported by empirical research that validates its relevance and effectiveness;
- The scale should include a range of items that capture different aspects of the construct to ensure comprehensive measurement;
- Items must be clear, concise, and easily understood by the target population to avoid misinterpretation;
- The scale should be adaptable to various cultural contexts.
Consequently, scales containing the following items were excluded from consideration:
- Items that are vague or ambiguous;
- Items that overlap significantly in content or meaning
- Items without empirical support or those that have not been tested for validity and reliability
The Korkmaz CT scale is designed to cover various dimensions, allowing for a more nuanced understanding of an individual’s CT skills. The CT scale proposed by Tsai et al. (2021) is applicable to students beyond the middle school level across various educational settings, making it more applicable for a younger pool of participants. In this study, the Tsai et al. CT scale is designated “Scale 1” (19 items), and the Korkmaz et al. scale is referred to as “Scale 2” (29 items).
To ensure that the translated scales retain their original meaning and psychometric properties, we employed the back-translation method, a widely recognized procedure in cross-cultural research, particularly effective in verifying the accuracy and conceptual equivalence of psychological assessments across different languages (
Brislin, 1970). We engaged two independent translators for each scale; this approach improves translation reliability and reduces single-translator bias by capturing diverse linguistic nuances. Translators independently performed forward translations, followed by back-translation by a different translator unfamiliar with the originals. Comparing versions identified discrepancies and ensured fidelity to Korkmaz et al. and Tsai et al.’s constructs. The translated scales (Scale 1: 19 items; Scale 2: 29 items) are included in the Appendix in the order administered. According to the International Test Commission guidelines, adaptation encompasses not only translation but also evaluation of cultural relevance; recent methodological work further emphasizes assessing the cognitive validity of adapted items to ensure they elicit the intended response process (Pillet et al., 2023). Our review of the items identified no broad culturally specific content requiring substantive re-design; however, a small number of items required culturally informed lexical choices during translation (e.g., the Russian word for “dream,” which can denote either an aspiration or a sleeping vision; see Discussion). We performed psychometric validation on a Russian sample to confirm the scales’ reliability and factorial validity. Both scales had previously been successfully adapted and validated in other languages, which informed our choice to include them in the present study.
Participants and procedure
The study included expert programmers and computer science students. We protected the privacy of underage participants by anonymously collecting data. Informed consent emphasized that participation was voluntary. These measures strictly follow established ethical research standards (
American Psychological Association, 2017;
British Educational Research Association, 2018). The initial dataset included 167 survey responses assessing CT skills and attitudes. The survey covered demographics (age, programming experience, dominant hand) and 48 Likert-scale items on CT, problem-solving, and collaboration. Programming experience was converted from years to months, and participants with less than 6 months of experience were excluded to focus on those with basic programming skills. This resulted in a final analytic sample of 148 participants (N = 148) after filtering. The Likert-scale questions were rated on a 5-point scale ranging from “1 — strongly disagree” to “5 — strongly agree”.
We analyzed data from 148 participants with a mean age of 20.7 years (SD = 5.7), ranging from 15 to 46 years (median = 18, IQR = 17—22), with a gender distribution of 75% male (n = 111) and 25% female (n = 37). The majority of participants were right-handed (85.8%, n = 127), with 11.5% left-handed (n = 17) and 2.7% ambidextrous (n = 4). Most participants were students affiliated with the Sirius University of Science and Technology, a federal research university in southern Russia (81.1%, n = 120), while 18.9% were working professionals (n = 28). Participants reported an average of 4.2 years of programming experience (SD = 4.8), ranging from 0.5 to 26 years (median = 3, IQR = 2—5). Python was the most frequently cited favorite programming language (n = 87), followed by C++ (n = 32), JavaScript (n = 19), Java (n = 14), C# (n = 11), and TypeScript (n = 8).
Data analysis
Data analysis was conducted using two primary statistical environments. All preliminary data processing, calculation of descriptive statistics, Pearson correlation analysis, Mann–Whitney U test, and scale reliability analysis (Cronbach’s α) were performed in RStudio (version 2024.10.1) using the R programming language (version 4.4.2). Exploratory factor analysis (EFA) was conducted with the psychometric analysis package psych (version 2.4.3). For confirmatory factor analysis (CFA), the Python programming language (version 3.13.1) and the structural equation modeling library semopy (version 2.4.1) were used.
Data analysis proceeded in several sequential stages. In the first stage, we assessed the suitability of the data for factor analysis. Bartlett’s test of sphericity (
Bartlett, 1950) yielded statistically significant results (p < 0.001), and the Kaiser-Meyer-Olkin (KMO) measure of sampling adequacy (
Kaiser, 1974) was high for both scales and their combination (see Table 1), confirming the appropriateness of conducting factor analysis.
To adapt the scales for the new population, we tested data fit using CFA on one- and two-factor models, both showing poor fit (CFI and TLI < 0.90). This indicated a differing factor structure, prompting the use of EFA on each scale and on combined items to uncover the empirical latent structure. We applied principal axis factoring with oblique rotation (oblimin), following recommendations for EFA in psychological research (
Fabrigar et al., 1999), as the computational thinking factors were theoretically expected to correlate. The number of factors retained was determined based on scree plot analysis.
In the final stage, following standard validation practices, we conducted a subsequent CFA to test the models derived from the EFA phase. This allowed assessment of the stability and fit of the empirically identified structure to our data. Model adequacy was evaluated using multiple fit indices: Root Mean Square Error of Approximation (RMSEA), Comparative Fit Index (CFI), and Tucker-Lewis Index (TLI), with acceptable thresholds defined as RMSEA ≤ 0.08, CFI ≥ 0.90, and TLI ≥ 0.90 (
Hu, Bentler, 1999).
Results
Exploratory factor analysis and reliability analyses were conducted to examine the factor structure and internal consistency of the two scales, both independently and in combination. Bartlett’s test of sphericity yielded significant results for Scale 1, Scale 2, and the combined scale, indicating sufficient inter-item correlations for factor analysis. KMO values were 0.82 for Scale 1, 0.76 for Scale 2, and 0.76 for the combined scale, demonstrating sufficient sampling adequacy. Notably, EFA revealed a single-factor structure for Scale 1, while Scale 2 demonstrated three factors. When both scales were analyzed together, a four-factor structure emerged. Internal consistency was measured via Cronbach’s α (α = 0.86 for Scale 1). For Scale 2, α values were 0.82, 0.84, and 0.76 for the three factors. The four combined-scale factors had α values of 0.89, 0.84, 0.78, and 0.77 (see Table 1). These values indicate the scales’ suitability for further factor analysis, with acceptable to good reliability. Further examination of factor loadings is necessary to interpret each factor’s meaning.
Table 1
Показатели пригодности для факторного анализа и надежности
Factor Analysis Suitability and Reliability Statistics
|
Показатель / Indicator
|
Шкала 1 / Scale 1
|
Шкала 2 / Scale 2
|
Шкала 1 + Шкала 2 / Scale 1 + Scale 2
|
|
Критерий Бартлетта / Bartlett test
|
p < 0.001
|
p < 0.001
|
p < 0.001
|
|
КМО (мера адекватности выборки) / KMO (MSA)
|
0.82
|
0.76
|
0.76
|
|
Число факторов / Number of factors
|
1
|
3
|
4
|
|
α Кронбаха / Cronbach’s α
|
0.86
|
0.82; 0.84; 0.76
|
0.89; 0.84; 0.78; 0.77
|
Note. The scales demonstrate good suitability for factor analysis; the extracted factors have acceptable to good internal consistency. Шкалы демонстрируют хорошую пригодность для факторного анализа; выделенные факторы обладают приемлемой и хорошей внутренней согласованностью.
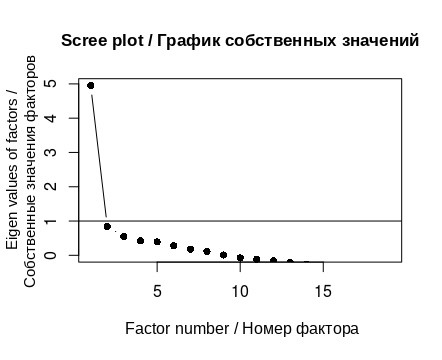
Scree plot analyses guided factor retention for each scale. Scale 1’s plot showed a clear elbow after the first factor, indicating unidimensionality (Fig. 1). Scale 2’s plot suggested three factors, with the curve flattening after the third (Fig. 2). The combined scales indicated four factors, aligning with the separate structures (Fig. 3). These results, alongside other criteria and theory, inform the interpretation of the scales’ constructs.
Fig. 1. Scree plot, Scale 1
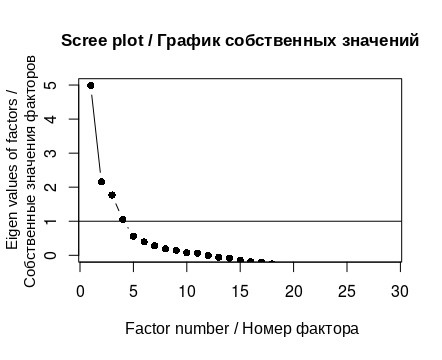
Fig. 2. Scree plot, Scale 2
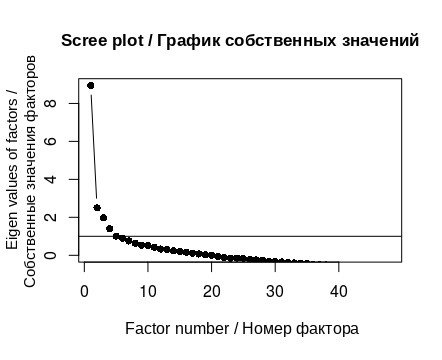
Fig. 3. Scree plot, Scales 1 and 2 combined
Factor loadings range from −1 to +1 and indicate the strength and direction of the relationship between items and factors. Values near ±1 indicate stronger influence. Loadings ≥ 0.40 indicate moderate correlation, while ≥ 0.70 suggest the factor adequately explains the variable’s variance. The sign of the loading indicates the direction of the relationship. In the present analysis, factor loadings were examined to assess the association between each item and its respective factor. Table 2 presents all factor loadings for the items of both scales. For clarity, “Q” denotes the item number, and the suffixes “_1” and “_2” indicate the corresponding scale.
Table 2
Факторные нагрузки и общности (h²) для объединенной шкалы
Factor loadings and communalities (h²) for the combined scale
|
Пункт / Item
|
Ф1 / F1
|
Ф2 / F2
|
Ф3 / F3
|
Ф4 / F4
|
Общность h²
|
|
Q1_1
|
0.051
|
0.178
|
−0.112
|
0.153
|
0.063
|
|
Q2_1
|
0.520
|
−0.011
|
0.151
|
0.081
|
0.294
|
|
Q3_1
|
0.616
|
0.033
|
0.189
|
0.109
|
0.428
|
|
Q4_1
|
0.210
|
0.113
|
0.152
|
0.124
|
0.095
|
|
Q5_1
|
0.414
|
0.089
|
0.121
|
0.192
|
0.231
|
|
Q6_1
|
0.504
|
0.211
|
0.050
|
−0.010
|
0.301
|
|
Q7_1
|
0.516
|
0.152
|
0.078
|
0.041
|
0.297
|
|
Q8_1
|
0.455
|
−0.150
|
0.181
|
0.198
|
0.302
|
|
Q9_1
|
0.557
|
−0.088
|
0.213
|
0.251
|
0.427
|
|
Q10_1
|
0.418
|
−0.079
|
0.407
|
0.153
|
0.370
|
|
Q11_1
|
0.772
|
−0.051
|
0.053
|
0.012
|
0.602
|
|
Q12_1
|
0.629
|
−0.122
|
−0.178
|
0.141
|
0.462
|
|
Q13_1
|
0.475
|
−0.251
|
−0.052
|
−0.103
|
0.302
|
|
Q14_1
|
0.647
|
−0.111
|
−0.104
|
0.073
|
0.447
|
|
Q15_1
|
0.281
|
−0.210
|
−0.209
|
−0.112
|
0.179
|
|
Q16_1
|
0.507
|
−0.018
|
−0.163
|
−0.039
|
0.285
|
|
Q17_1
|
0.214
|
−0.321
|
0.009
|
−0.150
|
0.171
|
|
Q18_1
|
0.582
|
−0.289
|
−0.094
|
0.053
|
0.434
|
|
Q19_1
|
0.403
|
−0.281
|
−0.059
|
−0.021
|
0.245
|
|
Q20_2
|
0.419
|
0.068
|
0.113
|
−0.320
|
0.295
|
|
Q21_2
|
0.102
|
0.334
|
0.101
|
0.103
|
0.143
|
|
Q22_2
|
0.601
|
0.011
|
0.049
|
−0.114
|
0.377
|
|
Q23_2
|
0.442
|
0.183
|
0.009
|
−0.179
|
0.261
|
|
Q24_2
|
0.504
|
−0.143
|
0.048
|
0.178
|
0.308
|
|
Q25_2
|
0.600
|
0.081
|
0.098
|
0.151
|
0.399
|
|
Q26_2
|
0.179
|
0.111
|
0.108
|
0.158
|
0.082
|
|
Q27_2
|
0.500
|
0.131
|
0.243
|
−0.061
|
0.327
|
|
Q28_2
|
0.054
|
−0.009
|
0.451
|
−0.139
|
0.220
|
|
Q29_2
|
−0.022
|
−0.041
|
0.701
|
−0.051
|
0.494
|
|
Q30_2
|
0.103
|
−0.073
|
0.793
|
0.012
|
0.633
|
|
Q31_2
|
0.119
|
0.282
|
−0.021
|
−0.041
|
0.103
|
|
Q32_2
|
0.142
|
−0.131
|
0.622
|
0.052
|
0.421
|
|
Q33_2
|
0.063
|
−0.011
|
0.443
|
0.103
|
0.213
|
|
Q34_2
|
−0.013
|
0.791
|
−0.033
|
0.051
|
0.633
|
|
Q35_2
|
0.052
|
0.802
|
−0.022
|
0.022
|
0.643
|
|
Q36_2
|
0.111
|
0.711
|
−0.091
|
−0.022
|
0.523
|
|
Q37_2
|
0.082
|
0.691
|
−0.041
|
0.041
|
0.492
|
|
Q38_2
|
0.210
|
−0.018
|
−0.251
|
−0.041
|
0.113
|
|
Q39_2
|
0.380
|
−0.162
|
−0.261
|
−0.071
|
0.243
|
|
Q40_2
|
0.601
|
−0.158
|
0.031
|
−0.083
|
0.389
|
|
Q41_2
|
0.511
|
−0.163
|
0.151
|
0.022
|
0.311
|
|
Q42_2
|
0.481
|
−0.092
|
0.012
|
−0.071
|
0.243
|
|
Q43_2
|
0.052
|
0.033
|
−0.041
|
0.521
|
0.281
|
|
Q44_2
|
0.062
|
0.081
|
−0.052
|
0.522
|
0.281
|
|
Q45_2
|
0.020
|
0.141
|
0.039
|
0.643
|
0.435
|
|
Q46_2
|
0.108
|
0.049
|
0.091
|
0.701
|
0.514
|
|
Q47_2
|
−0.021
|
−0.418
|
0.114
|
0.540
|
0.480
|
|
Q48_2
|
0.012
|
−0.412
|
0.101
|
0.534
|
0.466
|
Note. Factor loadings ≥ 0.40 are bold. Communalities (h²) < 0.25 are also bold, indicating that the factor model weakly accounts for the variance in these items. Факторные нагрузки ≥ 0,40 выделены полужирным. Общности (h²) < 0,25 также выделены полужирным, что указывает на слабое объяснение дисперсии этих пунктов факторной моделью.
Exploratory factor analysis (EFA) and reliability analysis examined the factor structure and internal consistency of 2 scales, individually and in combination. Bartlett's sphericity test was significant for all (p < 0.001), and KMO values (0.82 for Scale 1, 0.76 for Scale 2 and combined) indicated suitability for factor analysis.
Separate EFAs showed one factor for Scale 1 and three for Scale 2, but combined analysis revealed a clearer 4-factor structure. Cronbach's alpha values were: Scale 1 factor α=0.86α=0.86; Scale 2 factors 0.82, 0.84, 0.76; combined factors 0.89, 0.84, 0.78, 0.77 (see Table 1), confirming suitability for further use.
The scree plot supported four factors (see Fig. 3). Loadings ≥ 0.40 were considered meaningful. Items Q1_1, Q4_1, Q15_1, Q17_1, Q21_2, Q26_2, Q31_2, Q38_2, and Q39_2 had low loadings (< 0.40) and low communalities (h² < 0.25), suggesting exclusion in a refined instrument.
Factor 1: “Systematic Problem Solving.” This factor includes most Scale 1 items, reflecting problem solving via decomposition, algorithmic thinking, and evaluation. Highest loadings: Q11_1 (“I usually try to figure out how to implement a solution,” h² = 0.602); Q14_1 (“I usually try to find the most efficient solution,” h² = 0.447).
Factor 2: “Difficulties in Problem-Solving Process” (reverse-coded). This factor is composed mainly of negatively phrased Scale 2 items on solving challenges. Highest loadings: Q35_2 (“Difficulties with where/how to use variables,” h² = 0.643); Q34_2 (“Difficulties visualizing solutions,” h² = 0.633). Negative loadings for Q47_2 and Q48_2 fit logically.
Factor 3: “Inclination toward Collaborative Learning.” This factor covers items about teamwork. Highest loadings: Q30_2 (“More ideas in collaborative learning,” h² = 0.633); Q29_2 (“Enjoy group project tasks,” h² = 0.494).
Factor 4: “Confidence in Math Abilities and Planning.” This factor includes items about confidence in formalization and planning. Highest loadings: Q46_2 (“Use systematic approach,” h² = 0.514); Q45_2 (“Proud of precise thinking,” h² = 0.435).
Finally, we conducted confirmatory factor analysis (CFA) to validate the factor structure. We compared three models: a one-factor model (all items on a single factor), the original two-factor model (Scale 1 items on one factor, Scale 2 on another), and the empirically derived four-factor model from EFA. Model fit was assessed using RMSEA (≤ 0.08 acceptable), CFI (≥ 0.90 acceptable), and TLI (≥ 0.90 acceptable).
CFA results (Table 3) show that, although no model achieved perfect fit, the four-factor model outperformed the one- and two-factor models, with lower RMSEA and higher CFI/TLI.
Table 3
Результаты конфирматорного факторного анализа (CFA) для трех моделей
Confirmatory factor analysis (CFA) results for the three models
|
Модель / Model
|
RMSEA
|
CFI
|
TLI
|
|
Однофакторная / One-factor
|
0.070
|
0.844
|
0.832
|
|
Двухфакторная (исходная) / Two-factor (original)
|
0.067
|
0.854
|
0.843
|
|
Четырехфакторная (по результатам EFA) / Four-factor (EFA-derived)
|
0.058
|
0.895
|
0.881
|
Note. Best fit indices are in bold. Наилучшие показатели соответствия выделены полужирным.
Discussion
CT, and algorithmic thinking in particular, is increasingly recognized as an important contributor to STEM learning, with implications for how problem-solving skills are developed in programming education (
Yusuf, Noor, 2024). The present study employed a Likert-type survey to assess programmers’ self-assessment of CT, consistent with the self-report approach used in the validation studies for both source scales (
Korkmaz, Çakir, Özden, 2017; Tsai, Liang, Hsu, 2021). It is important to note that this method captures participants’ perceptions and subjective evaluations rather than directly measuring CT as an objective skill. To date, many researchers have attempted to construct a CT scale that incorporates all components of CT, but a general consensus is yet to be reached (
Kılıç, Gökoğlu, Öztürk, 2021). Despite extensive study, CT remains imperfectly characterized cognitively, necessitating further psychometric work.
The results of the exploratory factor analysis identified several problematic items with low loadings across all factors (communality h² < 0.25): Q1_1, Q4_1, Q15_1, and Q17_1 from Scale 1, as well as Q21_2, Q26_2, Q31_2, Q38_2, and Q39_2 from Scale 2. Low communality indicates that these items are weakly correlated with the identified constructs and contribute little to measuring CT in this sample. We therefore recommend excluding these nine items from the combined questionnaire for future use in the Russian population, yielding a refined 39-item version.
This study is, to our knowledge, the first effort to introduce these CT scales to a Russian population. Our analysis found a different factor structure than the original scales, likely due to language differences affecting item perception and response styles influencing item loadings. These complexities highlight the need for further research on factor interactions in cross-cultural test frameworks.
Limitations
We encountered several challenges during translation that merit discussion as they can potentially affect the accuracy of the scales. The Korkmaz et al. (2017) scale posed challenges with the words “problem” and “dream.” We chose a Russian word for “problem” that closely matches the original meaning. “Dream” in Russian can either mean images during sleep or personal aspirations; we selected the aspiration meaning following expert advice. These difficulties highlight the importance of precise translation to ensure that scales retain their original structures.
Future inquiries should consider the following directions. First, item refinement: items with low correlations or factor loadings should be revised or removed to improve scale validity; the overlap between two factors suggests they may represent a single underlying construct rather than distinct ones. Second, alternative factor structures — including specific sub-factors within CT, mathematical reasoning, and collaborative learning — should be explored; identifying these dimensions enhances understanding of how individuals engage with these complex constructs. Third, additional testing across diverse contexts and populations is warranted; investigating gender and cross-cultural differences in CT skills can enhance understanding of the construct and its educational implications. Fourth, the reliance on self-assessment via Likert-type items may introduce subjective bias and limit the accuracy of measuring CT skills; future research should incorporate a variety of assessment methods, including performance-based tests and observational measures, to provide a more comprehensive and objective evaluation of CT abilities.
Conclusion
This study addresses gaps in understanding computational thinking (CT), particularly in underrepresented regions like Russia, using psychometric methods. A combined scale revealed a reliable four-factor structure with strong internal consistency (Cronbach's alpha 0.77–0.89), supporting its efficacy in measuring distinct CT constructs.
Our study demonstrated that directly transferring the original scales to the Russian sample does not preserve their initial factor structures. However, the proposed 4-factor model, supported by CFA results (RMSEA = 0.058, CFI = 0.895), shows good fit to the data and high internal consistency. Thus, we recommend the refined 39-item combined scale (after excluding 9 items with low factor loadings) as a reliable instrument for assessing self-perceptions of CT aspects among Russian-speaking programmers and students.