Introduction
Artificial intelligence (AI) technologies are having a major global impact on social and economic structures (Howard, 2019), including education. Critical discussions about the opportunities and risks of AI are leading universities to rethink their functions, teaching models, and the role of the teacher (Popenici, Kerr, 2017). On the one hand, AI supports personalized learning, streamlines administrative tasks, and improves educational outcomes (Kazimova et al., 2025; Onesi-Ozigagun et al., 2024). It also increases access to education and its effectiveness through adaptive content and automation (Begum, 2024; Crompton, Song, 2021; Singh, Hiran, 2022). On the other hand, integrating AI involves risks related to data privacy, algorithmic bias (Harry, 2023; Kazimova et al., 2025), academic honesty, and a shift in the teacher's role from lecturer to mentor (Bobula, 2024; Lukichev, Chekmarev, 2023; Cabero-Almenara et al., 2024).
In Russia, the development of the AI agenda in higher education is reflected in the launch of specialized degree programs (Ryabko, Gurtov, Sepus, 2022), the creation of a regulatory framework, and professional development courses for teachers (Elsakova, Markus, 2024). However, research focusing specifically on the factors that influence university teachers' use of AI is only just beginning. Little is known about which tools can be used on Russian samples to measure these constructs. Two of the larger studies are Sysoeva's work (Sysoeva, 2023) on university teachers' awareness of AI's potential and their readiness to use AI in practice, and the results of in-depth interviews and an online survey conducted by SberUniversity and GeekBrains (Managing change in education..., 2023).
The aim of this study is to adapt and validate a questionnaire for examining the factors that influence higher education teachers' use of AI technologies. Through our research, we seek to advance this area of knowledge and continue the line of work on the use of AI in teaching and learning (Rezaev, Tregubova, 2023).
Several questionnaires have been developed in international research to study the acceptance and use of AI. These include surveys based on the Unified Theory of Acceptance and Use of Technology (UTAUT / UTAUT2) (Bayaga, 2025; Venkatesh et al., 2012), an AI literacy questionnaire (Lérias, Guerra, Ferreira, 2024), and tools based on the Technology Acceptance Model (TAM) (Wang et al., 2025). Several studies validate survey scales for assessing teachers' perceptions and readiness to implement AI in education. For example, a multidimensional scale for measuring teachers' attitudes toward AI in education (Galindo-Domínguez et al., 2024) is based on four components: readiness to use AI, overall attitude toward AI, professional expectations of AI, and personal experience with AI. The Teachers' Acceptance of AI (TAAI) scale includes classic components: perceived usefulness of AI, perceived ease of use, behavioral intention to use AI, self-efficacy in using AI, and anxiety about AI (Guo, Shi, Zhai, 2024). The Readiness for Artificial Intelligence Applications Scale (RAIS) assesses teachers' readiness to use AI (Ramazanoglu, Akın, 2025) and includes three factors: teachers' technological self-efficacy in the context of AI, readiness to apply AI, and ethical awareness.
Because of its expanded structure and consideration of various aspects of AI use by university teachers, we were attracted to a tool based on the UTAUT and TAM models. This tool was tested in the contexts of Arab states of the Persian Gulf and India (Rahiman, Kodikal, 2024). This questionnaire had a confirmed factor structure and sufficiently reliable scales: Cronbach's alpha ranged from 0,71 to 0,87. With a confirmed factor structure and reliability, it is suitable for cross-cultural adaptation and testing of psychometric properties in the Russian educational context. Therefore, we will now present the original tool, the translation procedure, data collection, and statistical analysis.
Materials and methods
Structure of the original version of the questionnaire. The original study used an adapted survey to assess factors influencing university teachers' implementation of AI. The survey consisted of 47 items divided into 10 key constructs, measured on a 5-point Likert scale (from “Strongly disagree” to “Strongly agree”). Table 1 presents the main characteristics of the constructs studied.
Table 1
Main constructs of the original article
|
Cunstruct |
Scale theme |
Number of items |
|
Awareness |
Familiarity with AI tools and their areas of application in Higher Education |
4 |
|
Perception of risks |
Ethical, legal, and procedural risks of AI use |
5 |
|
Expected performance |
Benefits of AI for enhancing learning and management effectiveness |
5 |
|
Expected effort |
How easy it is for teachers to learn and use AI technologies |
5 |
|
Facilitating conditions |
Availability of resources, infrastructure, and support from the university |
5 |
|
Attitude |
General value-based and emotional attitude towards AI in education |
5 |
|
Behavioral intention |
Willingness to recommend and plan the use of AI |
5 |
|
Social usefulness |
Perceptions of how AI is changing the HE system and society as a whole |
4 |
|
Professional involvement |
Influence of AI on the teacher's interest and participation in work |
4 |
|
Actual AI use |
Specific practices of using AI in teaching and administration |
5 |
In the study, the psychometric properties of the tool were assessed using partial least squares structural equation modeling (PLS-SEM). Convergent validity analysis showed that the average variance extracted (AVE) values for all constructs exceeded the established threshold of 0,5, indicating sufficient convergent validity of the measurement model (Olapade et al., 2023). Discriminant validity was evaluated using the Fornell-Larcker criterion: the square roots of the AVE values for each latent construct were higher than the correlations between that construct and other variables in the model, which meets generally accepted standards (Roemer et al., 2021).
Research methodology and adaptation procedure. The adaptation of the instrument followed the standard method for adapting foreign questionnaires (Epstein et al., 2015). The key translation steps included a pre-translation analysis of the original version and the translation from English into Russian. The questionnaire was translated by staff members of the Department of Theory and Practice of Translation at Togliatti State University. The reconciliation of the final translated version was carried out by the authors in several iterations.
A preliminary test of the resulting version of the questionnaire was conducted in the form of cognitive laboratories. Three teachers from different Russian universities participated in the study: Lomonosov Moscow State University, HSE University, and Ufa University of Science and Technology (UUST). Because some wording of the statements caused difficulties for the participants – during cognitive interviews and pilot testing, some statements were considered ambiguous and difficult to interpret, and several items that were relevant in the original context required significant modification for use in the Russian educational environment – changes were made to the text of the questionnaire while staying close to the original. The final version included 6 of the original 10 scales, with the addition of the authors' own items (Appendix A, Table A1). For empirical testing of the adapted tool, a survey was conducted; the participants are described below.
Study participants. The study sample consisted of 103 respondents from 26 universities in Russia: I.N. Ulyanov Ulyanovsk State Pedagogical University (23%), Togliatti State University (11%), Stolypin Volga Region Institute of Administration (9%), HSE University (7%), Dimitrovgrad Engineering and Technological Institute of NRNU MEPhI (6%), Lomonosov Moscow State University (5%), and a number of other universities.
For recruitment, the snowball method was used – sending personal requests to university representatives, as well as using personal connections on a voluntary and free basis. The survey was hosted on the Microsoft Forms platform. Participants were asked to answer questions about their socio-demographic profile and then proceed to the items of the questionnaire. The age of the participants ranged from 18 to 56 years, with a predominance of respondents over 45 years old (43%). Among the respondents, 64% were women and 36% were men. The distribution of respondents by position was as follows: associate professor – 49%; professor – 16%; teaching assistant – 11%; senior lecturer / lecturer – 15%; trainee / laboratory assistant – 6%; head of department / laboratory – 5%.
Analysis methods. Psychometric characteristics. The fit between the theoretical model and the observed model of the questionnaire was tested using confirmatory factor analysis (CFA). The adapted instrument used a five-point Likert scale. Since the distribution of responses deviated from normality, the CFA was conducted using maximum likelihood estimation with robust standard errors and the Satorra-Bentler correction (MLM – Maximum Likelihood Mean-adjusted).
Model fit was evaluated using several indices: Robust Comparative Fit Index (CFI) – approximately 0,9 or higher; Robust Tucker-Lewis Index (TLI) – also approximately 0,9 or higher; Robust Root Mean Square Error of Approximation (Robust RMSEA) – approximately 0,08 or lower; and Standardized Root Mean Square Residual (SRMR) – approximately 0,1 or lower (Hu, Bentler, 1999). Additionally, two exclusion criteria were used when selecting items: (1) standardized factor loading below 0,3, and (2) the presence of local dependence between items.
Reliability of the questionnaire was assessed using two coefficients: Cronbach's alpha (Venkatesh et al., 2012) and McDonald's hierarchical omega (McDonald, 1999). A reliability level of 0,7 or higher was considered sufficient, and a level above 0,8 was considered high (Evers et al., 2013). To check the functioning of the response scale, mean values, standard deviations, and the proportion of responses for each response category were calculated.
Factors influencing the use of AI. To examine the factors associated with teachers' use of AI at the university, linear regression was used. The “Implementation” scale served as the dependent variable, while the other scales of the questionnaire served as independent variables. Control variables for respondents' gender and age were also added to the model.
The analysis was conducted using RStudio software and the “lavaan” package (Rosseel, 2012).
Results
Psychometric characteristics. At the first stage of evaluating the psychometric properties of the instrument, a CFA was conducted to examine the factor structure of the questionnaire. The baseline model reflected the theoretical structure, but the fit indices were unsatisfactory (Table 2).
Table 2
Model fit statistics
|
Model |
Robust CFI |
Robust TLI |
Robust RMSEA (90% CI) |
SRMR |
|
Initial model |
0,870 |
0,848 |
0,087 (0,071 – 0,102) |
0,086 |
|
Final model |
0,932 |
0,917 |
0,068 (0,045 – 0,088) |
0,064 |
To improve the model fit, the statement “I believe that educational content generated by AI is not always accurate and requires careful verification” was removed from the “Risks” scale because its factor loading was below 0,3.
In the “Difficulties” scale, two statements – “It will be easy for me to learn AI technologies in various areas if I understand the principles of how they work” and “I will be able to easily apply artificial intelligence technologies” – showed local dependence due to their reverse wording. Therefore, both statements were removed from the model.
To ensure model identifiability, the factor loadings of the two remaining statements in the “Difficulties” scale were fixed as equal. These modifications improved the fit of the model to the empirical data: the fit indices of the final model reached an acceptable level (Table 2).
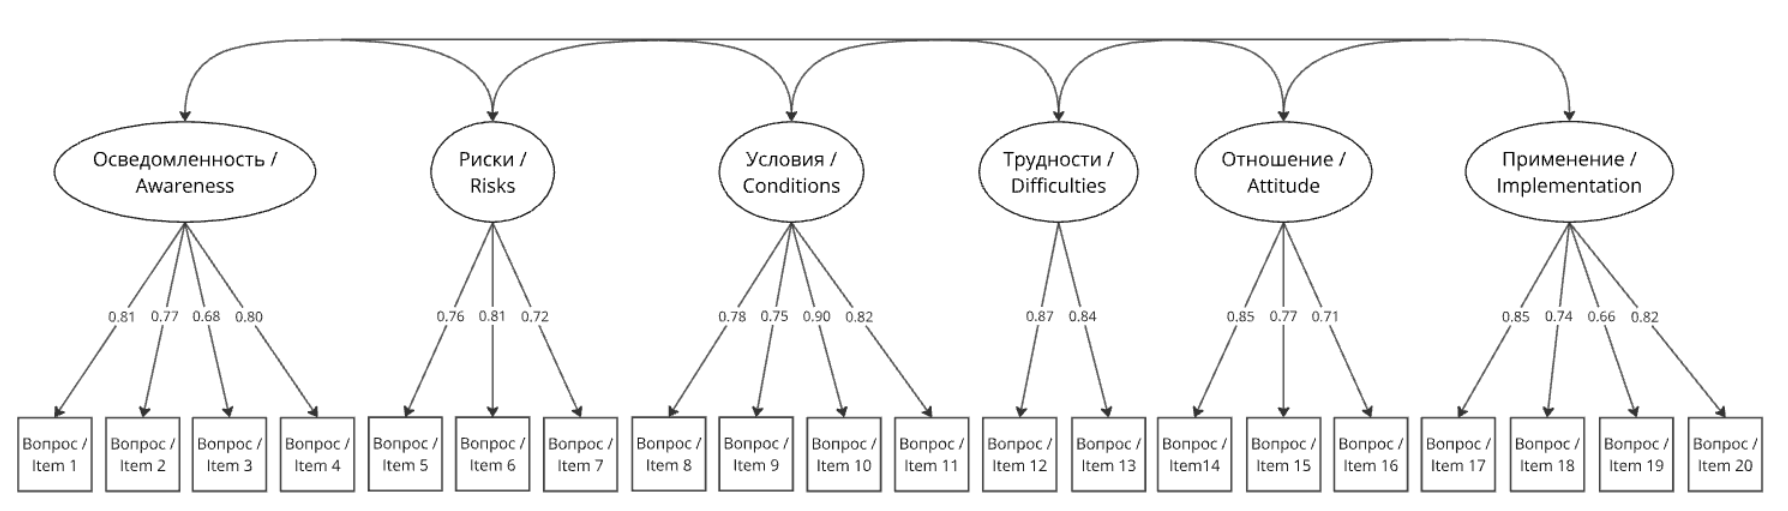
The final model of the questionnaire and the standardized factor loadings are presented in the figure; the correlations between factors are presented in Table 3. All freely estimated factor loadings were significant at the < 0,001 level and were sufficiently high (min = 0,66; max = 0,90). The correlations between factors were as expected: “Risks” and “Difficulties” were negatively related to the other scales, and the perception of risks was related to difficulties in mastering AI and the conditions for its application. Thus, based on the results of the CFA, it can be concluded that the factor structure of the questionnaire was confirmed.
Table 3
Questionnaire factor correlations
|
Scale |
Awareness |
Risks |
Difficulties |
Conditions |
Attitude |
|
Risks |
–0,20 |
– |
|
|
|
|
Difficulties |
–0,45** |
–0,03 |
– |
|
|
|
Conditions |
0,48*** |
–0,02 |
–0,29* |
– |
|
|
Attitude |
0,72*** |
–0,35* |
–0,32** |
0,52*** |
– |
|
Implementation |
0,61*** |
–0,39** |
–0,29* |
0,60*** |
0,67*** |
Note: significance level: *** – p < 0,001; ** – p < 0,01; * – p < 0,05.
The reliability of the scales ranged from 0,80 to 0,89 for both Cronbach's alpha and McDonald's omega (Table 4), indicating a high level of reliability for the questionnaire scales.
Table 4
Questionnaire scale reliability
-
-
Scale
Cronbach’s α
McDonald’s ω
Awareness
0,85
0,85
Risks
0,80
0,80
Difficulties
0,84
0,84
Conditions
0,89
0,89
Attitude
0,81
0,81
Implementation
0,86
0,85
-
To analyze the functioning of the response scale, its main descriptive statistics were calculated. The mean score across all items was 3,31, with a standard deviation of 1,10, indicating a moderate tendency for respondents to agree with the statements and sufficient variability in responses. Moreover, respondents used the full range of scale categories (Table 5). The three central categories were the most popular, with the "Agree" category being chosen most frequently. Despite a slight shift in the distribution toward agreement, it can be concluded that the scale functions satisfactorily.
Table 5
Response scale statistics, %
-
-
-
Response category
Mean selection percentage
Strongly disagree
8
Disagree
21
Neutral
22
Agree
33
Strongly agree
16
-
-
Factors influencing the use of AI. The results of the regression analysis showed that the proposed model explains 69% of the variance in the use of AI in higher education (F(91) = 22,04; p < 0,001; R² = 0,69; Table 6). Three factors emerged as significant predictors. The perception of risks associated with using AI showed a negative relationship (β = –0,29; p < 0,001), whereas a positive attitude toward AI (β = 0,29; p < 0,009) and the presence of conditions for its application (β = 0,39; p < 0,001) were positively correlated with the level of AI use. The conditions factor made the largest contribution to the model. Thus, the obtained results indicate the importance of both individual attitudes and external conditions for the use of AI technologies in higher education.
Table 6
Regression model of predictors for implementing artificial intelligence in educational practice (standardized β coefficients)
-
Predictor
β (SE)
Constant
–0,07 (0,21)
Awareness
0,17 (0,10)
Risks
–0,29*** (0,06)
Difficulties
–0,04 (0,07)
Conditions
0,39*** (0,07)
Attitude
0,29** (0,11)
Male
0,19 (0,12)
Age (ref. 18–24 years)
25–30 years
–0,08 (0,24)
31–37 years
–0,09 (0,27)
38–45 years
0,21 (0,23)
46–55 years
0 (0,23)
56 and more years
–0,07 (0,24)
Model statistics
R²
0,69
Note: significance level: *** – p < 0,001; ** – p < 0,01; * – p < 0,05.
Discussion
The aim of the study presented here was to adapt a foreign questionnaire on the factors influencing the use of AI by higher education teachers (Rahiman, Kodikal, 2024) to the Russian linguistic and cultural context. The results obtained not only confirmed the psychometric validity of the instrument but also made it possible to interpret the specific features of Russian teachers' perceptions of AI in comparison with data from international studies.
In the Russian-language version of the questionnaire, we reduced the number of included scales (from 10 to 6) and items (from 45 to 20) compared to the original version, with two items being removed during the analysis. As a result of confirmatory factor analysis, six factors were identified: “Awareness”, “Perceived Risks”, “Facilitating Conditions”, “Attitude”, “Behavior”, and “Difficulties”. The variability in respondents' answers and the moderate tendency to agree with the statements indicate that university teachers' perceptions of AI are still mixed, which may be explained by the relatively recent introduction of AI in higher education in Russia (Elsakova, Markus, 2024). This finding is consistent with the results of an earlier study by Sysoeva (Sysoeva, 2023), where university teachers' responses on a Likert scale were similarly variable. On the awareness scale, tendencies toward agreement and disagreement with the statements were observed in roughly equal measure, while teachers were more likely to acknowledge risks than to see favorable conditions in the university educational environment for the use of AI tools.
The results of the regression analysis, which revealed a positive relationship between AI use and attitude and conditions, and a negative relationship with risk perception, are generally consistent with the logic of the original model (Rahiman, Kodikal, 2024) and are supported by other international studies (Bayaga, 2025). The negative relationship found between AI use and teachers' risk perception, although quite expected, raises questions about the presence or absence of sufficient regulatory frameworks for the use of AI in university educational activities and may be related to the ongoing development of the AI field.
Unlike some international samples, where awareness often serves as a key driver of technology use, in our study the “Awareness” factor did not show a statistically significant relationship with the practice of AI use. This suggests that in Russian university settings, knowledge about AI tools is a necessary but not sufficient condition for their integration into teaching practice. The strongest predictor of actual AI use in our study was “Facilitating Conditions” – the availability of resources, infrastructure, and support from the university. This finding highlights the leading role of the organizational context over individual factors in Russian higher education at the current stage of digital transformation. Thus, the barrier to implementation is not so much a lack of knowledge or negative attitudes (which, on the contrary, are generally positive) but rather the absence of a well-developed system of innovation support at the institutional level.
Conclusions
The study presented here made it possible to adapt and validate a questionnaire for examining the factors influencing the use of AI by teachers in Russian universities. The adapted instrument demonstrates good psychometric properties and can be used in further research to monitor the dynamics of AI technology adoption in the academic environment. The main empirical finding of our work is that the decisive role in the integration of AI into the educational process of Russian universities is played not by individual teacher awareness, but by external, organizational conditions, as well as the formation of positive attitudes toward technology while simultaneously reducing perceived risks. This result shifts the focus from tasks of individual teacher training toward the need for systemic changes at the level of educational institutions.
The results obtained have practical significance for the development of higher education. They highlight the need for:
- The development of targeted professional development programs that focus not only on the technical aspects of working with AI but also on forming positive value-based attitudes.
- The creation of a comprehensive system of organizational support for teachers, including technical infrastructure, methodological guidance, and stimulation of innovation.
- The development of a regulatory framework governing the use of AI in the educational process, which may help reduce risk perception.
Our findings emphasize the importance of professional development programs on this topic, incentive measures and support for teachers' use of AI by university administration, the study of teacher attitudes, and the implementation of programs to modify them. For the successful integration of AI into the educational process, teachers' efforts alone are not enough – the key role is played by universities creating favorable organizational and infrastructural conditions.
Future research prospects include applying the adapted questionnaire to more representative samples, as well as conducting longitudinal studies to analyze the dynamics of factors influencing the use of AI in Russian higher education.
Limitations. Despite its significance, the present study has several methodological limitations that should be considered when interpreting the results. The present study has several methodological limitations that should be considered. First, the sample size (N = 103) is relatively small for a comprehensive psychometric analysis. While sufficient for the initial adaptation of the questionnaire, a larger sample is required to generalize the findings to the broader population of Russian university teachers. Second, the sample is not fully representative of different types of universities (regional universities are overrepresented), which limits the extrapolation of the results. Third, the data collection method (“snowball sampling”) may have introduced a self-selection bias towards more motivated teachers. To enhance the validity of future research, it is recommended to increase the sample size, ensuring representativeness across university types and regions, and to supplement the survey with qualitative methods (e.g., interviews, focus groups).