Introduction
Reading comprehension is a better predictor of future academic efficiency [Korhonen, 2012; Savolainen, 2008]. In the field of actual research of reading as a basic meta-subject construct, the problem of accurate assessment of reader’s literacy and objective interpretation of the results has become even more relevant [Ivanova, 2023].
The fact that reading directly includes reading and strategic competence explained the complexity of the considered construct. Strategic competence means the respondent's ability to carry out a perspective and situational reflection of their reading activities and to adapt interaction with the test to improve the result [Van Kraayenoord, 2010].
It is necessary to describe the terminology. There is a school in Russian assessment practice, where the term "test" is applied only to assessment tools consisting of closed-type tasks (with a choice of one or more correct answers) [Shmelev, 2013]. However, according to international practice, we will use this term as an "assessment tool" (EFPA), thus, the test may contain both closed-type and open-type tasks with a open-ended answer [Evers, 2013].
Thus, test behavior is the set of the respondent's interactions with tasks with different characteristics during the test. At the same time, the respondent's actions may be conscious, arbitrary, or spontaneous, not based on planning and control.
We name typical patterns of actions during test behavior as test strategies [Cohen, 2006]. Conscious, thoughtful, based on regulatory skills and reflection, test strategies are a demonstration of metacognitive skills, the development of which is an actual problem for the the regulatory and motivational sphere of students.
The relevance to the current study is explained by the fact that the priority of the didactic paradigm of student subjectivity attracted attention to the investigation and taking into account the individual characteristics of students. The proposed solution is based on the use of a process-oriented approach, in which all the respondents' operations are analyzed in the context of their timing, as well as presented a scheme of reader activity management, which allow to draw conclusions about the conditions that provide or limit reading skills.
The aim of the study is to expand the didactic possibilities of reading tests and provide all members of the assessment process information not only about test results, but also how it was obtained.
Theoretically, the alteration of the test behavior during the test is explained by various factors. Thus, the theory of value and expectations (value expectation theory) describes the relationship between the respondent's perception of a test situation and his action via predicting the probability of success and subjective significance in the case of a correct decision, as well as through assessing the necessary "costs" and expected difficulties [Eccles, 1983; Eccles, 2002]. Thus, theoretically, two factors are associated with the respondent's behavior: 1) his conviction of his own "objective" readiness to solve this task with these characteristics; 2) his ideas about the importance of solving this educational task.
The first factor, in turn, consists of: 1) a subjective assessment of the task characteristics 2) an assessment of one's own readiness in relation to the task. For example, the fact that a respondent skips a task with a volume text may indicate that it seemed too difficult. A rapid guessing behavior in a difficult tasks and simultaneously its absence in relatively easy tasks is the mark of low assessment of one's own readiness (here "difficult" is not meant to be a real difficulty, but perceived complexity, abstraction, a large number of stages, etc.).
The second factor (the inner understanding of the importance of the task) consists of: 1) emotional attitude to the result (close to internal motivation) 2) perception of the "usefulness of the result" for the near future (close to external motivation) 3) "importance of the result" (for example, whether the respondent's success in this task brings him closer to the image of the student he represents himself to) and 4) estimates of the amount of resources required to solve this task (including time, among others) [Eccles, 1983; Lindner, 2019].
The variability of students' interaction with the test tasks is explained on the basis of the concept of language competence by Bachman and Palmer [Bachman, 2010, p. 62]. This concept is based on the fact that the use of speech is conditioned by the interaction of the respondent's strategic competence and the test situation. The complexity of this interaction includes: 1) direct language knowledge, 2) background knowledge, 3) individual characteristics and affective mechanisms that are responsible for evaluating the test situation. In previous studies, it has been shown that the perceived difficulty of the task by the student is related to its format, the presence of difficult vocabulary in the text, the correlation of the task with cognitive operations, the correlation with the length of the passage to which the reading task belongs, and other factors [Ivanova, 2023; Ivanova, 2021].
It is important to note that in addition to strategies based on the use of academic and metacognitive skills (will be described below), there are also "wise-behavior strategies": These are attempts to use background knowledge where it is not provided for by the task as an attempt to guess the answer [Cohen, 2006].
The requirement for the development of universal educational actions (UMS) is described in the Federal State Educational Standard of Secondary Education and Federal State Educational Standard of Primary Education. In the scientific foreign literature, the closest analogue of the regulatory component is metacognitive skills. The developed regulatory skills of students mean the monitoring and evaluating educational activities, the ability to identify their own difficulties and their causes, convey intellectual reflection, etc. Metacognitive activity is exactly the "tracking by students of the process and results of their own cognitive activity in solving learning tasks" [Fomin, 2020].
Initially, the term "metacognitive skills" was described as "the process of careful, conscious thinking, when each action requires prior planning and subsequent evaluation; where decisions and operations are both weighty and risky" [Flavell, 1979]. After many years of research, the term is also used to for the reflection of the process and managing this process [Vandergrift, 2012]. In the context of comprehension of reading tests, it is a conscious activity of controlling of the reading comprehension and conscious solving the test [Cohen, 2007]. Metacognitive skills are the "core of strategic competence" because they help to identify the inefficiency of a student's activity and activate the arbitrary application of effective strategies.[Bachman, 2010].
Metacognitive skills are important during passing tests – using a variety of strategies, students exclude incorrect options, look for clues in the wording of questions, and return to correct answers [Hawker, 2016]. The variability of metacognitive strategies provides a variety of interactions with test tasks of different formats (for example, working with text, drawings, graphs) [Edossa, 2018]. Moreover, where more attention is paid to the metacognitive development of students, where special practices are implemented, students use various reflexive practices during interaction with educational tasks for their effective solution [Liu].
In the context of reading, the connection of metacognitive skills with reading comprehension has been proven [Brown, 1987; Carrell, 1989; Mokhtari, 2002; Phakiti, 2003; Zhang, 2010]. Readers with a high level of understanding use various reading strategies in situations where their metacognitive skills allow them to identify a lack of understanding actively and arbitrarily [Zhang, 2018], mediate the influence of motivational factors on subject abilities [Tibken, 2022].
As for primary student, there is an assumption that control over cognitive skills appears at the age of 8-10 years and is associated with the ability to make decisions in a unusual situation. This ability certainly increases the level of functional literacy of schoolchildren [Akaydın, 2020]. Other studies also confirm that increased awareness of metacognitive strategies expands with age [Bakkaloğlu, 2020].
The procedural component is specific to the considered construct [Van der Stel, 2014]. Some studies of the procedural component in reading were based on the fixation of eye movements, and it was exactly timing that became a key indicator [Tibken, 2022]. The eye movement fixation approach has limitations like it demands sophisticated equipment, small samples and the ambiguity of the conclusions due to noisy data. Another approach, more suitable for big samples based on timing of operations, is fixing the time of interaction with a fragment of text in which the researchers specifically laid inconsistencies, or fixing the time of interaction with the question after reading the text [Van der Stel, 2014].
Readers with a high level of comprehension are more likely to reread complex fragments of text [Zargar, 2019]. Re-reading is one of the actions that is associated with metacognitive skills, because the awareness of misunderstanding leads to the adaptation of reading process, implementation of another actions and is aimed to improving the effectiveness of the whole activity. There is ambiguity in researchers' use of the term "cognitive skills" (or "cognitive strategies"). They are understood as actions used by readers in reading literacy tests to compensate a lack of understanding or overcome difficulties in understanding, for example, identifying meaningful information, searching for connections between text fragments, highlighting summarizing sentences, rereading and searching for details, etc. The ambiguity lies in the fact that the same behavioral indicators (for example, rereading) are evidence of both the "cognitive ability" to make oneself to return to a difficult fragment, and the metacognitive ability to notice a lack of understanding. Theoretically, cognitive skills are a manifestation of developed metacognitive skills – these are the actions that respondents take to implement a "metacognitive" plan [Bachman, 2010]. But in the assessment practice, it is impossible or very difficult to find indicators that would be strictly related only to metacognitive, or only to cognitive skills.
Thus, a review of the literature showed that the factors of variability of test behavior are the characteristics of the respondent, the characteristics of the tasks and their interaction.
The organization of the study, the applied methods and hypotheses
The task of our study was to analyze the "digital traces" (timing, transitions on the test) of students during online test of reading comprehension aimed at identification informative indicators of the individual characteristics of the test behavior while interacting with tasks and with the stimulus material of the test.
Sample: the study was conducted in the spring 2022, there were 2,187 4th grade students from schools in the Siberian city of one million recruited for this study. After deleting the profiles of respondents who missed 5 or more tasks, 2,168 observations were included in the final analysis. Another 15 respondents had from 1 to 4 missed assignments at the end of the test (it can be interpreted as that they did not have enough time), they were used in the analysis.
Assessment tool: We used the "Progress" assessment tool , developed at the Center for Psychometrics and Measurements in Education at the HSE Institute of Education [Bakai, 2023]. We used a specially designed literary text with 23 questions to assess participants’ reading comprehension. The psychometric analysis of the test was carried out via the model of the modern theory of testing Partial credit model, which belongs to the family of Rush models, in the Winsteps software [Linacre, 2016; Masters, 2016]. The test showed significant one-dimensionality: The eigenvalue of the first contrast in the analysis of residues was 1.5, which is less than the conventional criterion of 2.0 [Smith, 2002]. The reliability of the Person reliability test was 0.78/0.81 (real/model), which allows us to identify three groups of respondents differing in level of ability. The reliability of Cronbach's alpha was 0.8, which indicates a high internal consistency of tasks. All the tasks of the test are in agreement with the model – moderate mean-square statistics of the agreement of all tasks are less than the conventional criterion of 1.3 [Linacre, 2016]. Tasks have a difficulty range from -2.32 logits to 2.13 logits, which allows us to evaluate respondents with low, medium and high results. The distribution of respondents' responses is similar to normal.
Assessment: The operation with the text and questions was limited to 40 minutes. The digital assessment took place in computer classrooms of schools. The students' activities during the tests were completely autonomous. Respondents had the opportunity to skip tasks without entering an answer or scroll through the text, return to any stage, and correct answers.
Research hypotheses:
- Indicators of test behavior (uniformity indicators of interactions with tasks, indicators of linearity of completing test tasks, and returns to reading text) allow you to identify groups of students with similar patterns of test behavior.
- Patterns of test behavior are related to students' subject (reading) results.
The process of identifying typical patterns
To identify typical patterns, we used two groups of indicators that are easy to access in the tool's logbook.
Linearity indicators
This is data about returns to the text and tasks. We call linear passing of the test sequential (without returns, omissions) passing of the test with a single reference to the text and subsequent tasks. Non–linear passing of the test is an arbitrary skipping of tasks, inconsistent transition through tasks (transition from the first task to the fifth, etc.), returns to previous tasks, as well as returns to the text.
Non-linearity in passing the test may indicate the use of metacognitive skills (for example, to assess the amount of work ahead before starting the test, skip too difficult tasks to return to them later, or return to the text to clarify what you read).
For the purposes of analysis, from the variable describing the number of returns to the text, we have identified three dummy variables encoded 1/0 (1 – the respondent refers to this variable, 0 – does not relate to this variable): 1) zero returns to the text (1,469 respondents); 2) 1 return to the text (373 respondents); 3) 2 or more returns to the text (329 respondents).
Based on the variable describing the number of returns to tasks, three dummy variables were also used, encoded 1/0: 1) the number of non-linear transitions for tasks is 0 (825 people); 2) the number of non-linear transitions for tasks is 1-5 (952 people); 3) the number of non-linear transitions for tasks is 6 or more (394 people). The choice of data simplification criteria was determined by the goals of achieving group contrast.
Indicators of uniformity.
We assumed that both absolute and relative time indicators would be important characteristics of respondents' behavior. The tool was designed in such a way that reading the text did not take more than a third of the time allotted for the entire test. This was proved during cognitive labs. We also assumed that in the process of working on the test, the difficulty of the tasks and the significance of the educational task of the test may vary depending on the fatigue and situational motivation of the test participants. It was the dynamism of engagement that dictated the necessity of using three time variables in the analysis: 1) the time (duration) of reading the text (stimulus material); 2) the time of passing the first half of the test tasks (this is the stage of introduction with the format of tasks, assessment and adaptation to the difficulty of tasks, to the test situation, to an autonomous format of operation); 3) the time of passing the second half of the test tasks (in the second half of the test there was more tasks for higher levels of cognitive skills: searching for information that is not explicitly given, analysis and synthesis). Of course, the test questions may not be the same in terms of estimated execution time, but in general, the first and second half of the test should be balanced in terms of execution time. One task, which was an open type task and could require significantly more time, was excluded from the analysis. Thus, the first and second half of the test consisted of 11 closed-ended questions.
If the first three variables from this group of indicators describe the absolute working time of students at the "beginning, middle and end of the test", then the next two indicators characterize the dynamics of the duration of interaction with tasks. Since there are no standards for the time of interaction with the tasks in reading tests, we used to analyze the duration of interaction with tasks relative to the average value for the sample.
We allocate a very fast task execution time relative to the entire sample (for convenience, called "fast bursts") and a very long interaction time with test tasks ("slow bursts"). If the student's task completion time is less than -1 standard deviation of time across the entire sample, then this is a "quick spike". If the student's task completion time is greater than +1 standard deviation of time across the entire sample, then this is a "slow spike" – the task was completed for a very long time.
"Fast" and "slow" bursts were analyzed separately for the first and second half of the test.
Table 1 describes the variables of the uniformity of the test: the time of interaction with the text, the first half of the tasks and the second half of the tasks, and the number of "fast" and "slow" bursts in the first and second halves of the tasks.
Table 1. The timing of reading the text, the timing of answering the first and second half of the questions
|
The variable |
The Average |
Standard. off |
The Median |
Min |
Max |
Interquartile range |
|
Total test time |
21,31 |
6,27 |
20,87 |
1,62 |
43,05 |
8,28 |
|
Text reading time |
6,54 |
3,09 |
6,58 |
0,03 |
24,10 |
3,40 |
|
Task time (1 part) |
8,04 |
3,15 |
7,42 |
0,93 |
23,18 |
3,77 |
|
Task time (Part 2) |
6,73 |
2,43 |
6,49 |
0,57 |
18,78 |
3,00 |
|
"Fast bursts" (Part 1) |
0,58 |
0,97 |
0,00 |
0,00 |
9,00 |
1,00 |
|
"Slow bursts" (Part 1) |
1,01 |
1,37 |
1,00 |
0,00 |
9,00 |
2,00 |
|
"Fast bursts" (Part 2) |
0,70 |
1,65 |
0,00 |
0,00 |
11,00 |
1,00 |
|
"Slow bursts" (Part 2) |
1,21 |
1,55 |
1,00 |
0,00 |
10,00 |
2,00 |
A hierarchical cluster analysis was carried out to identify test strategies [Murtagh, 2012]. The advantages of this method is the stability of the results. The analysis took place in two stages: working with a group of linearity indicators and working with a group of uniformity indicators. Linearity indicators included dichotomous variables, so a binary distance was used to calculate the distances between observations, which is calculated as the proportion of elements that are common to two variables. The Euclidean metric was used to calculate the distances between observations of the second group of uniformity indicators. The Ward method, which allows the allocation of clusters in such a way as to minimize intra-group variance, was used as an agglomeration method.
Differences in average test scores between groups were checked using the Kruskal-Wallis criterion, and pairwise differences were checked using the Wilcoxon signed-rank criterion with Bonferroni correction for multiple comparisons. The decision to use nonparametric methods was based on the fact that the requirements for using single-factor analysis of variance were not strictly met. The equality of the distribution of students by gender in clusters was checked using a two-proportional z-test.
Previously, all quantitative variables included in the analysis were standardized with an average of 0 and a standard deviation of 1.
The analysis was performed using the stats package (version 4.2.2) and rstatix (version 0.7.2.) in the R programming environment (version 4.2.2).
Results
For explicit interpretation of the results, both groups of indicators were analyzed separately.
Stage 1. Identification of groups of students using uniformity indicators.
Figure 1 shows the dendrogram obtained from the results of cluster analysis for a group of uniformity indicators.
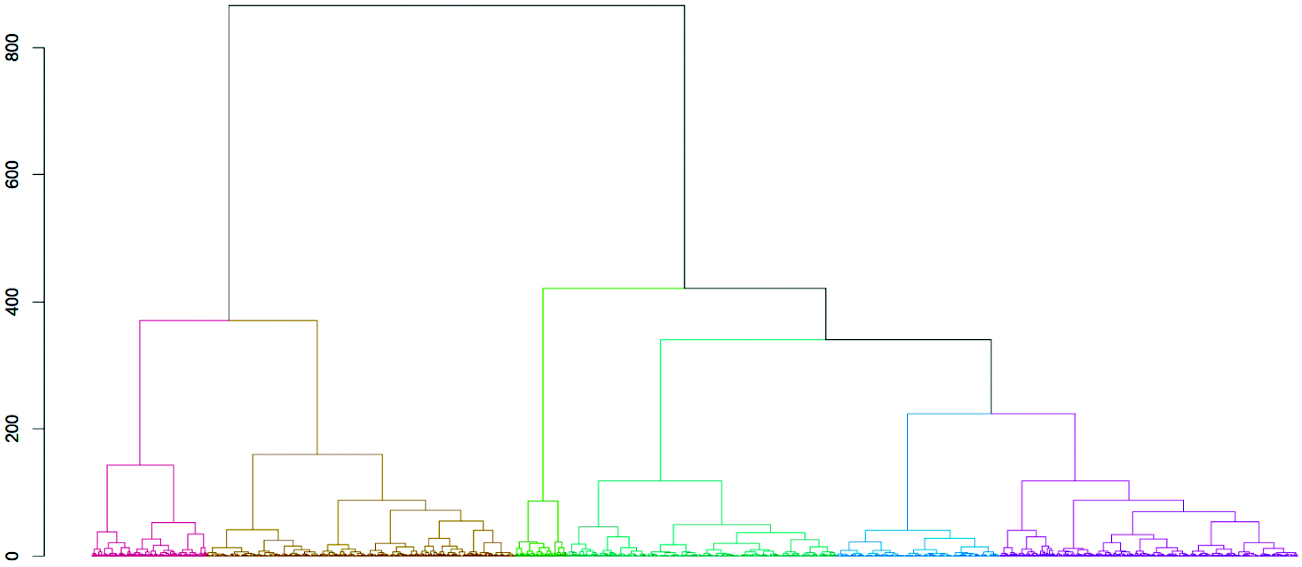
Fig. 1. Dendrogram of hierarchical cluster analysis
Based on the distance balance, a solution of six clusters was chosen.
Table 2 shows the average clusters.
Table 2. Average clusters
|
Cluster |
Number of observations
|
Time (min) |
Bursts
|
|||||
|
The text |
Questions (Part 1) |
Questions (Part 2) |
Fast (Part 1) |
Slow (Part 1) |
Fast (Part 2) |
Slow (Part 2) |
||
|
1 |
482 |
5,60 |
5,50 |
5,42 |
1,43 |
0,21 |
0,46 |
0,38 |
|
2 |
536 |
5,96 |
8,92 |
6,09 |
0,24 |
1,37 |
0,77 |
0,69 |
|
3 |
294 |
6,46 |
6,14 |
5,58 |
0,00 |
0,01 |
0,25 |
0,17 |
|
4 |
554 |
8,55 |
8,43 |
8,89 |
0,28 |
0,95 |
0,09 |
2,44 |
|
5 |
95 |
2,99 |
5,63 |
2,42 |
2,52 |
0,43 |
6,71 |
0,20 |
|
6 |
207 |
6,64 |
14,41 |
9,29 |
0,24 |
3,80 |
0,57 |
3,17 |
Figure 2 shows how the test results of the reading assessment (z-scores) are distributed among clusters.
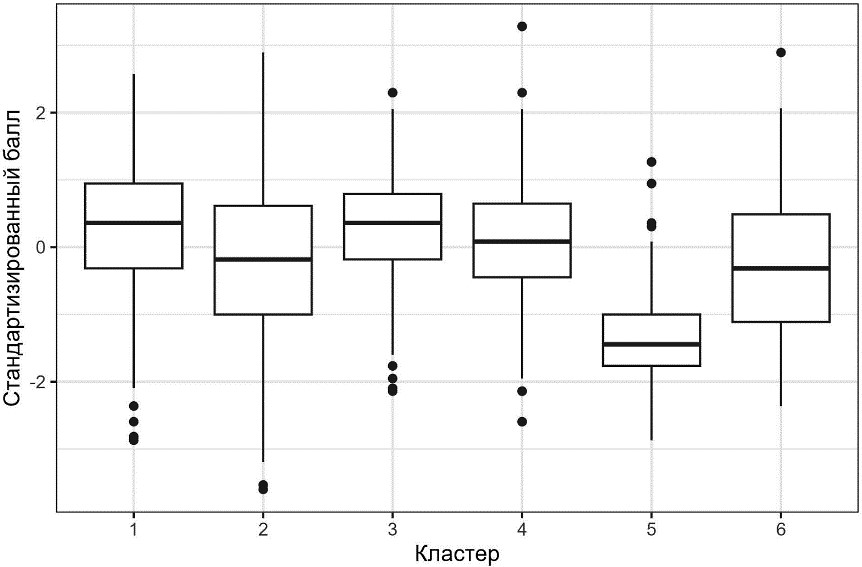 Fig. 2. Distribution of students' test scores by clusters, designed according to uniformity indicators
The Krukal-Wallis criterion showed the presence of statistically significant differences in test scores between the groups (Chi-squared = 246, .78, df = 5, p-value < 0.001). The results of the pairwise comparison did not reveal differences in test scores only between clusters 1 and 3 (p=0.437), 2 and 6 (p=0.198) (Fig. 3).
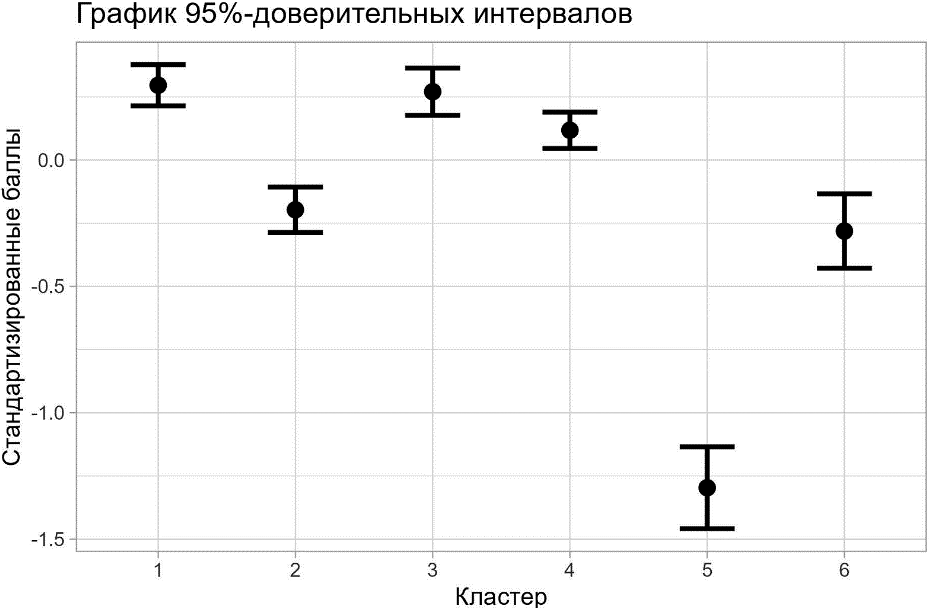
Fig. 3. Graph of 95% confidence intervals of average scores in clusters identified using uniformity indicators.
Table 3 shows how the observations were distributed by gender. Clusters were based on the information about the gender of students, because in the context of studying individual characteristics, it was previously shown that boys are more impatient, need a change of activity, and an active nature of actions [Sнeshukova, 2008], they also tend to evaluate their intellectual qualities and academic success higher than girls [Talakova, 2013]. For example, in PIRLS-2018, despite the improvement in the quality of reading among boys compared to previous studies, girls still showed higher results.
The same conclusions were confirmed by Russian researchers. For example, it is shown that "boys 9-10 years old are technically superior to girls," that is, they read faster, but they are inferior in reading comprehension [Kreshchenko, 2011].
Table 3. For girls in clusters based on uniformity indicators.
|
Cluster |
Percentage of girls |
|
1 |
0,49 |
|
2 |
0,52 |
|
3 |
0,59 |
|
4 |
0,54 |
|
5 |
0,33 |
|
6 |
0,61 |
There are statistically significantly more girls than boys in clusters 3 and 6, (chi-squared = 4.40, df=1, p<0.05 and chi-squared = 15.7, df=1, p<0.05), and in cluster 5, on the contrary, there are statistically significantly more boys (chi-squared = 6.05, df=1, p<0.05). There are no differences in gender distribution in the other clusters.
Stage 2. Identification of groups of students using linearity indicators
Figure 4 shows the dendrogram obtained from the results of cluster analysis for a group of linearity indicators.
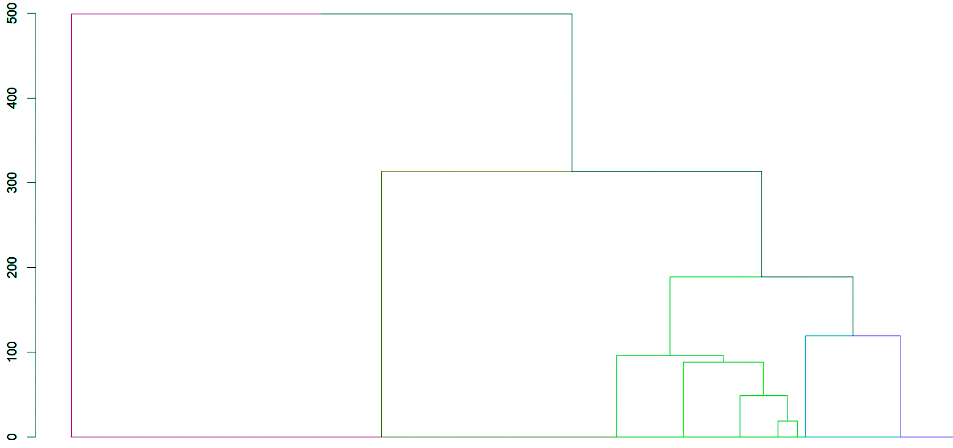
Fig. 4. Dendrogram of hierarchical cluster analysis based on linearity indicators
To analyze the linearity variables, a solution of four clusters was chosen. Table 5 shows the average clusters.
Table 5. Average clusters based on linearity indicators
|
Cluster From 1 to 5 nonlinear transitions for tasks 6 or more nonlinear transitions for tasks No returns to text_0 1 return to text 2 or more returns to text |
Number of observations |
No nonlinear transitions for tasks |
From 1 to 5 non-linear transitions on tasks _0 |
6 or more non-linear transitions on tasks |
No returns to text |
1 return to text |
2 or more returns to text |
|
1 |
378 |
0 |
1 |
0 |
0 |
0,61 |
0,39 |
|
2 |
573 |
0 |
1 |
0 |
1 |
0 |
0 |
|
3 |
460 |
0,14 |
0 |
0,85 |
0,3 |
0,3 |
0,40 |
|
4 |
757 |
1 |
0 |
0 |
1 |
0 |
0 |
The boxplot graph (Fig. 5) shows the distribution the scores on the reading test (z-scores) among the clusters.
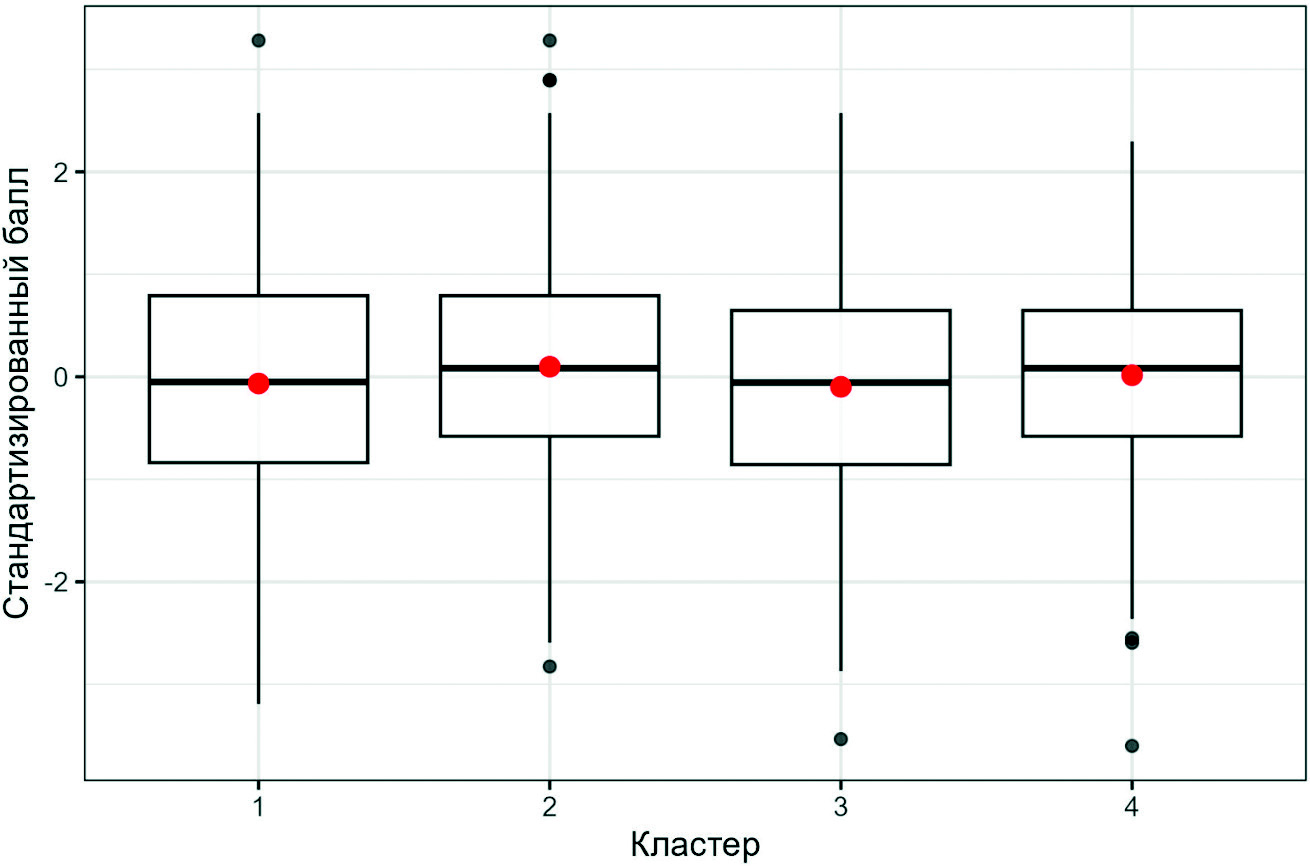
Fig. 5. Distribution of students' test scores by clusters based on linearity indicators
The Krauskal-Wallis criterion showed the presence of statistically significant differences between the groups (Chi-squared = 10, .05, df = 3, p-value < 0.05). The results of the pairwise comparison revealed differences in test scores only between clusters 2 and 3 (p=0,.018 < 0,.05) (Fig. 3). At the trend level (p<0.1), differences in test scores were found in clusters 1 and 2, as well as 3 and 4 (p=0.078).
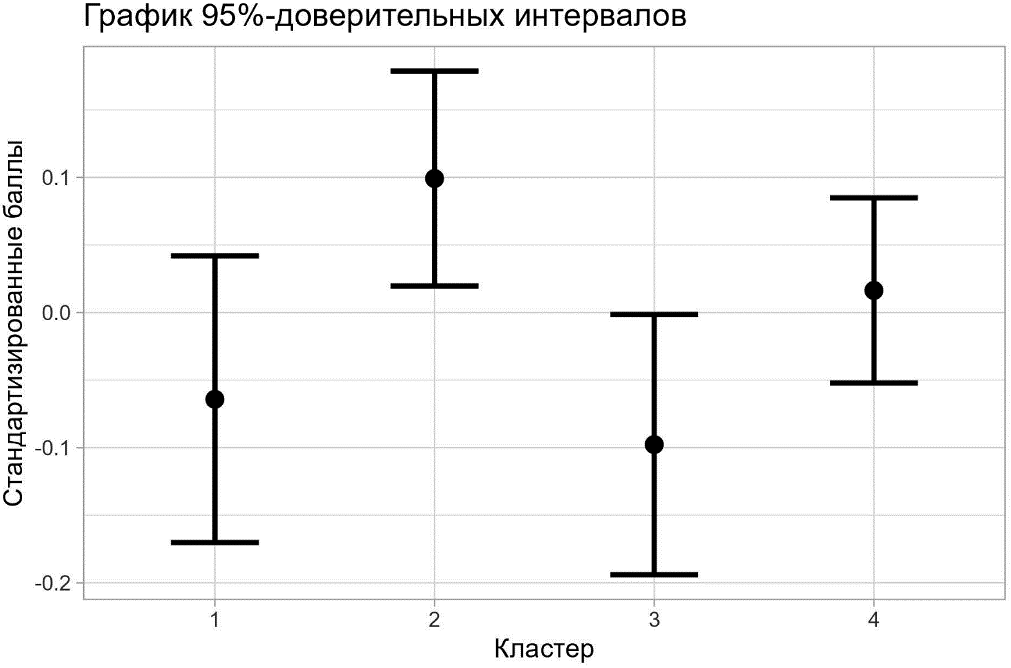
Fig. 6. Graph of 95% confidence intervals of average scores in clusters based on linearity indicators.
Table 6 shows the distribution of the observations according to by gender.
Table 6. Percentage of girls in clusters based on using linearity indicators
|
Cluster |
Percentage of girls |
|
1 |
0,51 |
|
2 |
0,53 |
|
3 |
0,52 |
|
4 |
0,54 |
An analysis of the proportions showed that there were no statistically significant differences in the gender distribution in the four clusters.
Interpretation of the results
Based on the cluster analysis, the following results were obtained:
Clusters based on uniformity of test taking
We identified 6 groups of students in the context of linearity of transitions.
The first cluster is characterized by relatively fast and uniform test taking and the presence of "rapid bursts" in the first half of the test: students did not have problems while interacting with the test, easily answered the first few, relatively less difficult tasks.
The second cluster is characterized by a long test taking and "slow bursts" in the first half of the test. It can be assumed that these children had difficulties with the initial entry into the assessment, adapting to how to perform the test.
The third cluster is characterized by a very high degree of uniformity: it contains students with fewer "fast" and "slow" bursts.
In the fourth cluster, with a relatively long execution time for three parts of the test, a slowdown occurred in the second half of the test (possible interpretation: fatigue).
The fifth cluster includes respondents with a very short time to complete the three parts of the test and the largest number of "quick bursts" – these are "clickers", students who did not get involved in the task and showed low engagement, answered formally, it is impossible to evaluate their reading skills based on the test results, because they did not accept the learning task.
The sixth cluster consists of students with the maximum work time and "slow bursts" in the 1st and 2nd halves of the test, these are also students with the lowest (not counting "clickers") results.
Linearity clusters
We identified 4 groups based on indicators of linearity of access to questions. The most interesting clusters are 1, 2 and 4. Cluster 4 is a completely linear way of access to questions. Cluster 2 describes a pattern with a small number of accesses to questions, but a complete absence of returns to the text. Cluster 1 contains students who moved relatively slowly through the tasks and at the same time they returned to the text. The cluster includes all other students – with a fairly large number of accesses along all the test ("spontaneous surfers" – perhaps it was difficult for these students to understand the format of questions and their access indicate more or less unstructured attempts to navigate using accesses to available pages).
We expected that the absence of returns to the text would be associated with lower subject results, and, conversely, active work with test questions and returns to the text would be associated with a higher score. However, a completely linear test taking is generally associated with positive results, and students who returned to the text, on average, had a lower test score than those who did not return.
Conclusions and discussion of the results
Indicators of test behavior were presented in this study in a purpose to enrich feedback on the results of the academic assessment. By the example of the reader literacy test, we have shown how indicators of uniformity and indicators of linearity of test taking allow to group students into interpretable clusters, which is a confirmation of hypothesis 1.
The study showed the presence of deficits in meta-subject skills (which corresponds to the age of children). Thus, a combination of uniformity indicators can be a reliable criterion for identifying "clickers" – students whose subject results do not make sense to report because they did not complete the tasks.
In primary school, a significant number of students do not return to the text, and if they do, it is not associated with higher subject results. Our hypothesis 2, therefore, finds no confirmation.
The unexpected result was that completely linear passing of the test is not associated with lower subject results. Perhaps, in elementary school, a relatively small amount of text allows you to successfully complete tasks based only on a single reading. However, the lack of the habit of returning to the text can create difficulties when reading in high school. Those students who returned to the text had a lower average test score, which is counterintuitive. Probably, in most cases, these were returns that did not improve reading efficiency.
A longer test execution time may not indicate thoughtfulness, but difficulties, and significantly lower results were found in those who "stay for a long time" on the first half of the tasks (presumably: difficulties with orientation in tasks) and on the second half of the test (presumably: fatigue, demotivation). And although the subject results of these two clusters are equally low, the work on overcoming their metacognitive difficulties should most likely differ.
Respondents with the largest number of non-linear transitions ("surfers") are also characterized by the lowest test score. This is a risk group among the subjects. Even if their active navigation on the test is caused by awareness of their own failure in reading, their cognitive strategies for adapting test behavior and changing the test trajectory are not associated with improved results. The reasons for the complete linearity of the test or "surfing" can be both insufficient experience with digital tools and the lack of a conscious strategy for completing the test.
Research prospects
The authors consider that investigation of the stability of test behavior could be an important problem for the next stage could be (whether the same patterns are repeated in the same students from test to test). In addition, it is very important to look at the functioning of the proposed indicators for students of different ages. This study also shows some gender differences in student test behavior consistent with the results of previous studies. In general, we consider it important to continue the search for interpretable indicators of test behavior that can describe the regulatory sphere of student development.
Limitations and assumptions of the study
We have no way to objectively link the indicators of test behavior with the degree of metacognitive skills formation, we can only assume that these indicators can be interpreted in terms of metacognitive skills.
The limitations of the study also include the fact that we sought to simplify complex data on children's behavior when performing tests (for example, nonlinear transitions on tasks were evaluated on the whole test, regardless of the place of tasks in the test). Additional validation of test behavior indicators and a more detailed assessment of them are required before they can be recommended as a reliable measure that can form the basis of pedagogical interventions.