Introduction
Since the introduction of the Unified State Exam (USE) into the Russian education system, debates about its impact on student performance and academic success in universities have remained at the center of attention of the educational community. Attitudes towards this standardized test are divided into opposing views: while some see it as an objective tool for assessing knowledge, others express concerns about its impact on the quality of education and the process of knowledge formation among students [Kochetkova, 2020; Min'ko, 2017; Prakhov, 2012; Roshchina, 2006; Shchapov, 2009].
Most publications on the influence of the USE on university education can be divided into three groups:
-
Identifying regressors and the influence of factors on university preparation – on GPA or grades in individual subjects, primarily mathematics [Vlasova, 2018; Zamkov, 2013; Kudelin, 2021; Pereyaslavskaya, 2014; Rochev, 2022; Timofeeva, 2015].
-
Predicting university performance based on USE results, primarily using neural network models [Bogdanov, 2015; Poldin, 2011; Rusakov, 2018; Semerikov, 2021].
-
Theoretical understanding and description of psychological factors influencing the USE on university education [Azizova, 2019; Osipov, 2024; Osipov, 2022; Subbotin, 2019].
Alternative approaches to predicting academic achievements include:
-
Comparing predictions based on entrance exam results and psychological characteristics, as discussed in the works of A.L. Duckworth, V.G. Erofeeva, and S.K. Nartova-Bochaver [Erofeeva, 2020; Duckworth, 2019].
-
Reviewing international experience in assessment tests, as conducted in the works of D. Opposs, J.A. Baird, and others [Opposs, 2020].
-
The growing popularity of using machine learning to identify hidden patterns [24; 26; 27; 30; 31].
Let us consider some studies closely related to ours in more detail.
In the study by N.A. Chernyshova [Chernyshova, 2017], data from 6,000 students over 4 years were analyzed. It was noted that the correlation between total USE scores and students' GPA is quite strong, leading to the conclusion that the USE is valid for monitoring the quality of school graduates' education and assessing applicants' knowledge.
O.O. Zamkov and A.A. Peresetsky [Zamkov, 2013] provide a detailed analysis of international research on the impact of national school exams on university education. Based on data from 505 students, they note that USE results are an adequate indicator for selecting students for the MIEF program.
L.B. Pereyaslavskaya and V.I. Pereyaslavsky [Pereyaslavskaya, 2014] examine correlations between USE scores in mathematics and academic performance in general education subjects among 394 students at two universities. The article reveals a significant change in performance compared to school results and shows that grades in mathematics at both universities correlate better with USE scores in Russian than with USE scores in mathematics, indicating problems with school mathematics education in the corresponding region.
E.A. Vlasova, N.M. Mezhennaya, and V.S. Popov [Vlasova, 2018] also note that the relationship between exam grades and USE results is statistically significant and more pronounced than the relationship with total test scores, despite the fact that applicants with high USE scores often demonstrate superficial subject knowledge, which hinders their ability to solve basic-level problems in entrance tests.
O.V. Poldin [Poldin, 2011], based on data from 157 students, studies the dependence of student dropout rates on their USE scores and notes that mathematics scores are most strongly associated with the dropout of economics students.
A.V. Semerikov and M.A. Glazyrin [Semerikov, 2021] propose predicting student success based on USE scores using a neural network model, demonstrating its 65% effectiveness based on data from 36,830 students.
S.V. Rusakov, O.L. Rusakova, and K.A. Posokhina [Rusakov, 2018], after studying data from 274 students using a neural network, suggest creating a "profile" of students at risk of dropout and low academic performance.
The relationship between academic performance and various factors is shown in articles [Kudelin, 2021; Prakhov, 2012a; Rochev, 2022; Oliveira, 2017].
In our study, we tested the extent to which the total USE score reflects individual students' learning abilities, which are later expressed in their performance in various university subjects. The main question requiring investigation is the extent to which USE results truly correlate with subsequent academic success in higher education institutions.
In this regard, the following research hypotheses were formulated:
-
The total USE score correlates with subsequent academic success of students in higher education institutions.
-
High USE scores indicate the presence of basic academic competencies and developed cognitive skills necessary for successful university education.
-
USE results have predictive value for assessing future academic achievements of students.
These assumptions are based on the following facts:
-
The exam is standardized and objectively measures students' knowledge and skills, minimizing the influence of external factors.
-
High USE scores indicate the presence of basic academic competencies and developed cognitive skills necessary for successful university education.
-
Previous studies show a positive correlation between USE results and students' academic achievements, confirming its predictive value.
Research Organization and Methods
Since 2006, UGNTU has operated a system for recording the activities of students and teachers. Based on data collected in the UGNTU information system, our study examined the relationship between USE results and academic performance: GPA, grades in individual subjects, and diploma grades.
Key concepts necessary for justifying the research scheme are defined:
-
Abilities: General (affecting performance in all subjects) and special (needed for success in a specific subject).
-
Competencies and learning outcomes: Competencies (knowledge, skills, and abilities for performing activities) and learning outcomes (specific knowledge, skills, and abilities to be achieved).
-
Learnability and training level: Learnability (a person's ability to acquire new knowledge) and training level (the level of knowledge, skills, and abilities achieved as a result of training).
-
Factors: Academic performance (degree of achievement of learning goals), motivation (factors driving activity), level of preparation (possession of knowledge, skills, and abilities for learning), socio-economic factors (family living standards, parents' education, etc.), and USE specifications (determining the content, structure, and format of the exam).
USE results should reflect abilities, competencies, learnability, training level, and the influence of the motivational-volitional sphere, which affect students' subsequent academic performance.
Research methods:
- Correlation analysis: Relationship between two variables.
- Regression analysis: Predicting the value of one variable based on another.
- Experimental method: Cause-and-effect relationship between two variables.
Research limitations:
- Difficulty in establishing cause-and-effect relationships.
- Imperfection of research methods.
- Influence of other factors.
The analysis was based on a database containing information on student performance over 13 years [Rochev]. Only data from students with both USE results and diploma grades were considered. Student grades were squared to enhance deviations.
The average score (quadratic) was calculated as:
Where:
O – average score (quadratic),
OE – exam grade (excluding credits),
n – number of student grades.
Where:
USE – normalized USE score,
E – USE exam score,
n – number of USE exams.
Based on diploma grades and calculated average scores, their dependence on the USE score was analyzed using a linear regression model:
Where:
y – output parameters,
x – input parameters,
b – regression coefficients.
For a more detailed study, a cohort analysis was performed (4). For this purpose, the whole data set was divided into specialty groups (5).
Where: y - output parameters,
x - input parameters,
b - coefficients of the regression equation.
For a more detailed study, cohort analysis was conducted. The entire dataset was divided into groups of specialties.
The study examined data from 45,743 students, but the final analysis included 9,520 students with USE results, full-time education, and successful diploma defense. Among them, 3,733 were female and 5,785 were male. Additional information is provided in Table 1.
The research was conducted using several software tools: Microsoft Excel, Statistica, the university management system, and a custom data analysis program developed for student activity analytics.
Table 1. Descriptive statistics
|
Statistics |
USE |
Average score |
Age |
|
Mean |
53,4 |
15,6 |
20,8 |
|
Standard error |
0,2 |
0,0 |
0,05 |
|
Median |
53,0 |
15,0 |
19 |
|
Moda |
49,0 |
9,0 |
18 |
|
Standard deviation |
9,7 |
4,2 |
4,9 |
|
Sample variance |
93,3 |
18,0 |
24,3 |
|
Excess |
0,2 |
-0,7 |
101 |
|
Asymmetry |
0,2 |
0,4 |
1,88 |
|
interval |
66 |
16 |
157 |
Results
First, let us consider the general picture of the relationship between various factors and academic performance.
Table 2. Correlation of various factors affecting students' academic performance and grade point average
|
Parameter |
Part-time students |
Full-time students |
Dormitory |
Local |
FEMIT |
TF |
NGF |
|
Date of birth |
0,002 |
0,087 |
0,103 |
0,070 |
-0,027 |
0,097 |
0,109 |
|
Citizenship type |
-0,007 |
-0,044 |
-0,103 |
0,011 |
-0,075 |
-0,003 |
-0,065 |
|
Dormitory (0-no, 1-yes) |
-0,029 |
0,037 |
|
|
-0,035 |
0,030 |
0,070 |
|
Gender (0-f, 1-m) |
-0,281 |
-0,251 |
-0,259 |
-0,254 |
-0,311 |
-0,259 |
-0,236 |
|
Job (0-no, 1-yes) |
-0,055 |
0,018 |
0,008 |
0,024 |
0,011 |
0,038 |
0,006 |
|
Children (0-no, 1-yes) |
0,012 |
0,022 |
0,027 |
0,021 |
0,033 |
0,043 |
0,001 |
|
Disability (0-no, 1-yes) |
0,008 |
-0,013 |
-0,004 |
-0,016 |
-0,026 |
-0,002 |
-0,012 |
|
Age |
-0,140 |
-0,039 |
-0,091 |
-0,035 |
-0,074 |
-0,087 |
0,000 |
|
USE score |
0,368 |
0,481 |
0,482 |
0,479 |
0,525 |
0,451 |
0,466 |
|
Diploma grade |
0,376 |
0,551 |
0,584 |
0,528 |
0,585 |
0,540 |
0,531 |
Note: FEMIT - Faculty of Economics, Management and IT; TF - Faculty of Technology; NGF - Faculty of Oil and Gas.
Table 2 presents the results of correlation analysis between various factors and students' GPA. For all cases except the "Correspondence students" column, data from full-time students were considered. Results for students from specific faculties are also shown: Faculty of Economics, Management, and IT (FEMIT), Technological Faculty (TF), and Oil and Gas Faculty (NGF), as they differ significantly in their specifics. As can be seen from the table, the strongest correlation with GPA among the considered factors is shown by the USE score.
Table 3 presents similar data on the correlation between USE scores and various factors.
Table 3. Correlation of USE score and various factors affecting students' academic performance
|
Architecture |
Part-time students |
Full-time students |
Dormitory |
Local |
FEMIT |
TF |
NGF |
|
Safety of Technological Processes |
0,276 |
0,236 |
0,249 |
0,221 |
0,131 |
0,226 |
0,272 |
|
Drilling of Oil and Gas Wells |
0,011 |
-0,012 |
-0,056 |
0,015 |
0,012 |
-0,022 |
-0,044 |
|
Oil and Gas Geology |
-0,070 |
-0,103 |
-0,109 |
-0,107 |
-0,108 |
-0,217 |
-0,026 |
|
Geophysical Methods of Prospecting and Exploration |
-0,025 |
-0,031 |
-0,014 |
-0,042 |
-0,013 |
-0,043 |
-0,036 |
|
Documentation and Archival Studies |
-0,015 |
-0,006 |
0,041 |
-0,016 |
-0,010 |
-0,046 |
0,010 |
|
Computer Science and Engineering |
0,139 |
0,045 |
0,013 |
0,063 |
0,044 |
0,039 |
0,030 |
|
Information Systems and Technologies |
0,368 |
0,481 |
0,482 |
0,479 |
0,525 |
0,451 |
0,466 |
|
Forest Engineering |
0,184 |
0,254 |
0,233 |
0,273 |
0,355 |
0,199 |
0,201 |
|
Machinery and Equipment for Oil and Gas Complexes |
0,328 |
0,433 |
0,453 |
0,421 |
0,492 |
0,418 |
0,408 |
|
Management |
0,306 |
0,363 |
0,361 |
0,362 |
0,427 |
0,272 |
0,387 |
|
Oil and Gas Engineering |
0,281 |
0,489 |
0,491 |
0,486 |
0,531 |
0,452 |
0,503 |
|
Applied Geology |
0,096 |
0,269 |
0,262 |
0,274 |
0,345 |
0,227 |
0,250 |
|
Design, Construction, and Operation of Oil Pipelines |
0,274 |
0,364 |
0,392 |
0,336 |
0,452 |
0,389 |
0,292 |
|
Development and Operation of Wells |
0,149 |
0,362 |
0,390 |
0,339 |
0,447 |
0,361 |
0,361 |
|
Advertising and Public Relations |
0,142 |
0,616 |
0,504 |
0,773 |
0,604 |
-0,213 |
0,801 |
|
Standardization and Metrology |
0,282 |
0,333 |
0,341 |
0,327 |
0,368 |
0,289 |
0,325 |
|
Construction |
0,228 |
0,361 |
0,330 |
0,386 |
0,458 |
0,331 |
0,324 |
|
Technological Machines and Equipment |
0,305 |
0,455 |
0,461 |
0,449 |
0,503 |
0,415 |
0,437 |
Note: FEMIT - Faculty of Economics, Management and IT; TF - Faculty of Technology; NGF - Faculty of Oil and Gas.
As shown in Figures 1-3, there is a significant correlation between students' GPA and their USE scores upon admission. The correlation is 0.48, with 0.24 of the GPA explained by the USE score (significance above 0.001). Diploma grades also correlate with USE results, but to a lesser extent – 0.25, with only 0.07 of the variation in diploma grades explained by the USE score (significance above 0.001).
Normalized total USE score Average score squared

Fig. 1. Dependence of GPA on USE scores for all groups
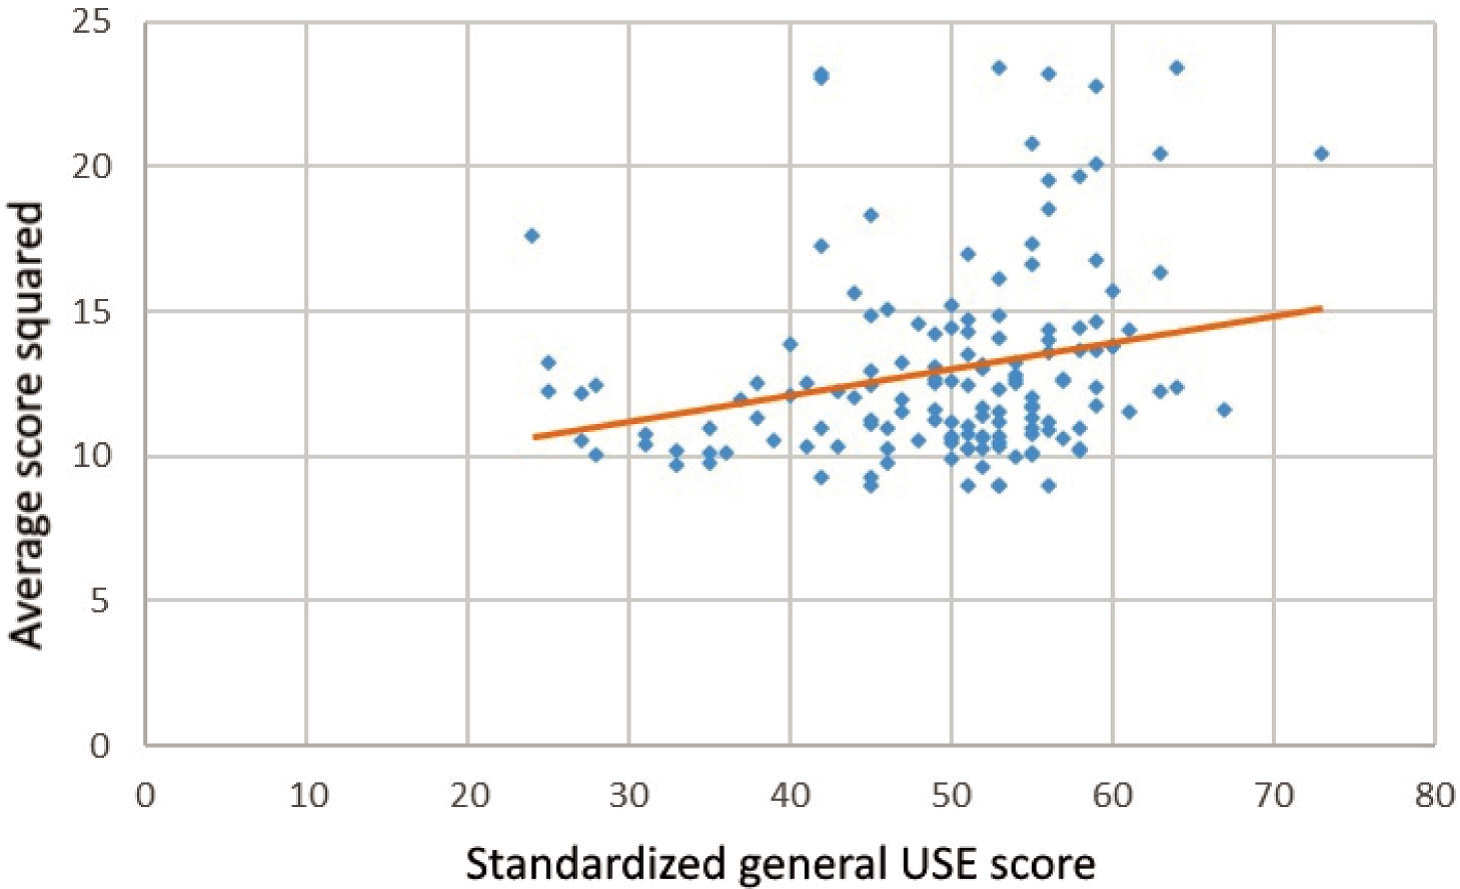
Fig. 2. Dependence of GPA on USE scores for MON (Machinery and Equipment for Oil and Gas Complex – minimum significance of explained variation)

Fig. 3. Dependence of GPA on USE scores for FC (Finance and Credit – maximum significance of explained variation)
Table 4. Summary statistics on USE results by specialty groups, percentage of GPA and diploma grade variation explained by the regression equation from USE scores
|
Specialty Group |
Observations |
Average USE Score |
Std. Dev. of USE Score |
Min. USE Score |
Max. USE Score |
% of GPA Variation Explained by USE |
% of Diploma Grade Variation Explained by USE |
|
Architecture |
154 |
56,75 |
10,27 |
30 |
85 |
0,263*** |
0,010 |
|
Safety of Technological Processes |
104 |
51,85 |
9,32 |
26 |
82 |
0,239*** |
0,142* |
|
Drilling of Oil and Gas Wells |
114 |
50,38 |
9,00 |
19 |
69 |
0,184*** |
0,007 |
|
Oil and Gas Geology |
171 |
48,99 |
7,43 |
24 |
70 |
0,165*** |
0,089* |
|
Geophysical Methods of Prospecting and Exploration |
106 |
48,55 |
8,07 |
31 |
74 |
0,277*** |
0,123* |
|
Documentation and Archival Studies |
78 |
55,86 |
7,12 |
41 |
72 |
0,120*** |
0,000 |
|
Computer Science and Engineering |
190 |
55,14 |
8,69 |
39 |
83 |
0,139*** |
0,236*** |
|
Information Systems and Technologies |
336 |
58,24 |
9,20 |
35 |
87 |
0,268*** |
0,033* |
|
Forest Engineering |
194 |
45,15 |
7,66 |
23 |
73 |
0,119** |
0,000 |
|
Machinery and Equipment for Oil and Gas Complexes |
146 |
49,71 |
9,11 |
24 |
73 |
0,062* |
0,126** |
|
Management |
202 |
55,02 |
9,51 |
37 |
84 |
0,397*** |
0,330*** |
|
Oil and Gas Engineering |
1 423 |
57,89 |
9,02 |
32 |
85 |
0,272*** |
0,094*** |
|
Applied Geology |
217 |
48,10 |
6,82 |
36 |
72 |
0,196*** |
0,096*** |
|
Design, Construction, and Operation of Oil Pipelines |
136 |
53,82 |
11,18 |
23 |
83 |
0,455*** |
0,446*** |
|
Development and Operation of Wells |
130 |
54,88 |
9,98 |
18 |
80 |
0,269*** |
0,019 |
|
Advertising and Public Relations |
187 |
56,46 |
9,16 |
39 |
82 |
0,197*** |
0,039 |
|
Standardization and Metrology |
118 |
53,65 |
7,86 |
36 |
79 |
0,139*** |
0,121** |
|
Construction |
98 |
47,77 |
6,52 |
33 |
69 |
0,219*** |
0,000 |
|
Technological Machines and Equipment |
436 |
49,46 |
6,50 |
32 |
79 |
0,077** |
0,000 |
|
Technology of Geological Exploration |
117 |
51,02 |
6,50 |
40 |
75 |
0,074** |
0,022 |
|
Technology of Logging Operations |
109 |
43,70 |
4,50 |
32 |
62 |
0,078** |
0,004 |
|
Technosphere Safety |
188 |
54,80 |
8,14 |
33 |
85 |
0,314*** |
0,109*** |
|
Physical Education |
98 |
47,71 |
9,78 |
21 |
72 |
0,163*** |
0,056 |
|
Finance and Credit |
203 |
53,31 |
9,13 |
29 |
76 |
0,509*** |
0,279*** |
|
Ecology and Environmental Management |
205 |
53,95 |
8,19 |
36 |
81 |
0,266*** |
0,045* |
|
Economics |
93 |
56,53 |
8,97 |
36 |
72 |
0,220*** |
0,151 |
|
Electrical Power Engineering and Electrical Engineering |
357 |
54,47 |
9,00 |
32 |
82 |
0,233*** |
0,022* |
Note: * – significance at 95%, ** – significance at 99%, *** – significance at 99.9%.
As is known, different specialties have different levels of competition and ranges of admission scores. It is logical to hypothesize that the greater the variation in USE scores among applicants, the greater the influence of this difference on subsequent academic performance. Since with a small variation in USE scores, the difference in academic performance among former schoolchildren is also small, they differ less at the start of their studies, and this difference is determined by further university education and other factors. To test this hypothesis, let us examine the obtained data in more detail – we will evaluate the regression of the difference between the minimum and maximum USE scores of students admitted to different specialties on the R-squared correlation between USE scores and their GPA (see Table 4) (5). As can be seen in Fig. 4, this regression is quite noticeable and amounts to 0.34 for GPA and 0.23 for diploma grades.
Where:
R – average score (quadratic),
r – R-squared correlation between USE scores and GPA or diploma grades,
n – number of students in the specialty,
m – number of specialties in the specialty group.
Thus, it can be concluded that the range of USE scores upon admission affects average academic performance at a significance level of 0.001 and diploma defense results at a significance level of 0.011.
Average standard deviation by USE
Percentage of variation in mean score explained by variation in USE
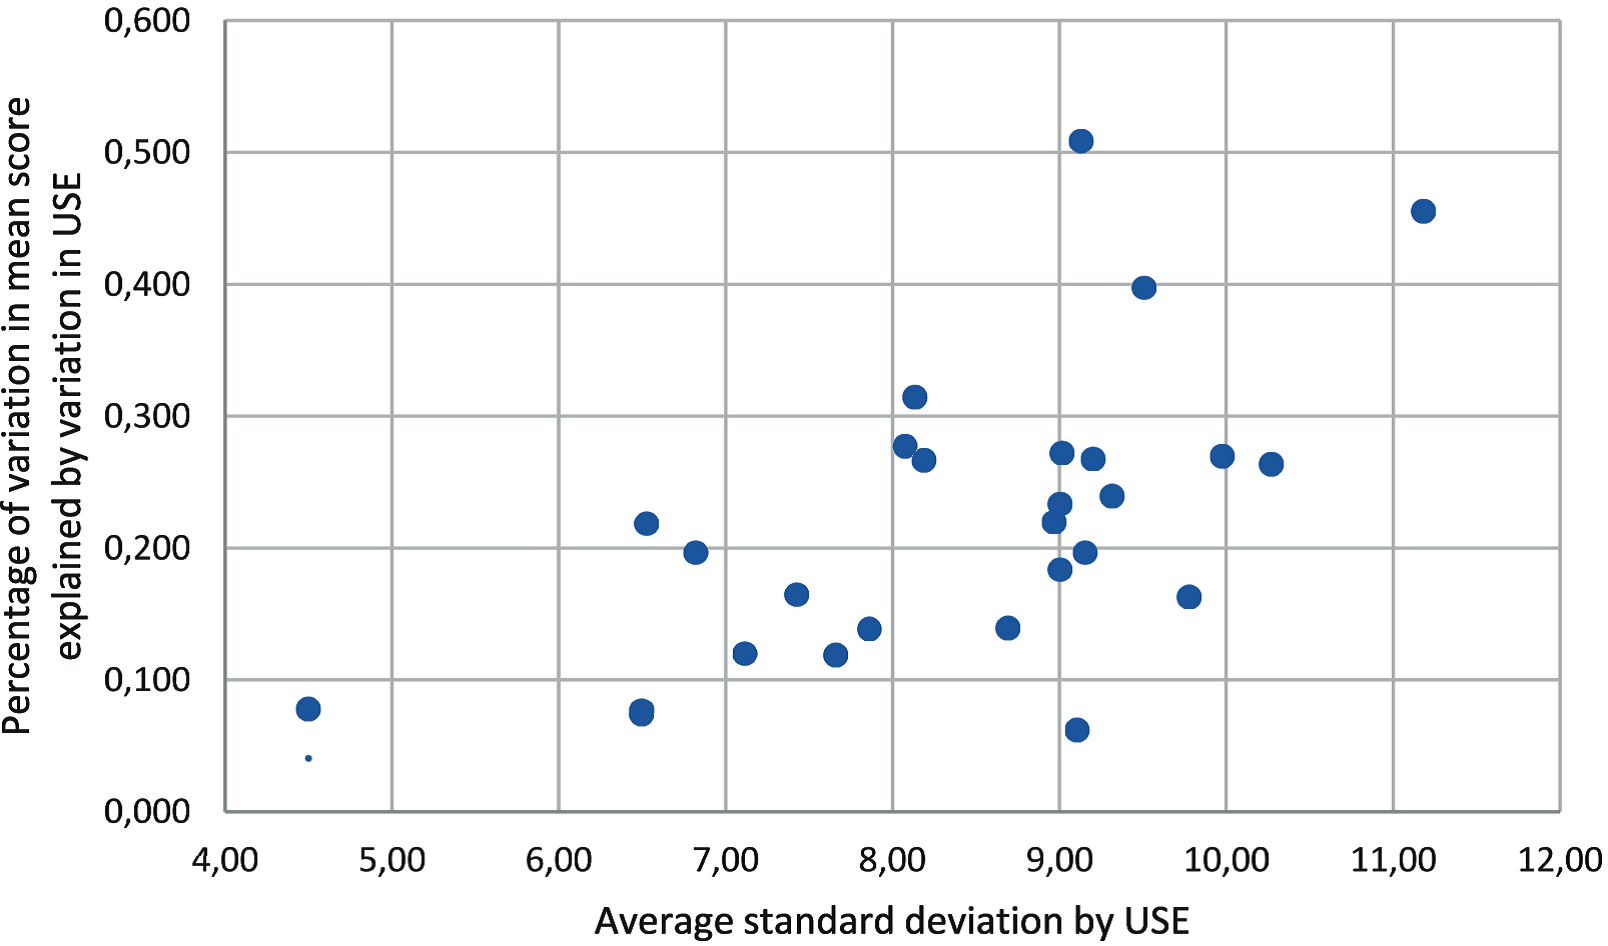
Fig. 4. Influence of the standard deviation of USE scores on the degree of correlation between USE scores and students' GPA
Conclusion
Based on the analysis of the presented data, we obtained significant dependencies of both GPA and diploma grades on USE results. Moreover, the greater the variation in USE scores among admitted students, the more accurately they determine subsequent academic performance. Undoubtedly, besides USE scores, there are many other factors that can significantly influence the quality of education. However, on average, most of the considered factors correlate with academic performance (as one of the main measurable parameters of education quality) significantly less than the abilities and motivational-volitional characteristics of students reflected in USE scores. Therefore, when building models for assessing education quality, it is advisable to include USE results as additional explanatory variables.