Introduction
The Federal State Educational Standards define the development of meta-subject skills as one of the learning outcomes. Meta-subject skills include the ability to set goals, select and use strategies to achieve goals, and the capacity to analyse academic successes and difficulties. These skills reflect the concept of self-regulated learning (Akhmedjanova, 2024), and the skills of goal setting, monitoring, and reflection correspond to the scientific understanding of metacognition (Winne, Azevedo, 2014).
Metacognition is the understanding and control of one's own thoughts (McCormick, 2003). Metacognition may be considered in the context of declarative, procedural, and conditional knowledge (McCormick, 2003; Schraw, Dennison, 1994; Winne, Azevedo, 2014). Declarative knowledge implies that a person knows facts. Procedural knowledge means that students know how to perform a task, i.e., how to apply declarative knowledge. Conditional knowledge assumes that students understand when and where to apply declarative and procedural knowledge to complete tasks (Winne, Azevedo, 2014).
Another perspective on metacognition characterizes it as a form of thinking within the framework of self-regulated learning (Akhmedjanova, 2024; Winne, Azevedo, 2014). Ph. Winne and R. Azevedo (2014) note that for successful learning, it is not enough to possess only declarative, procedural, and conditional knowledge. It is also necessary to analyze one's knowledge and compare it with task performance results, monitor one's understanding, and the ability to overcome difficulties to achieve learning goals.
In this study, we examine metacognition through the lens of the theoretical framework of self- and social regulation of learning (Akhmedjanova, 2024). The theoretical framework (Figure) integrates three domains: self-regulated learning (C-I, L-N), socially regulated learning (A-B, J-L), and culture (O) (Akhmedjanova, 2024). Social regulation of learning includes learning methods (A-B) and formative assessment practices (J-K).
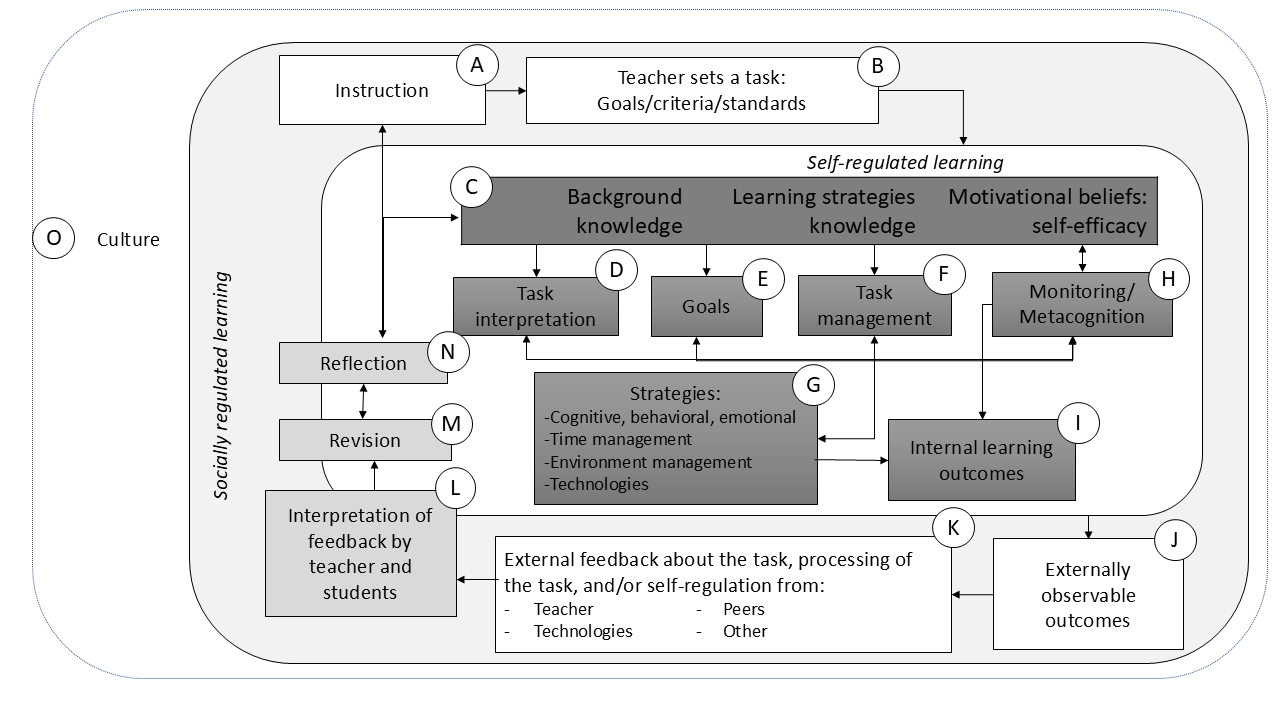
In this study, we focus on metacognition, specifically on the processes of goal setting (E), task management (F) through the selection of various learning strategies, metacognitive monitoring (H), and reflection (N) of self-regulated learning.
Research on metacognition
Research on metacognition shows positive effects of teaching metacognitive strategies to students. There is evidence of positive links between teaching metacognitive strategies and academic achievement in mathematics (Muncer et al., 2022) and general academic performance (De Boer et al., 2018; Ohtani, Hesasaka, 2018; Perry, Lundie, Golder, 2019), including findings from longitudinal studies (He et al., 2024). Students with more developed metacognitive skills typically learn more effectively, demonstrate higher motivation, and utilize a broader range of strategies to achieve their learning goals (Winne, Azevedo, 2014). Metacognition also receives significant attention in Russian literature (Byzova, Perikova, 2022; Karpov, Skityaeva, 2005; Perikova, Byzova, 2022; 2020).
Various methods exist for measuring metacognition, but questionnaires remain the most common approach (Perikova, Byzova, 2022; Schraw, Dennison, 1994; Winne, Azevedo, 2014). The most well-known among these is the Metacognitive Awareness Inventory (MAI) (Schraw, Dennison, 1994), developed by G. Schraw and R. Dennison. It measures metacognitive knowledge and metacognitive regulation using 52 items.
The first adaptation of this inventory on a Russian sample was conducted by A.V. Karpov and I. M. Skityaeva (2005), followed by E. I. Perikova and V. M. Byzova (2022), who refined the factor structure and proposed a shortened version (32 items) of the "Metacognitive Involvement in Activity" inventory. The shortened version of the inventory demonstrates acceptable internal consistency values (α = 0,42 to 0,83).
Another self-regulation survey that includes a metacognition scale is the questionnaire developed for the Diagnostic Assessment and Achievement of College Skills (DAACS) project (Lui et al., 2018). The DAACS self-regulation survey includes 47 items on a Likert scale from 1 (strongly disagree) to 5 (strongly agree). The survey demonstrates good psychometric properties (α = 0,79 to 0,91).
As evident from the description above, numerous instruments exist for measuring metacognition, but most were developed and adapted using samples of adults or university students (Perikova, Byzova, 2022; Schraw, Dennison, 1994).
The research gap of this study is the lack of a reliable and validated instrument measuring metacognitive skills in Russian adolescents. Consequently, the goal of this study is to adapt and validate the metacognition scale from the DAACS self-regulation survey on a sample of Russian school students.
Validity and reliability
In this study, the psychometric properties of the metacognition scale were established based on the theoretical framework of construct validity (Kane, 2006), which includes validity based on the instrument's content, response processes, internal structure, correlations with other constructs, consequences of test results, and reliability (AERA, APA, NCME, 2014; Kane, 2006).
To assess the validity and reliability of the metacognition scale, we address the following research questions:
- What is the validity of the metacognition scale based on:
- the internal structure?
- the reliability?
- correlations with other constructs?
- response processes?
We present the validity of the metacognition questionnaire based on: 1) the internal structure of the scale using confirmatory factor analysis (CFA); 2) reliability through testing the internal consistency; 3) correlations with other constructs by presenting discriminant relationships; 4) response processes using Rasch modelling.
Materials and methods
Design: The study was conducted as a cross-sectional survey in the spring of 2023 in the Yaroslavl region.
Sample: The study involved 1167 middle school students (55,27% girls), from the seventh (n = 345; 55,07% girls), eighth (n = 514; 55,44% girls), and ninth (n = 308; 55,19% girls) grades. The average age of the students was 14,4 years (SD = 0,91). The recommended sample size should have a minimum of 407 participants to achieve 80% statistical power at p = 0,05. The sample in this study exceeds the recommended size twofold and has sufficient power for statistical analysis.
Instruments: The metacognition survey is an adaptation of the metacognition scale from the DAACS self-regulation survey (Lui et al., 2018). The original instrument includes three scales: planning (5 items; α = 0,71), monitoring (6 items; α = 0,79), and reflection (3 items; α = 0,73). It uses a Likert response scale ranging from 1 – strongly disagree to 5 – strongly agree. The DAACS self-regulation survey has good psychometric characteristics and internal consistency (α = 0,89), as well as acceptable model fit indices: χ²(1020) = 19988,706, p < 0,001, CFI = 0,868, RMSEA = 0,053, SRMR = 0,051, χ²/df = 19,597 for a sample of higher education students (n = 6644) (Lui et al., 2018).
To examine relationships with other constructs, the School Burnout Inventory (Bochaver, Mikhailova, 2023) and domain-specific self-efficacy scales (Akhmedjanova, 2024) were used.
The School Burnout Inventory (Bochaver, Mikhailova, 2023) includes nine items across three subscales: exhaustion, cynicism, and sense of inadequacy. The response scale ranges from 1 – strongly disagree to 6 – strongly agree. Results from a study on a sample of students aged from 10 to 18 (n = 3197) showed high model quality indices: χ²(24) = 244,648, p < 0,001, CFI = 0,981, TLI = 0,971, RMSEA = 0,055 [0,049; 0,061], SRMR = 0,026, and internal consistency, α = 0,67, 0,76, 0,85 (Bochaver, Mikhailova, 2023).
The Self-Efficacy Scales (Akhmedjanova, 2024) comprise five separate surveys for all key school subjects: mathematics (4 items; α = 0,8; ω = 0,83), reading (4 items; α = 0,79; ω = 0,81), foreign language (5 items; α = 0,93; ω = 0,94), physics (5 items; α = 0,93; ω = 0,95), and biology (4 items; α = 0,88; ω = 0,9). They use a Likert response scale ranging from 1 – cannot do at all to 4 – can do very well. Results from a study on a sample of students from primary (n = 972) and secondary (n = 584) schools indicated that the questionnaire has good psychometric characteristics: α = 0,79 – 0,93; χ² (98) = 292,02, p < ,000, CFI = 0,99, TLI = 0,99, RMSEA = 0,04, SRMR = 0,04 (Akhmedjanova, 2024).
Data collection: The metacognition scale was translated from English into Russian by an expert in educational psychology. Two experts in psychology and pedagogy then independently evaluated the translation. Additionally, we presented the translated items to five 10th-grade students from a Moscow school. Discrepancies in the translation, based on recommendations from the experts and the students, were resolved through discussions among the experts. After discussing the response scale with the students, we decided to use a shortened response scale from 1 (almost never) to 4 (almost always) to simplify comprehension for the students. Some researchers recommend against using long response scales, as data analysis often requires merging similar response categories (Colvin, Gorgun, 2020).
Parents of the students provided a signed informed consent, and the children gave their assent to participate in the study. We did not collect any personal data from the students to ensure the confidentiality of their responses.
Data analysis: Data analysis was conducted in the R program using the `lavaan` (Rosseel et al., 2024) and `psych` (Revelle et al., 2024) packages for CFA, Spearman's correlation coefficient, and the non-parametric Mann-Whitney and Kruskal-Wallis tests. These tests allowed us to identify differences in metacognition scores based on student gender and grade level. CFA was used to test the factor structure, while the calculation of Cronbach's alpha and Guttman's beta was used to determine the reliability of the scale. Rasch modelling was performed using the Winsteps software (version 5.2.3.0) (Linacre, 2012) and allowed for checking the quality of each item. Missing data analysis was conducted using the `VIM` package (Templ et al., 2023).
The missing data analysis was performed on the sample of students from grades 7 to 11 (n = 1469) and revealed varying degrees of missing data depending on the variable (gender, grade = 0%; self-efficacy for foreign languages = 20% in grades 10 and 11). Pearson's chi-square test was statistically significant, indicating no association between missingness and student gender or grade. The results showed that the data were missing completely at random (MCAR). Therefore, after removing 302 observations with missing data, the sample size was reduced to 1167 observations from students in grades 7–9, which were used for all subsequent analyses.
Results
Descriptive statistics was used to check the data for normality and to determine the average level of metacognition and differences in metacognition among students based on gender and grade.
The results of the Shapiro-Wilk test indicate a deviation from normal distribution for all variables of interest. Subsequent results are based on non-parametric analysis (see Tables 1-3 in the Appendix).
Results from the Mann-Whitney test showed no statistically significant differences in the overall level of metacognition, or its subscales, between boys and girls (Table 1 in the Appendix). Results from the Kruskal-Wallis test revealed significant differences in overall metacognition depending on grade: χ²(2) = 9,83, p < 0,001. Ninth-graders showed higher metacognition results than students in seventh and eighth grades (Table 2 in the Appendix). Based on these results, it can be concluded that the majority of students in this sample demonstrate a basic level of metacognition (Table 3 in the Appendix).
Validity of the metacognition scale based on internal structure
To determine validity based on the internal structure of the metacognition scale (14 items), CFA was conducted. The results revealed excellent fit indices for the three-factor structure: χ2(74) = 550,15, p < 0,001, CFI = 0,94, TLI = 0,93, RMSEA = 0,07, SRMR = 0,04, χ2/df = 7,43. These indicators correspond to the recommended thresholds for such indices (Hu, Bentler, 1999). In Table 1, standardized factor loadings indicate that all items are moderately or strongly correlated with latent factors of planning, monitoring, and reflection (0,55–0,82).
Table 1.
Results of confirmatory factor analysis (standardized factor loadings) and reliability estimates
|
Sub-scale |
Items |
Standardised factor loadings |
Cronbach’s Alpha |
Guttman’s Beta |
Percentage of variance |
|
Planning |
1 |
0,65 |
0,79 |
0,71 |
0,43 |
|
2 |
0,72 |
||||
|
3 |
0,55 |
||||
|
4 |
0,75 |
||||
|
5 |
0,61 |
||||
|
Monitoring |
6 |
0,75 |
0,88 |
0,83 |
0,54 |
|
7 |
0,78 |
||||
|
8 |
0,75 |
||||
|
9 |
0,74 |
||||
|
10 |
0,71 |
||||
|
11 |
0,73 |
||||
|
Reflection |
12 |
0,81 |
0,81 |
0,71 |
0,59 |
|
13 |
0,79 |
||||
|
14 |
0,72 |
The metacognition survey demonstrates the internal consistency and reliability of each of the scales (Table 1) based on the Cronbach alpha (0,79–0,88) and Gutmann beta (0,71–0,83) indices, and the overall reliability of the entire scale: α = 0,92; β = 0,86.
To examine relationships with other constructs, Spearman's correlation coefficient was used to assess the correlations between metacognition, burnout, and domain-specific self-efficacy.
The metacognition scales showed positive and statistically significant correlations with student self-efficacy across all subjects (Table 2). However, all correlations were relatively weak, indicating that the metacognition and self-efficacy surveys measure distinct constructs. The correlation between the metacognition scales and burnout was negative and weak – the higher the metacognition, the lower the burnout among students. The results of the correlation analysis indicate divergent relationships between the constructs of metacognition and self-efficacy, as well as between metacognition and student burnout.
Table 2.
Spearman correlation coefficients of metacognition, self-efficacy, and burnout scales (n = 1,167)
|
|
1 |
2 |
3 |
|
1 Planning |
- |
|
|
|
2 Monitoring |
0,66 |
- |
|
|
3 Reflection |
0,61 |
0,71 |
- |
|
4 SE Mathematics |
0,19 |
0,19 |
0,17 |
|
5 SE Russian language |
0,24 |
0,27 |
0,22 |
|
6 SE Literature |
0,24 |
0,24 |
0,22 |
|
7 SE Foreign language |
0,21 |
0,21 |
0,22 |
|
8 SE Biology |
0,23 |
0,19 |
0,24 |
|
9 SE Physics |
0,22 |
0,22 |
0,21 |
|
10 Exhaustion |
|
|
|
|
11 Cynicism |
-0,17 |
-0,13 |
-0,16 |
|
12 Sense of inadequacy |
-0,14 |
|
-0,11 |
|
Mean (SD) |
2,75 (0,63) |
2,79 (0,66) |
2,68 (0,74) |
Note: All correlations are significant at p < ,001
Validity of the metacognition questionnaire based on response processes
Rasch modelling allowed for determining the quality of each item and the response scale.
The mean-square (MNSQ) statistic for all 14 items identified participants’ response patterns (Linacre, 2012). Based on Bond and Fox’s (2013) recommendations, MNSQ values between 0,6 and 1,4 are considered acceptable, while values below 0,6 and above 1,4 indicate misfit. The values in Table 3 demonstrate that the infit statistics range from 0,75 to 1,52, which falls within the acceptable range for the majority of items. Items 3 (Infit MNSQ = 1,52, ZSTD = 9,90) and 5 (Infit MNSQ = 1,40, ZSTD = 8,81) show misfit, meaning respondents answered these items inconsistently. The same pattern is observed for these two items in the outfit statistics (Table 3), confirming greater variation in participants responses.
Table. 3.
Infit (weighted mean-square fit statistic) and outfit (unweighted mean-square fit statistic) values of respondent answers for each questionnaire item.
|
Items |
JMLE1 measure |
Infit MNSQ2 |
Infit ZSTD3 |
Outfit MNSQ |
Outfit ZSTD |
Exact match Obs% 4 |
Exact match Exp% |
|
3 |
1,49 |
1,52 |
9,90 |
1,56 |
9,90 |
44,5 |
55,1 |
|
5 |
-0,38 |
1,40 |
8,81 |
1,38 |
8,09 |
53,2 |
59,3 |
|
1 |
-0,60 |
1,05 |
1,26 |
1,12 |
2,67 |
62,6 |
59,7 |
|
14 |
0,48 |
1,07 |
1,63 |
1,08 |
1,91 |
61,6 |
59,7 |
|
4 |
-0,09 |
1,07 |
1,75 |
1,07 |
1,66 |
60,8 |
58,6 |
|
2 |
-0,51 |
1,04 |
0,90 |
1,04 |
1,05 |
58,9 |
55,8 |
|
10 |
0,12 |
0,90 |
-2,45 |
0,95 |
-1,19 |
64,5 |
57,8 |
|
6 |
-0,33 |
0,92 |
-2,12 |
0,91 |
-2,32 |
67,3 |
59,3 |
|
8 |
-0,33 |
0,90 |
-2,57 |
0,90 |
-2,40 |
65,6 |
59,3 |
|
13 |
-0,08 |
0,87 |
-3,44 |
0,86 |
-3,46 |
65,9 |
58,5 |
|
11 |
0,08 |
0,86 |
-3,73 |
0,86 |
-3,46 |
66,7 |
57,9 |
|
12 |
0,13 |
0,83 |
-4,49 |
0,82 |
-4,60 |
65,8 |
57,8 |
|
9 |
-0,01 |
0,79 |
-5,56 |
0,80 |
-5,28 |
68,1 |
58,4 |
|
7 |
-0,05 |
0,75 |
-6,67 |
0,75 |
-6,50 |
68,2 |
58,5 |
|
Mean |
0,00 |
1,00 |
-0,48 |
1,01 |
-0,28 |
62,4 |
58,3 |
|
SD |
0,50 |
0,21 |
4,77 |
0,22 |
4,67 |
6,4 |
1,3 |
The item difficulty measures range from -0,60 (Item 1) to 1,49 (Item 3) logits. According to Rasch measurement guide (Linacre, 2012), items with measures greater than 2,0 logits are considered difficult, while those below -2,0 logits are considered easy (Linacre, 2012). Most respondents are expected to fall between 0 (the mean value) and +2 logits. The items from the metacognition scale do not exceed these boundaries; rather, they are clustered around the average metacognition level of the respondents (between 0 and 2 logits) and are well-suited for measuring the metacognitive skill of the respondents in this sample.
Item 3 is somewhat more difficult for respondents than the other items, which is associated with its demand for a more complex skill of reflection and awareness before starting to read texts. Items 2 and 4 may be easier, as they indicate basic metacognitive skills – thinking about how to approach learning tasks.
Analysis of the response scale showed that its categories increase monotonically, meaning respondents utilized the entire range of the answer scale. Specifically, 9% of respondents chose answer 1 (almost never), 27% chose answer 2 (rarely), 44% preferred option 3 (often), and 20% chose answer 4 (almost always). The response scale is considered balanced, as 71% of respondents selected options 2 (rarely) and 3 (often).
Discussion
The goal of this study was to adapt the metacognition scale from the DAACS self-regulation survey for a sample of Russian school students.
Finding 1: CFA confirmed the three-factor structure of the metacognition scale, including planning, monitoring, and reflection subscales, consistent with the original instrument (Lui et al., 2018). This confirms the internal structure of the metacognition scale (RQ1.a).
Finding 2: Internal consistency indices based on Cronbach's alpha and Guttman's beta coefficients indicate high reliability for the three individual sub-scales and overall metacognition scale. This result is consistent with the estimates of the original questionnaire (Lui et al., 2018) and addresses RQ1.b.
Finding 3: The correlation coefficients of metacognition with the constructs of self-efficacy and burnout confirm validity based on divergent relationships and indicate that all three instruments measure distinct constructs (RQ1.c). Thus, metacognition is positively related to self-efficacy: the higher the metacognition, the higher the self-efficacy for school subjects. Similar relationships between metacognition and self-efficacy (Ohtani, Hisasaka, 2018; Winne, Azevedo, 2015) and burnout (Maricutoiu, Silea, 2019; Rahmati, 2015) have been identified in numerous studies.
Finding 4: Participant responses demonstrate that the items of the metacognition scale are comprehensible to students with an average level of metacognition (RQ1.d). Furthermore, the majority of respondents (71%) selected mid-range answers on the Likert scale. Items describing strategies such as asking questions before reading texts or predicting potential questions on future tests appeared slightly more challenging for the students in this sample. Respondents from this sample may either not use these strategies or use them ineffectively.
Based on the results, the main conclusion is that the adapted metacognition scale has good psychometric characteristics and is recommended for use with school students in the context of Russian general education.
Conclusion
Metacognition is one of the skills recommended for development in the general education curriculum at the federal level. However, there is a shortage of valid and reliable tools for measuring such skills.
The study presented here successfully confirmed the three-factor structure of the metacognition scale from the DAACS self-regulation survey on a sample of Russian school students. The results of this study demonstrate the high internal consistency of the scale, indicate divergent relationships of metacognition with student self-efficacy and burnout, and show that the questionnaire items are comprehensible to students. Accordingly, the metacognition scale is recommended for use with middle and high school students. It can become one of the tools for determining metacognition levels in different groups of students and, in the future, for developing educational programs to support and foster metacognition in school contexts.
Limitations. Despite the high psychometric properties of the adapted metacognition questionnaire, this study has some limitations. Within the unified validity theory framework, it is necessary to establish not only divergent but also convergent relationships with other constructs (for instance, by using another metacognition questionnaire, such as the "Metacognitive Involvement in Activity" inventory (Perikova, Byzova, 2022). It is also recommended to establish the consequential validity of the metacognition scale results and to verify longitudinal and test-retest validity to determine the reliability of the questionnaire in the Russian context.
1 Joint Maximum Likelihood Estimation (JMLE)
2 Mean Square Statistics (MNSQ)
3 Standardised Z Score (ZSTD)
4 The Exact Observation Match Percentage (OBS%) shows the proportion of data points that match the expected values within a 0,5-point range. The Expected Percentages (EXP%) reflect the theoretical proportion of responses predicted by the Rasch model. On average, the OBS% exact match across all items was 62,4% (SD = 6,4), while the average EXP% was 58,3% (SD = 1,3). This indicates that the observed match generally aligned with expectations. However, the spread of OBS% values was higher than that of EXP%, suggesting variations in fit at the individual item level. The consistency of the EXP% values indicate good calibration of the Rasch model for the metacognition items. Nevertheless, some items (for example, Items 3 and 5) may require refinement.