Introduction
Presently, educators and academics are placing a greater emphasis on creativity. Due to the sophisticated technology of the 21st century, there are various fundamental distinctions in how people live and this is particularly evident in the realm of creativity (OECD, 2018). Consequently, creative individuals must respond to these unpredictable characteristics to adapt and respond to these ever-evolving and often unpredictable characteristics of modern life (Borodina et al., 2019). In every aspect of life, creative ideas are supposed to provide solutions to real problems stemming from these differences between real creativity problem and perspectives theories. Accordingly, creativity has become one of the essential skills for the 21st century in many countries around the world in order to keep up with the rapid pace of global creativity growth (Nakano, Wechsler, 2018).
In response to the insight, Treffinger & Houtz (2003) emphasizes the significance of quantifying CT: it gives a case for recognizing individual abilities and strengths so that others can be aware of them and makes it simpler for policymakers or individuals to find their unknown or unexplored capabilities. The Indonesian 2013-curriculum (K–13) emphasizes that creativity should be learnt and implemented anywhere (classroom and real live); therefore, education should focus on developing creative skills (Ministry of Education and Culture, 2014), including MCT assessment and exploring the students’ an idea during in the classroom. However, the instructional strategy between the educational and teaching levels does not establish the required concept that mathematics should be taught in real-world contexts (Ogunkunle et al., 2015). Thus, pupils are not taught creative problem-solving strategies relevant to their cultural background. According to Xu et al. (2022) research, the majority of mathematics education in the world is totally based on structural models and algorithms in European content and have applied both realistic modelling and epistemological modelling perspectives. Descriptively, it is essential to teach mathematics in their various cultural settings, particularly in Indonesia. D’Ambrosio (2007) identifies ethnomathematics as a concept that should be incorporated into the curriculum in order to foster creativity and promote cultural respect in teaching and learning in difference demographic (i.e., gender). The gender differences in mathematical creativity are important. It is possible that gender differences may affect creative thinking. However, gender differences in learning opportunities is needed and have affected all achievement (Jungert et al., 2019). Assessing of MCT and gender can be facilitated by culture (ethnomathematics) as the transformational power should be facilitated rethink of mathematics. Additionally, in the realm of CT and ethnomathematics, understanding the role of gender is of paramount importance (Ramadhani et al., 2022). It goes beyond a mere acknowledgment of male and female participation. In essence, this highlights the complex interplay between mathematics and culture, emphasizing that mathematical concepts and practices are not solely universal but are also culturally influenced and expressed in a variety of ways.
In recent years, there has been a growing interest in combining ethnomathematics with mathematical creative thinking (Sukestiyarno et al., 2023), which involves using imagination and innovation to solve mathematical problems and explore mathematical concepts. The combination of these two fields offers a unique and powerful approach to mathematics education, one that promotes a deeper understanding of the cultural context of mathematics while also encouraging learners to develop their own creative and culturally relevant approaches to mathematical problem-solving.
Research on creativity in mathematics within cultural contexts has shown strong links between culture, mathematics, and creative thinking (Choeriyah et al., 2021; Nur et al., 2020). Tandiseru (2015) found that effective learning enhances culturally integrated CT skills, though it does not explain MCT development across grade levels. In Indonesia, Choeriyah et al. (2021) demonstrated that ethnomathematics-based discovery improves students' mathematical problem-solving using cultural patterns like Cilacap batik motifs. However, the study lacks details on the creativity assessment instrument, highlighting the need for structured evaluation. Developing reliable assessment tools is crucial for accurately measuring students' MCT abilities and understanding their cognitive processes. Rasch analysis offers a precise method for evaluating both student abilities and test items in MCT assessments.
For most of the existing literature, which is a systematic review (Pradana et al., 2022), we found that research on ethnomathematics especially in MCTBE has been limited. This research aims to fill that gap by developing an MCTBE test and exploring both the test items and student performance. The goal of this research is to address the limited exploration of MCTBE and to enhance our understanding of how both test items and students interact with the concept.
Literature review
MCTBE
Creativity, defined as the ability to generate new and original ideas (Suherman, Vidákovich, 2022b), is emphasized in education worldwide, including Singapore's focus on "intense thinking" (Hadar, Tirosh, 2019), Hong Kong's reforms for 21st-century challenges (Chan, 2007), the U.S. emphasis on innovation (Holt, 2018), Europe's recognition of creativity for lifelong learning (Ferrari et al., 2009), and Indonesia's integration of creativity into student learning (Ministry of Education and Culture, 2014). MCTBE is a mathematical approach that emphasizes creativity in problem-solving while incorporating cultural diversity (Anhalt et al., 2018). As part of the ethnomathematics framework, it explores how different cultures apply CT to solve mathematical problems and engage in mathematical exploration (Johnson et al., 2022). A practical example is the use of traditional geometric patterns in Tapis art, where mathematical principles are creatively applied to produce unique designs (Suherman, Vidakovich, 2022).
Research has linked mathematical CT to ethnomathematics. Shahbari & Daher (2020) found that an ethnomathematics-based approach improved students’ understanding of congruent triangles, particularly those with prior math difficulties. Supriadi (2022) showed similar benefits for integer and fraction operations, fostering positive attitudes toward math and culture. However, challenges in broader implementation remain unaddressed, and while some studies suggest gender differences in CT (Widada et al., 2019), others argue gender has little impact (Sabbagh, 2016). Additionally, creativity may reduce anxiety in cultures that emphasize it (Perach, Wisman, 2019). These findings highlight ethnomathematics as a tool to enhance CT through culturally relevant contexts.
Assessment of MCTBE in the educational context
The MCTBE assessment tool is designed to measure students' MCT skills within the context of ethnomathematics, addressing the need for an evaluation method that reflects culturally diverse mathematics education (Suherman, Vidákovich, 2021). A systematic review by Suherman & Vidákovich (2022) analyzed 70 studies that assessed MCT in various contexts, noting a wide range of assessment components and tasks, but identifying common elements such as fluency, flexibility, originality, and elaboration. Studies such as Zaenuri et al. (2019) and Kuswanto (2018) demonstrated how local culture, such as the Tomb of Kyai Semar and Indonesian batik, can be used to enhance students' CT and problem-solving skills, suggesting the value of incorporating cultural diversity into educational materials. MCTBE offers several benefits in the educational context. It can identify students' strengths and weaknesses in MCT, providing valuable feedback to teachers for improving students' skills (Hendriana et al., 2022). Additionally, MCTBE provides evidence for the effectiveness of using ethnomathematics in evaluating students' MCT, such as incorporating Tapis patterns in ethnomathematics to assess fluency, flexibility, originality, and elaboration.
Research questions
The study's main research inquiries include:
RQ1: To what extent can the reliability and validity of MCTBE assessments be evaluated using Rasch measurement models?
RQ2: Do specific test items exhibit DIF based on gender?
RQ3: Do MCTBE scores differ based on gender and grade levels among secondary school students?
RQ4: Which aspects of MCTBE show statistically significant differences between male and female students across different grade levels?
Methods
Participants
The study enrolled secondary school students from grades 7 to 9 in the assessment (M = 13,33; SD = 1,08). Specifically, there were 415 boys (46,32%; M = 13,21; SD = 1,03) and 481 girls (53,68%; M = 13,43; SD = 1,05). The students were randomly selected from secondary schools in Lampung province, Indonesia. The sample was determined using the Slovin formula with a margin of error (e) of 1,54%. The students were supervised by their teachers and completed the test within a timeframe of 120 minutes. The summary of the participants in this research is provided in Table 1.
Table 1
The participants
|
Grade |
N |
Girl/boy ratio (%) |
Mean age (years) |
Private/public school |
|
7 |
306 |
42,8/56,5 |
12,21 |
138/168 |
|
8 |
292 |
56,5/43,5 |
13,41 |
192/100 |
|
9 |
298 |
62,1/37,9 |
14,43 |
119/179 |
|
Total |
896 |
54,7/46,3 |
13,34 |
449/447 |
Instruments
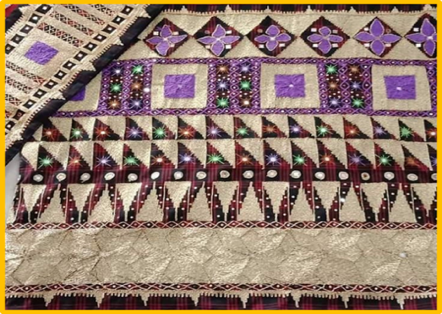
This study utilized an open-ended MCTBE test and a background questionnaire. The questionnaire gathered demographic details such as gender, grade level, ethnicity, school category, and living area. The MCTBE test, evaluated by experts, included 20 ethnomathematics-based items focusing on Tapis Lampung pattern. It assessed fluency, flexibility, originality, and elaboration, comprising figural (9 items) and verbal (11 items) domains. The figural test involved image creation and picture completion, while the verbal test included tasks like guessing causes, product improvement, and identifying alternative uses of objects (Kaufman et al., 2008). Figure 1 presents a sample of the diagnostic test.
Using the scoring methods of Lee & Seo (2003) and Torrance (1966), responses are assessed based on fluency, flexibility, originality, and elaboration. (1) Fluency measures the ability to generate multiple solutions, with a maximum score of 5. (2) Flexibility evaluates the number of unique responses, with students allowed up to five answers per problem, also scoring up to 5. (3) Originality assesses the rarity of responses: above 3% = 0,2–3% = 1, 1–2% = 2, and below 1% = 3. For instance, if fewer than 1% of participants provide the same answer, it scores 3. (4) Elaboration rates the level of detail in responses, scoring between 1 and 2.
Below is the Tapis Lampung pattern. You can observe the triangular shapes within the motif. Using these triangular patterns, create five distinct images. Provide a title for each image.
Design and data analysis
Before conducting the field study, ethical approval was obtained from the Institutional Review Board of the Doctoral School of Education, University of Szeged, in accordance with institutional ethical principles. The research instruments were developed and evaluated by specialists and secondary school educators to address linguistic concerns and ensure content relevance. Secondary school teachers endorsed the tests, aligning them with the Indonesian secondary education curriculum. The examination was conducted on paper and via Google Forms, with responses submitted through email or Google Drive as per school requirements. Informed consent was obtained from parents, who received detailed study information before voluntarily agreeing to their child’s participation. Data analysis was performed using SPSS 25, R Studio 4.2.1, and Winstep 5.2.3.0 for Rasch measurement. Winstep was used for test analysis, applying item-person mapping, model fit analysis, Wright maps, reliability and validity checks, pirate plots in R, and descriptive statistics in SPSS, following Rasch analysis guidelines. Additionally, multivariate analysis of variance (MANOVA) was conducted to examine MCTBE test score differences across grades and genders.
Results
Validity of MCTBE
The validity of the test was assessed by examining the fit of the items and individuals, measured by calculating the mean square (MNSQ) values for infit and outfit. Acceptable MNSQ values range from 0,5 to 1,5, with values up to 1,6 still considered acceptable. Additionally, the desirable fit criteria are those that are close to 1,00 logits, as recommended by Boone et al. (2014). The results of the Rasch analysis are presented in Table 2.
Table 2
Summarizes of measuring the MCTBE using Rasch analysis
|
Measurements |
Subtest |
Test |
|||
|
Fluency |
Flexibility |
Originality |
Elaboration |
MCTBE |
|
|
Number of items |
5 |
6 |
5 |
4 |
20 |
|
Mean |
|
|
|
|
|
|
Person outfit MNSQ |
0,56 |
1,13 |
0,99 |
0,99 |
1,04 |
|
Person infit MNSQ |
0,38 |
1,00 |
0,98 |
0,98 |
1,02 |
|
Item outfit MNSQ |
4,28 |
1,14 |
0,99 |
0,99 |
1,04 |
|
Item infit MNSQ |
0,70 |
0,97 |
0,99 |
1,00 |
1,01 |
|
Person separation |
2,08 |
1,66 |
1,42 |
1,06 |
2,57 |
|
Item separation |
52,28 |
15,54 |
11,37 |
6,83 |
22,18 |
|
Unidimensionality Raw variance by measure |
93,3% |
57,2% |
46,9% |
42,11% |
|
To assess how well the responses match the expected patterns, we use person outfit and infit MNSQ values. These values help determine how well a person’s answers fit with their ability level and the difficulty of the items. In this study, the person outfit MNSQ ranged from 0,56 to 1,13, and the person infit MNSQ ranged from 0,38 to 1,02, which are considered acceptable (Bond, Fox, 2015). For items, the outfit and infit MNSQ values show how well the responses align with the model, with a value of 1,0 indicating a perfect fit. In this study, the item outfit MNSQ ranged from 1,14 to 4,28, and the item infit MNSQ ranged from 0,97 to 1,01. Person separation reflects how well we can distinguish between individuals with different ability levels, while item separation shows how well we can differentiate between items of varying difficulty. The person separation in this study ranged from 1,06 to 2,57, and item separation ranged from 6,83 to 52,28, suggesting good measurement precision. The study also examined unidimensionality, which measures whether the test is focused on a single construct. The raw variance by measure, ranging from 42,11% to 93,3%, suggests the test was reasonably unidimensional, supporting the validity of the instruments based on Rasch measurement.
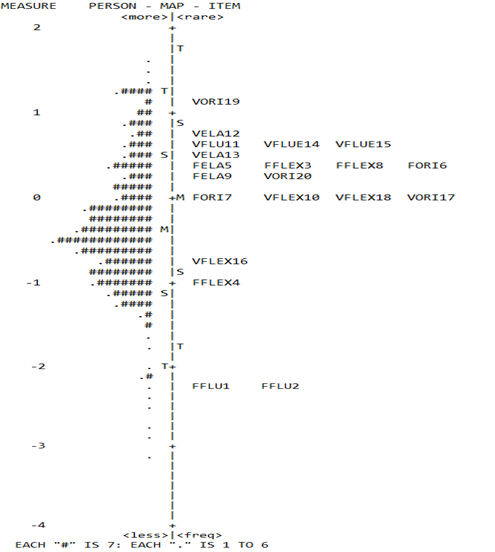
Figure 2 presents a Wright map, depicting item difficulty and student ability on a shared logit scale. Items are positioned on the right, and student abilities on the left. Higher logit scores indicate greater item difficulty and higher student ability. The map identifies FFLU1 (Q1) and FFLU2 (Q2) as the easiest items, while VORI19 (Q19) is the most challenging.
Reliability of MCTBE
Rasch analysis evaluates reliability through person and item reliability indices (Fisher, 2007; Linacre, 2022). Cronbach's Alpha (KR-20) assesses internal consistency, ensuring the reliability of person raw scores (Sekaran, Bougie, 2003). Person reliability, ranging from 0,63 to 0,87, reflects the consistency of individual placements if tested again with similar items (Bond, Fox, 2015). Meanwhile, item reliability, ranging from 0,98 to 1,00, confirms the consistency of item measurement across subtests, demonstrating strong reliability in assessing students' abilities.
The suitability of items in the model was evaluated using Outfit MNSQ, Outfit ZSTD, and Pt-Measure Corr values. An Outfit MNSQ between 0,5 and 1,5 indicates a good fit, while an Outfit ZSTD between -1,9 and 1,9 suggests reasonable predictability. Additionally, Pt-Measure Corr values ensure item functionality, with positive values being acceptable and negative values indicating poor performance (Bond, Fox, 2015).
Table 3
Summary of Item-fit
|
Item |
Measure |
Infit MNSQ |
Outfit MNSQ |
Outfit ZSTD |
Pt-Measure Corr |
|
Q1 |
–2,31 |
1,08 |
1,20 |
1,47 |
0,55 |
|
Q2 |
–2,31 |
1,08 |
1,19 |
1,46 |
0,55 |
|
Q3 |
0,38 |
1,28 |
1,16 |
2,99 |
0,50 |
|
Q4 |
–0,90 |
1,22 |
1,38 |
6,41 |
0,54 |
|
Q5 |
0,39 |
0,78 |
0,85 |
–3,11 |
0,38 |
|
Q6 |
0,32 |
0,96 |
1,20 |
3,65 |
0,48 |
|
Q7 |
0,02 |
0,55 |
0,66 |
–7,42 |
0,43 |
|
Q8 |
0,38 |
1,28 |
1,16 |
2,99 |
0,50 |
|
Q9 |
0,28 |
0,66 |
0,72 |
–5,69 |
0,51 |
|
Q10 |
0,01 |
1,26 |
1,21 |
3,86 |
0,77 |
|
Q11 |
0,63 |
1,39 |
1,18 |
3,29 |
0,68 |
|
Q12 |
0,79 |
0,60 |
0,70 |
–6,35 |
0,51 |
|
Q13 |
0,50 |
0,74 |
0,85 |
–2,94 |
0,38 |
|
Q14 |
0,63 |
1,38 |
1,18 |
3,21 |
0,68 |
|
Q15 |
0,63 |
1,40 |
1,19 |
3,48 |
0,68 |
|
Q16 |
–7,73 |
0,99 |
1,18 |
3,27 |
0,58 |
|
Q17 |
0,03 |
0,88 |
1,02 |
0,33 |
0,49 |
|
Q18 |
0,01 |
1,26 |
1,22 |
3,89 |
0,77 |
|
Q19 |
1,07 |
0,79 |
0,84 |
–3,39 |
0,73 |
|
Q20 |
0,28 |
0,67 |
0,73 |
–5,69 |
0,51 |
The analysis of the 20 items used in the survey is presented in Table 3. Despite the Outfit ZSTD values falling outside the acceptable range for all but three items (Q1, Q2, and Q17), the Outfit MNSQ and Pt-Measure Corr values were still within the acceptable range. Thus, an item is deemed appropriate for measurement only if it satisfies all three criteria. However, if one or two criteria are not met, the item may still be utilized for measurement. Overall, the data collected from Indonesian secondary school students were analyzed using the Rasch model, leading to the measurement of 20 items.
DIF owing gender
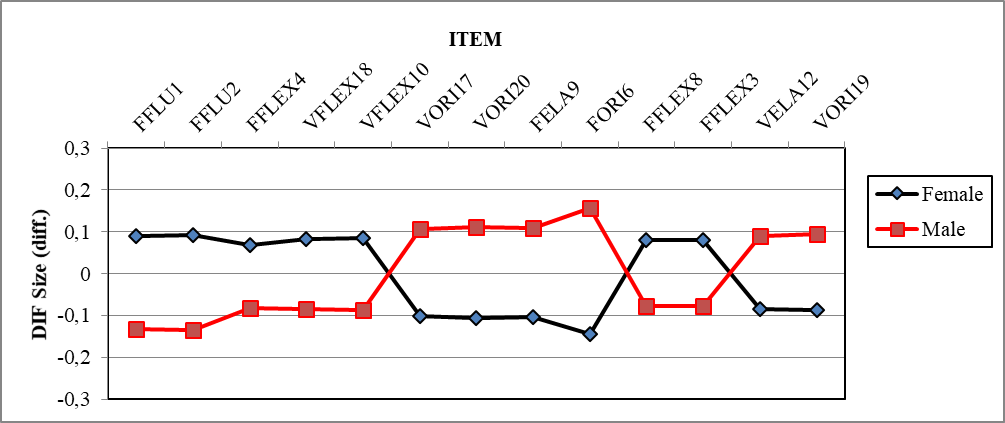
We assessed the impact of potential DIF. An item was identified as exhibiting DIF if it had a t-value below –2,0 or above 2,0, a DIF contrast value below –0,5 or above 0,5, and a p-value below 0,05 or above –0,05. This approach is consistent with the recommendations of Boone et al. (2014) and Bond & Fox (2015). The potential DIF items are presented in Table 4 and Figure 3.
Figure 3 shows that male students found items Q6, Q9, Q12, Q17, Q19, and Q20 more difficult than female students. Q6 and Q9 relate to figural tests, Q12 to unusual tasks, and Q17, Q19, and Q20 to verbal tests. DIF was categorized as negligible, slight to moderate (|DIF| ≥ 0,43 logits), and moderate to large (|DIF| ≥ 0,64 logits) (Boone et al., 2014). Out of the 20 items, 13 showed negligible to moderate DIF bias. These items were retained to preserve the test’s reliability and validity.
Table 4
DIF measurement by female and male in MCTBE
|
Item |
DIF |
DIF Contrast |
t |
Prob |
|
|
Male |
Female |
||||
|
Q1 |
–2,22 |
–2,44 |
0,22 |
2,86 |
0,0043 |
|
Q2 |
–2,21 |
–2,44 |
0,23 |
2,93 |
0,0035 |
|
Q3 |
0,46 |
0,30 |
0,16 |
2,05 |
0,0411 |
|
Q4 |
–0,93 |
–1,08 |
0,15 |
2,47 |
0,0137 |
|
Q6 |
0,18 |
0,48 |
–0,30 |
–3,96 |
0,0001 |
|
Q8 |
0,46 |
0,30 |
0,16 |
2,05 |
0,0411 |
|
Q9 |
0,18 |
0,39 |
–0,21 |
–2,85 |
0,0045 |
|
Q10 |
0,10 |
–0,08 |
0,17 |
2,44 |
0,0149 |
|
Q12 |
0,71 |
0,88 |
–0,18 |
–2,06 |
0,0393 |
|
Q17 |
–0,07 |
0,13 |
–0,21 |
–2,94 |
0,0034 |
|
Q18 |
0,09 |
–0,08 |
0,17 |
2,37 |
0,0180 |
|
Q19 |
0,98 |
1,17 |
–0,18 |
–2,01 |
0,0451 |
|
Q20 |
0,18 |
0,39 |
0,22 |
–2,92 |
0,0036 |
Exploring MCTBE in secondary students by gender and grade level
The logit value person (LVP) is used to represent an individual's location along this latent trait, which is often interpreted as a measure of their level of proficiency or skill in the domain being measured. To evaluate students' abilities, the LVP analysis relied on the mean (M) and standard deviation (SD) values of all LVPs. There are four categories of LVP: very high (LVP M + SD), high (M + SD LVP M), moderate (M LVP M – SD), and low (LVP M – SD).
Table 5 shows the number of students falling into four categories of LVP: very high, high, moderate, and low. In terms of gender, 56 (11,64%) female students and 95 (22,89%) male students were categorized as having very high LVP, while 62 (12,89%) female students and 29 (6,99%) male students were categorized as having low LVP. The majority of female and male students fell into the high and moderate LVP categories.
Table 5
LVP analysis owing gender and grade levels
|
Categories |
Very high; LVP 0,46 |
High; 0,46 LVP –0,34 |
Moderate; –0,34 LVP –1,14 |
Low; LVP –1,14 |
|
Gender |
|
|
|
|
|
Female |
56 |
162 |
201 |
62 |
|
Male |
95 |
120 |
171 |
29 |
|
Grade level |
|
|
|
|
|
Grade 7 |
43 |
109 |
125 |
29 |
|
Grade 8 |
42 |
95 |
124 |
31 |
|
Grade 9 |
66 |
78 |
123 |
31 |
Grade 9 had the highest number of students with very high LVP, followed by Grade 7, and Grade 8. Grade 7 also had the most students with low LVP, followed by Grades 9 and 8. Overall, many students had high or very high LVP, with male students slightly outnumbering female students in the very high category. The analysis showed grade-level differences, with Grade 9 having the most students in the very high LVP range.
Differences in students’ MCTBE by grade level and gender
The subtest of MCTBE was administered to students from different cohorts, and their performance was evaluated using a pirate plot (see Figure 4). This plot provides a visual representation of data distribution, depicting key elements such as raw data points, the central tendency represented by bars or lines, the density of the data using bean plots, and the presence of 95% confidence intervals or highest density intervals that indicate the range of uncertainty or variability in the data.
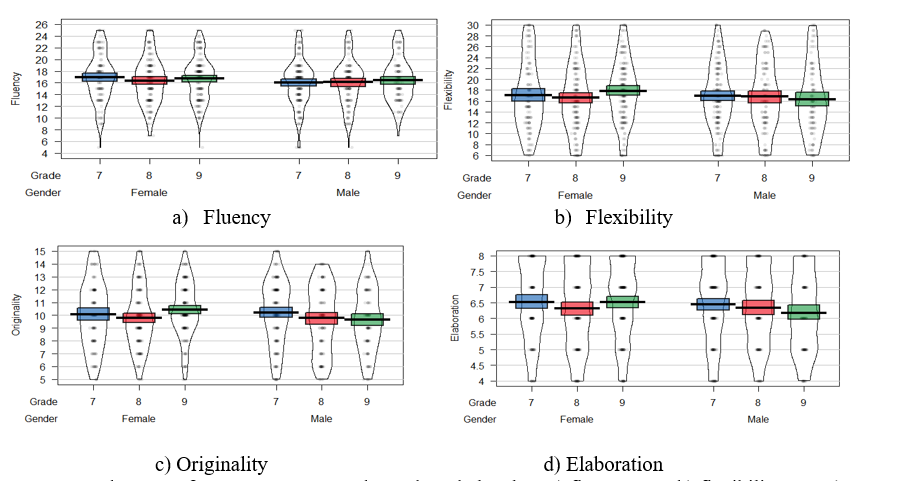
Fig. 4. Students’ performance across gender and grade level on a) fluency test, b) flexibility test, c) originality test, and d) elaboration test
Figure 4a presents student performance on the fluency task, comparing gender and grade level. Female students had the highest fluency scores in Grade 7 (M = 16,95), followed by Grade 9 (M = 16,73) and Grade 8 (M = 16,39). For male students, the highest scores were in Grade 9 (M = 16,48), followed by Grade 8 (M = 16,12), with Grade 7 scoring the lowest (M = 16,05). The standard deviations (SD) were consistent across grade levels for both genders. In the flexibility test (Fig. 4b), female students scored highest in Grade 9 (M = 17,84), followed by Grade 7 (M = 17,08) and Grade 8 (M = 16,56). For male students, Grade 7 had the highest score (M = 16,92), followed by Grade 8 (M = 16,80) and Grade 9 (M = 16,27). SD values were similar across groups, indicating consistent variability in performance. The originality test (Fig. 4c) showed similar mean scores for both genders across grades, with slight variations: females outperformed males in Grades 7 and 9, while males outperformed females in Grade 8. SD values were consistent, suggesting no significant gender influence on performance. In the elaboration test (Fig. 4d), female students' mean scores ranged from 10.07 in Grade 7 to 10.43 in Grade 9, while male students ranged from 9,65 in Grade 9 to 10,22 in Grade 7. SDs were similar, suggesting slight gender and grade differences, but the overall variation was significant. In summary, while there are some grade and gender differences in scores across the tests, the performance trends are generally consistent across groups.
To examine the differences in grade (see Table 6) and gender (see Table 7) on the MCTBE test, we performed a MANOVA.
Table 6
MANOVA comparison by grade
|
Variables |
Grade 7th M (SD) |
Grade 8th M (SD) |
Grade 9th M (SD) |
F-test |
Partial |
|
Fluency |
16,43 (4,13) |
16,27 (3,99) |
16,63 (3,77) |
0,61 |
0,001 |
|
Flexibility |
16,99 (6,23) |
16,66 (6,21) |
17,25 (6,20) |
0,65 |
0,001 |
|
Elaboration |
6,48 (1,28) |
6,33 (1,28) |
6,39 (1,27) |
1,06 |
0,002 |
|
Originality |
10,16 (2,56) |
9,78 (2,49) |
10,13 (2,34) |
2,19 |
0,005 |
The MANOVA comparison by grade reveals that fluency and flexibility scores are nearly identical across the three grades, with only small variations in the originality scores, where Grade 7 shows the highest mean. Overall, the results suggest that grade level has a limited impact on performance in these cognitive tasks, as evidenced by the low effect sizes.
Table 7
MANOVA comparison by gender
|
Variables |
Female M (SD) |
Male M (SD) |
F-test |
Partial |
|
Fluency |
16,68 (3,98) |
16,19 (3,94) |
3,41 |
0,004 |
|
Flexibility |
17,20 (6,21) |
16,71 (6,20) |
1,39 |
0,002 |
|
Elaboration |
6,45 (1,28) |
6,33 (1,27) |
1,83 |
0,002 |
|
Originality |
10,11 (2,39) |
9,93 (2,56) |
1,09 |
0,001 |
The MANOVA comparison by gender (Table 7) shows that females tend to score higher than males in fluency, flexibility, and originality, with fluency showing the most noticeable difference (F = 3,41, partial η² = 0,004). However, the effect sizes for flexibility, elaboration, and originality are small, indicating minimal gender-based differences in these variables. While there are slight gender differences in cognitive performance, the effect sizes are low, suggesting that gender has a limited impact on these tasks.
Discussion
The study found that the MCTBE test items and subtests aligned well with the Rasch model, indicating their validity for assessing creativity in Indonesian students. The mean person and item outfit and infit MNSQ values fell within the acceptable range, confirming a good fit to the model. The analysis also showed that the test is unidimensional, with good measurement precision, and revealed varying item difficulty, with FFLU1 (item 1) and FFLU2 (item 2) being the easiest and VORI19 (item 19) the most challenging. The current study showed good reliability, with Cronbach's Alpha indicating strong person reliability, and high item reliability coefficients demonstrating consistent measurement across subtests. The results, supported by previous research, showed that the Rasch model is a valid and reliable method, with most items meeting acceptable criteria for Outfit MNSQ, Outfit ZSTD, and Pt-Measure Corr values (Bond, Fox, 2015; Boone et al., 2014).
This excerpt discusses the analysis of DIF based on gender in the MCTBE test. DIF helps determine whether test items favor certain groups or exhibit performance differences based on group membership (Reynolds et al., 2021). To assess the practical significance of DIF, we applied a statistical approach measuring effect size. The findings align with previous research that identified gender-based DIF in assessments (Kwon, Sawatzky, 2017). Rather than eliminating DIF-affected items, we retained them to preserve the test’s reliability and validity, consistent with Zwick et al. (1999), who highlighted the risks of item removal on psychometric properties. This approach reinforces the importance of conducting DIF analyses to ensure fairness and validity in assessments.
The LVP analysis results for gender and grade levels provide valuable insights into secondary students' performance in MCTBE. Male students showed slightly higher numbers in the very high LVP category compared to female students, but most students fell into the high and moderate LVP categories, aligning with previous research on the gender gap in STEM fields (Mastrodicasa, Metellus, 2013). Regarding grade levels, Grade 9 students had the highest number of very high LVP, followed by Grade 7 and Grade 8, which supports previous findings on the positive relationship between grade level and academic performance (Li, Lerner, 2011). In this regard, the presented results align with previous research and provide valuable insights into the performance of secondary students in MCTBE, with gender and grade level being significant factors that influence students' performance.
The findings of this study on differences in students' MCTBE across grade levels and gender align with previous research. Baer & Kaufman (2008) found that gender differences in creativity varied by age, with females generally outperforming males in younger age groups, while males performed better in older age groups. This pattern is reflected in our study, where females excelled in fluency and flexibility in 7th and 9th grades, whereas males performed better in these tasks in 8th grade, suggesting that fluency and flexibility may follow an easier pattern. In contrast, Matud et al. (2007) reported no significant gender differences in creativity but found variations based on academic major, age, and task type. Additionally, Bart et al. (2015) examined CT abilities in 8th and 11th graders, revealing no significant gender differences but highlighting greater creative thinking abilities in higher grade levels. These findings contribute to the ongoing discussion on the complex interplay of gender and grade level in mathematical creativity.
To ensure the consistency of external validation, we engaged three independent raters to evaluate the meaning of the items from a psychological education perspective. Each rater conducted a thorough assessment to validate the content. Although the TTCT is an established instrument (Torrance, 1966), this study introduces a novel perspective by demonstrating how cultural elements, such as ethnomathematics, can serve as a valuable foundation for creating instruments to assess mathematical creative thinking. This approach emphasizes the integration of cultural context into creativity measurement tools.
Limitations and future research
The study had two main limitations. The first was that the assessment of CT using an ethnomathematical context was limited to secondary students at different levels within Indonesia. Therefore, other studies could investigate CT in other levels of education, such as primary education, senior high school, and higher education, with diverse cultures to generalize the findings further. The second limitation was the sample size, which was restricted to a single region and grade level. Future research could validate the test in other contexts and populations and explore additional factors that may affect test performance, including socioeconomic status, cultural background, attitude, and student motivation.
This study highlights several topics that require further investigation. Firstly, researchers should conduct more studies to explore whether 7th to 9th graders in other countries or regions possess similar CT abilities using an ethnomathematical context. Replicating this study may provide valuable insights into how creativity is influenced by diverse cultural and educational settings. Additionally, further studies could examine different patterns of creativity exhibited by individuals of various genders across different educational stages. Such research could help identify when disparities in creative thinking emerge among gifted students and how to bridge the performance gap considering students' cultural backgrounds.
Conclusions
In conclusion, the analysis for research question 1 confirmed that the test items and student performance aligned with the Rasch model, validating the test's ability to measure its intended construct. The measurement precision and unidimensionality of the MCTBE test were satisfactory, ensuring reliability in assessing students' abilities. For research question 2, retaining DIF-affected items was essential to maintain the assessment’s reliability and validity, emphasizing the importance of appropriate statistical methods in DIF analysis. Regarding research question 3, male students generally outperformed females, with more males categorized in the very high LVP group. Grade 9 students had the highest proportion of very high LVP scores, followed by Grades 7 and 8, indicating strong overall performance in MCTBE. Finally, for research question 4, slight differences were observed in MCTBE scores based on gender and grade level, particularly in fluency and flexibility. Grade 9 students performed better in fluency and flexibility, while Grade 7 students excelled in elaboration and originality. Although females showed slightly higher scores across all variables, these differences had minimal effect sizes.
The results of this research carry significant implications for the domain of MCTBE assessments, as well as for the enhancement of mathematics education in Indonesia and the progress of educational research overall. These findings hold the potential to guide teachers, government bodies, and researchers in enhancing the standard of mathematics education and ensuring accurate evaluation of students' mathematical proficiency. The study also provides support for the integration of MCTBE into the school curriculum.