Introduction
Lecturers play a central role in higher education by handling multiple responsibilities, including teaching, research, and service to the wider community (Akah et al., 2022; Odigwe, Bassey, Owan, 2020; Owan, Bassey, Ubi, 2023). Alongside these core tasks, they also manage administrative duties and guide students through mentorship (Owan, Odigwe et al., 2022), all of which influence how well graduates perform in their professional lives (Aduma et al., 2022). To manage these demands effectively, emotional intelligence (EI) is essential. Studies link EI among lecturers to improved student learning, greater sensitivity to learners’ needs, and more welcoming classroom experiences (Sellbom, Tellegen, 2019). EI also helps lecturers cope with job stress, especially during remote work, and supports their mental health and job satisfaction (Iacolino et al., 2023).
Although EI is widely recognised as important, most African universities lack reliable tools for measuring it among academic staff. Existing questionnaires, mostly designed in Western countries, often fail to produce dependable results and do not align with the realities of African lecturers (O’Connor et al., 2024). This limits efforts to assess emotional skills and support academic staff development (Sellbom, Tellegen, 2019). This study responds to that need by designing and validating the Academic Staff Emotional Intelligence Questionnaire (ASEIQ) for Nigerian universities.
Theoretical framework of emotional intelligence
Salovey and Mayer defined emotional intelligence (EI) as the ability to monitor and differentiate one’s own emotions and those of others to guide thought and behaviour (Salovey, Mayer, 1990). Mayer et al. later stressed its role in emotional awareness, understanding, and regulation (Mayer, Caruso, Salovey, 2016). Bar-On saw EI as noncognitive traits supporting adaptation, such as optimism (Bar-On, 1997), while Goleman described it as emotional skills used in social interactions (Goleman, 1995). Scholars now view EI in terms of regulation (García-Martínez et al., 2021), recognition, and affective management (Rodrigues et al., 2019). High EI supports well-being (Salovey, Grewal, 2005). Mayer et al. identified four main EI abilities: perception, facilitation, understanding, and management (Mayer, Caruso, Salovey, 2016).
In line with recent literature, emotional intelligence (EI) is best understood through two major theoretical models: the ability model and the mixed model. These models are associated with three primary assessment methods: (1) performance-based tests (aligned with ability models), (2) self-report questionnaires based on ability models, and (3) self-report questionnaires based on mixed models. Based on these classifications, the two dominant models of EI are clarified:
- Ability model: The ability model sees emotional intelligence as a set of cognitive-emotional abilities. It involves perceiving, understanding, using, and managing emotions, typically measured through performance-based tasks that assess how individuals solve emotional problems or apply emotions to thinking (Khassawneh et al., 2022).
- Mixed model: The mixed model combines emotional abilities with personality traits. It includes skills like self-awareness, empathy, and motivation. Developed by Goleman and Bar-On, it treats emotional intelligence as both measurable and developable, useful for improving relationships, well-being, and workplace performance (Bar-On, 1997; Owan, 2023).
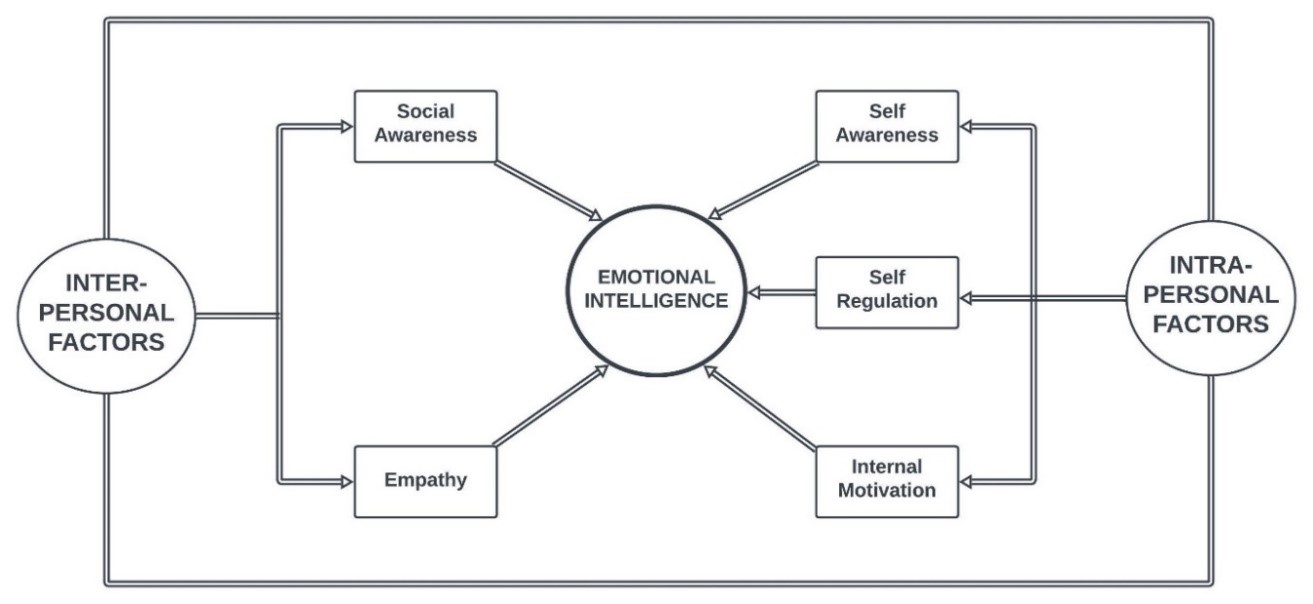
This study adopted Goleman’s mixed model of emotional intelligence, which outlined five core domains: self-awareness, social awareness, self-regulation, empathy, and motivation (Goleman, 1995). These were grouped into two broad dimensions, as shown in Figure 1. The interpersonal dimension included social abilities such as empathy and contextual sensitivity (Owan, 2023), which supported emotional regulation during social interactions (Mercader-Rubio et al., 2022). The intrapersonal dimension focused on internal abilities like emotional self-control and goal-driven motivation (Okwuduba et al., 2021), supported by reflective thinking. These two dimensions worked together, and their relevance depended on the specific emotional or social demands present in a given situation.
Measuring emotional intelligence: review of existing instruments
The measurement of emotional intelligence (EI) remains contested, with competing models producing varied instruments (see Supplementary Data 2). Most tools were developed in Asia, Europe and America, with little representation from Africa or Australia. Only two African studies conducted in Zambia (Musonda, Shumba, Tailoka, 2013) and South Africa (Jonker, Vosloo, 2008), have adapted EI scales regionally. No Nigerian study has contextualised EI for academic staff. Existing models, such as the nine-layer pyramid (Drigas, Papoutsi, 2021) and emotional competence assessment (Bartroli et al., 2022), focus on schoolteachers. Given the role of EI in teaching effectiveness (Vashisht et al., 2023), this study introduces the ASEIQ to address that gap.
Materials and methods
Instrument development
The Academic Staff Emotional Intelligence Questionnaire (ASEIQ) was adapted from a validated instrument (Bru-Luna et al., 2021) following cross-cultural adaptation protocols to reflect socio-professional dynamics in developing nations (Han et al., 2022). A 4-point Likert scale (1 = Strongly Disagree, 4 = Strongly Agree) minimises central tendency bias (Douglas, Ewell, Brauer, 2023). The initial 40-item pool operationalized five factors: self-awareness, self-regulation, social awareness, motivation, and empathy. See the supplementary material for more details at https://ruspsydata.mgppu.ru/workflowitems/229/view.
Face and content validation
Three psychometricians and four educational psychologists assessed the items for clarity, relevance, and simplicity. Content validity was calculated based on average scores of experts’ agreement, with I-CVI scores between 0,86 and 1,00, and an S-CVI/Ave of 0,92, exceeding the 0,90 cut-off. Semi-structured interviews with ten Nigerian lecturers led to the revision of unclear wording, removal of redundant items, and adjustment of scale length, following mixed-method validation guidelines (Cheung et al., 2024).
Participants
A stratified sample of 3145 lecturers was recruited from Nigerian universities, exceeding the minimum requirements for confirmatory factor analysis (CFA) and structural equation modelling (SEM) (Khassawneh et al., 2022). The participants were allocated to three subsamples via sequential assignment:
- EFA: n = 262 (10:1 participant-to-item ratio for 26 items)
- CFA: n = 1300 (20:1 ratio × 2.5 scaling factor)
- Bifactor: n = 1560 (20:1 ratio × 3 scaling factor) (Reise et al., 2021).
After exclusions, 3122 lecturers were retained:
- Gender: Male (51,6%, n = 1611); Female (48,4%, n = 1511)
- Age: <40 years (26,7%, n = 834); 40–49 (24,2%, n = 755); 50–59 (21,4%, n = 667); ≥ 60 (27,7%, n = 865)
- Qualifications: Master’s (54,4%, n = 1699); Doctorate (45,6%, n = 1423)
- Ranks: Assistant Lecturer (18,9%, n = 589); Lecturer II (14,7%, n = 459); Lecturer I (19,3%, n = 603); Senior Lecturer (13,7%, n = 427); Associate Professor (20,4%, n = 637); Professor (13,0%, n = 406)
Results
Exploratory factor analysis (EFA)
Data screening showed no missing values. Normality checks using histograms, Q-Q plots, and normality tests revealed minor deviations from normality, but most items were within acceptable limits. No univariate outliers were found, though 23 multivariate outliers (p < 0,001) were detected and removed, leaving 3122 valid responses. Descriptive statistics met recommended SEM thresholds (Casale et al., 2021). Exploratory factor analysis (EFA) was conducted on subsample 1 (n = 262) using principal axis factoring with varimax rotation (Coşkun et al., 2023). Factors with eigenvalues above 1 were retained, while items with loadings below 0,40 (e.g., SOA6, EMP5) were excluded. The final five-factor structure accounted for 74,12% of total variance. KMO (0,87) confirmed sampling adequacy, and Bartlett’s test (χ²[351] = 7544,95, p < 0,001) supported factorability (see Table 1).
Table 1
Loadings of exploratory factor analysis for the ASEIQ (n = 262)
|
Factors |
Item label |
EFA |
||
|
λ |
λ2 |
ε |
||
|
Self-regulation |
SRE3 |
0,97 |
0,94 |
0,06 |
|
SRE1 |
0,97 |
0,94 |
0,06 |
|
|
SRE7 |
0,97 |
0,93 |
0,07 |
|
|
SRE5 |
0,96 |
0,92 |
0,08 |
|
|
SRE2 |
0,95 |
0,91 |
0,09 |
|
|
SRE6 |
0,95 |
0,90 |
0,10 |
|
|
Ʃ |
50,77 |
50,55 |
0,45 |
|
|
Empathy |
EMP3 |
0,96 |
0,92 |
0,08 |
|
EMP2 |
0,94 |
0,89 |
0,11 |
|
|
EMP4 |
0,94 |
0,88 |
0,12 |
|
|
EMP7 |
0,91 |
0,82 |
0,18 |
|
|
EMP8 |
0,90 |
0,81 |
0,19 |
|
|
Ʃ |
40,65 |
40,32 |
0,68 |
|
|
Self-awareness |
SAW8 |
0,90 |
0,81 |
0,19 |
|
SAW6 |
0,89 |
0,79 |
0,21 |
|
|
SAW1 |
0,89 |
0,79 |
0,21 |
|
|
SAW3 |
0,89 |
0,79 |
0,21 |
|
|
SAW5 |
0,88 |
0,77 |
0,23 |
|
|
Ʃ |
40,44 |
30,95 |
10,05 |
|
|
Social awareness |
SOA4 |
0,83 |
0,69 |
0,31 |
|
SOA5 |
0,82 |
0,67 |
0,33 |
|
|
SOA8 |
0,82 |
0,66 |
0,34 |
|
|
SOA1 |
0,80 |
0,63 |
0,37 |
|
|
SOA2 |
0,79 |
0,62 |
0,38 |
|
|
Ʃ |
40,05 |
30,29 |
10,71 |
|
|
Internal motivation |
INM3 |
0,76 |
0,58 |
0,42 |
|
INM7 |
0,75 |
0,56 |
0,44 |
|
|
INM1 |
0,75 |
0,56 |
0,44 |
|
|
INM5 |
0,73 |
0,54 |
0,46 |
|
|
INM8 |
0,71 |
0,51 |
0,49 |
|
|
Ʃ |
3,70 |
2,74 |
2,26 |
|
Confirmatory factor analysis (CFA)
Confirmatory factor analysis (CFA) was used to examine variable–factor relationships, assess model fit, and test the structure of the ASEIQ (Ekpenyong et al., 2022; Owan, Emanghe et al., 2022). Four models were evaluated using subsample 2 (n = 1300) (see Table 2): a single-factor model, a correlated five-factor model, a second-order model (Figure 2), and a bifactor model combining a general EI factor with five specific dimensions (Figure 3) (Owan, Bassey, Ubi, 2023). The single-factor model showed poor fit (χ²(299) = 4818,35, RMSEA = 0,241, CFI = 0,396, TLI = 0,344). In contrast, the other three models met standard fit criteria. Of these, the bifactor model showed the best performance (RMSEA = 0,043, CFI = 0,982, TLI = 0,979) and had the lowest values on information criteria (AIC = 1772,79, BIC = 2159,25), confirming it as the most appropriate structure for the ASEIQ.
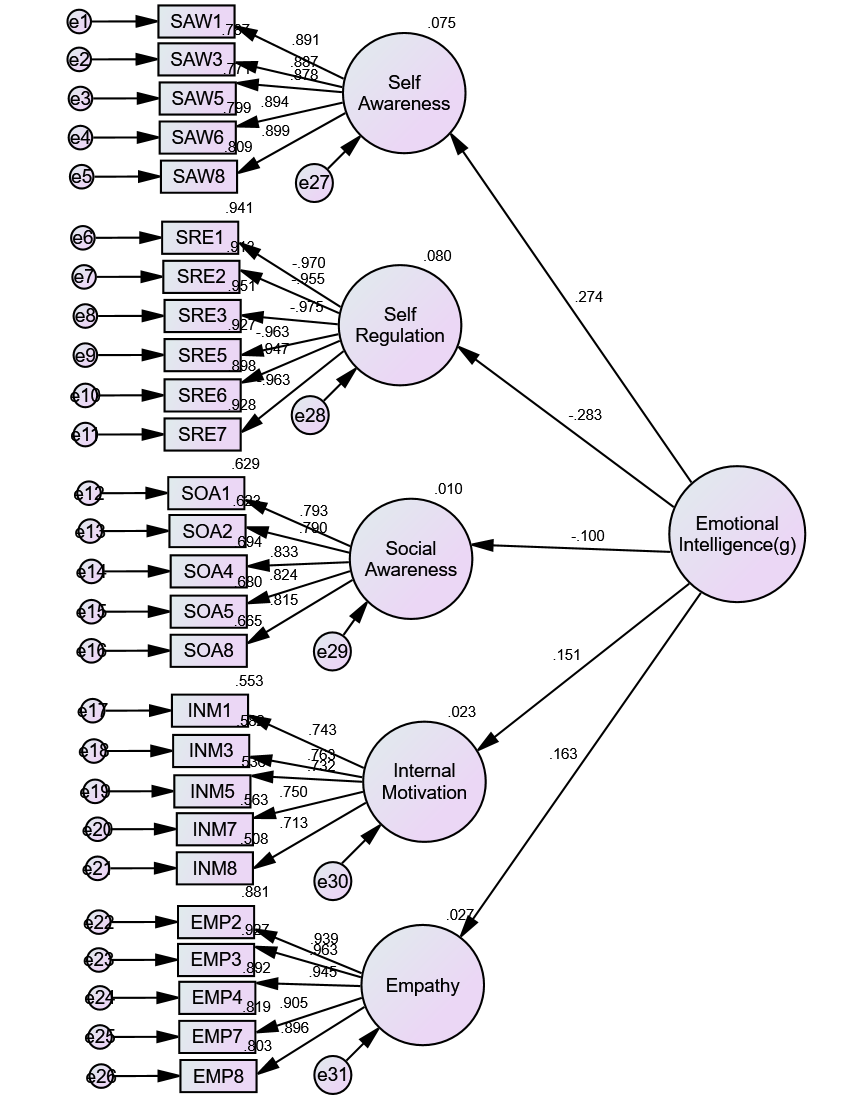
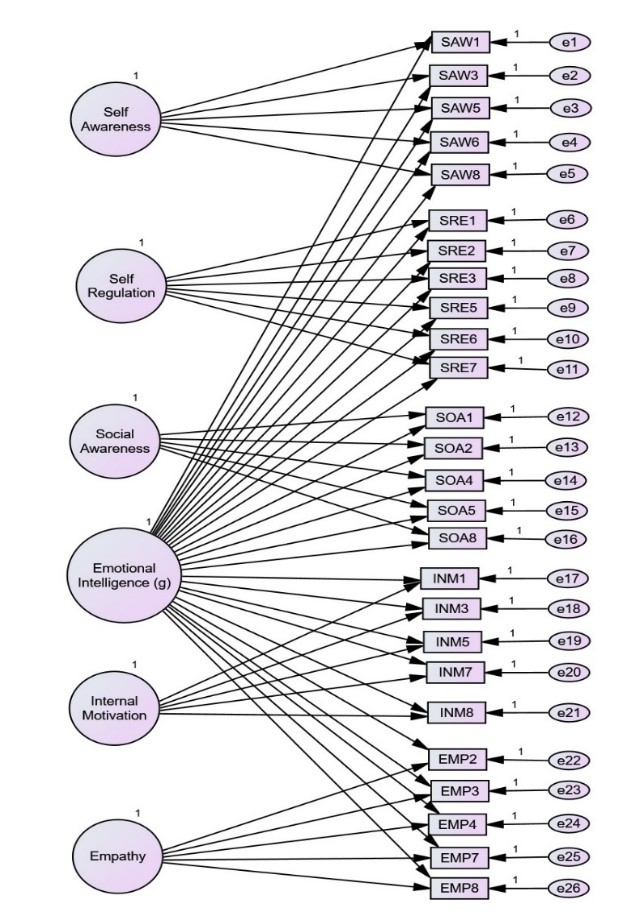
Table 2
Standardized confirmatory factor analysis loadings for the single, oblique, second-order and bifactor models of the ASEIQ (n = 1300)
|
Items |
Single Factor Model |
Oblique or Correlated Factor Model |
(Schmid-Leiman transformation) Second-order Model |
Bi-Factor or Nested Model |
||||||||||||||
|
g |
1 |
2 |
3 |
4 |
5 |
g |
1 |
2 |
3 |
4 |
5 |
g |
1 |
2 |
3 |
4 |
5 |
|
|
SAW1 |
0,11 |
0,89 |
0,24 |
0,83 |
|
0,02 |
0,89 |
|||||||||||
|
SAW3 |
0,07 |
0,89 |
0,24 |
0,82 |
|
0,02 |
0,89 |
|||||||||||
|
SAW5 |
0,03 |
0,88 |
0,24 |
0,81 |
|
0,02 |
0,88 |
|||||||||||
|
SAW6 |
0,08 |
0,89 |
0,24 |
0,83 |
|
0,02 |
0,89 |
|||||||||||
|
SAW8 |
0,08 |
0,90 |
0,25 |
0,83 |
|
0,02 |
0,90 |
|||||||||||
|
SRE1 |
0,97 |
-0,97 |
0,27 |
-0,87 |
|
0,04 |
0,97 |
|||||||||||
|
SRE2 |
0,96 |
-0,96 |
0,27 |
-0,85 |
|
0,01 |
0,96 |
|||||||||||
|
SRE3 |
0,98 |
-0,98 |
0,28 |
-0,87 |
|
0,02 |
0,98 |
|||||||||||
|
SRE5 |
0,96 |
-0,96 |
0,27 |
-0,86 |
|
-0,01 |
0,96 |
|||||||||||
|
SRE6 |
0,95 |
-0,95 |
0,27 |
-0,85 |
|
0,01 |
0,95 |
|||||||||||
|
SRE7 |
0,96 |
-0,96 |
0,27 |
-0,86 |
|
0,01 |
0,96 |
|||||||||||
|
SOA1 |
0,01 |
0,79 |
-0,08 |
0,78 |
|
0,00 |
0,79 |
|||||||||||
|
SOA2 |
0,00 |
0,79 |
-0,08 |
0,78 |
|
0,00 |
0,79 |
|||||||||||
|
SOA4 |
-0,02 |
0,83 |
-0,08 |
0,82 |
|
0,00 |
0,83 |
|||||||||||
|
SOA5 |
0,01 |
0,82 |
-0,08 |
0,81 |
|
0,00 |
0,83 |
|||||||||||
|
SOA8 |
-0,02 |
0,82 |
-0,08 |
0,80 |
|
0,00 |
0,82 |
|||||||||||
|
INM1 |
0,09 |
0,74 |
0,11 |
0,72 |
|
0,00 |
0,74 |
|||||||||||
|
INM3 |
0,05 |
0,76 |
0,12 |
0,73 |
|
0,00 |
0,76 |
|||||||||||
|
INM5 |
0,05 |
0,73 |
0,11 |
0,70 |
|
0,01 |
0,73 |
|||||||||||
|
INM7 |
0,01 |
0,75 |
0,11 |
0,72 |
|
0,01 |
0,75 |
|||||||||||
|
INM8 |
0,07 |
0,71 |
0,11 |
0,69 |
|
0,00 |
0,71 |
|||||||||||
|
EMP2 |
0,01 |
0,94 |
0,15 |
0,91 |
-1,17 |
1,62 |
||||||||||||
|
EMP3 |
0,04 |
0,96 |
0,16 |
0,93 |
0,43 |
0,87 |
||||||||||||
|
EMP4 |
0,03 |
0,95 |
0,15 |
0,92 |
0,42 |
0,85 |
||||||||||||
|
EMP7 |
0,04 |
0,91 |
0,15 |
0,88 |
0,37 |
0,81 |
||||||||||||
|
EMP8 |
0,03 |
0,90 |
0,15 |
0,87 |
0,41 |
0,80 |
||||||||||||
|
Latent S2 |
1,0 |
1,0 |
1,0 |
1,0 |
1,0 |
1,0 |
1,0 |
0,03 |
0,23 |
0,10 |
0,08 |
,08 |
1,0 |
1,0 |
1,0 |
1,0 |
1,0 |
1,0 |
|
λ (unique) |
0,93 |
0,89 |
0,99 |
0,96 |
0,97 |
|
||||||||||||
|
λ (Second-order) |
0,27 |
-0,28 |
-0,10 |
0,15 |
0,16 |
|
||||||||||||
|
Note: 1 = Self-awareness; 2 = Self-regulation; 3 = Social awareness; 4 = Internal motivation; 5 = Empathy. |
|
|
|
|
|
|||||||||||||
Table 3
Comparing the fit indices of the CFA models of the ASEIQ (n = 1300)
|
Criteria |
Single factor |
Oblique |
Second-order |
Bifactor |
Recommended Benchmarks |
|
χ2(df) |
4818,35(299), p < 0,05 |
504,01(289), p < 0,05 |
506,44(294), p < 0,05 |
505,57(273), p < 0,05 |
p > 0,05 |
|
RMSEA |
0,241 |
0,053 |
0,053 |
0,043 |
< 0,08 |
|
SRMR |
0,247 |
0,031 |
0,037 |
0,024 |
< 0,08 |
|
CFI |
0,396 |
0,971 |
0,972 |
0,982 |
≥ 0,95 |
|
TLI |
0,344 |
0,968 |
0,969 |
0,979 |
≥ 0,95 |
|
AIC |
19432,78 |
2145,85 |
2145,58 |
1772,79 |
Lower is better |
|
BCC |
19435,53 |
2149,14 |
2148,6 |
1776,92 |
Lower is better |
|
BIC |
19690,42 |
2453,03 |
2428 |
2159,25 |
Lower is better |
|
CAIC |
19742,42 |
2515,03 |
2485 |
2237,25 |
Lower is better |
Bifactor model evaluation
The bifactor model showed better fit than other CFA models, based on indices such as RMSEA, χ², SRMR, TLI, and CFI (Table 3). However, traditional indices alone may not separate general and specific factors clearly (Flores-Kanter, Mosquera, 2023). Advanced indices were computed using the BifactorIndicesCalculator (Dueber, 2017) with a subsample of 1560 (Table 2). The results (Table 4) showed a strong general factor (ω = 0,94), but low subscale ωH values (< 0,80) and weak ECV (0,05) and IECV (0,01–0,09) suggested multidimensionality. Despite high PUC (> 0,80), caution was advised. The high ARPB (0,78) further supported adopting the bifactor model (Owan, Bassey, Ubi, 2023).
Table 4
Auxiliary fit evaluation of the dimensionality of the bifactor CFA models of the ASEIQ (n = 1560)
|
Dimensions |
ECV (S&E) |
ECV (NEW) |
ω/ωS |
ωH/ωHS |
Relative ω |
H |
FD |
|
General factor |
0,05 |
0,05 |
0,94 |
0,12 |
0,13 |
0,80 |
0,94 |
|
Self-awareness |
0,18 |
0,92 |
0,93 |
0,86 |
0,92 |
0,91 |
0,93 |
|
Self-regulation |
0,24 |
0,91 |
0,96 |
0,88 |
0,91 |
0,94 |
0,94 |
|
Social awareness |
0,17 |
0,99 |
0,90 |
0,89 |
0,99 |
0,90 |
0,95 |
|
Internal motivation |
0,14 |
0,98 |
0,84 |
0,82 |
0,98 |
0,84 |
0,91 |
|
Empathy |
0,22 |
0,97 |
0,96 |
0,94 |
0,97 |
0,96 |
0,97 |
|
IECV = 0,01 to 0,09; PUC = 0,831; ECV = 0,051; ARPB = 0,784. |
|||||||
Internal construct validity
Table 5 presents the internal construct validity results of the ASEIQ, based on data from the second subsample (n = 1300). These values were drawn from the bifactor confirmatory factor analysis, which showed better fit than the other tested models. Since AMOS does not automatically generate average variance extracted (AVE) and composite reliability (CR), both were computed manually.
Convergent validity was supported, as all AVE values were above 0,50 (Owan, Emanghe et al., 2022), ranging from 0,55 to 0,92. This shows that each factor explained a sufficient share of its item variance. Internal consistency was also adequate, with CR values between 0,86 and 0,99, exceeding the 0,70 threshold.
Discriminant validity was examined using the Fornell–Larcker criterion (Fortuna, Modliński, 2021), which compares the square root of each factor’s AVE to its correlations with other factors. In Table 5, each bolded diagonal value is higher than the correlations in the same row or column. This confirms that the factors were clearly distinct within the ASEIQ structure.
Table 5
Evidence supporting the construct validity of the ASEIQ (n = 1300)
|
Factors |
AVE |
CR |
1 |
2 |
3 |
4 |
5 |
|
1. Self-regulation |
0,92 |
0,99 |
0,96 |
||||
|
2. Empathy |
0,86 |
0,97 |
0,03 |
0,93 |
|||
|
3. Self-awareness |
0,79 |
0,95 |
0,08 |
0,04 |
0,89 |
||
|
4. Social awareness |
0,66 |
0,91 |
0,00 |
–0,02 |
–0,08 |
0,81 |
|
|
5. Internal motivation |
0,55 |
0,86 |
0,07 |
0,07 |
0,00 |
0,04 |
0,74 |
Reliability
The ASEIQ showed strong reliability across subsamples, assessed using Cronbach’s alpha, McDonald’s omega, and Spearman–Brown split-half reliability. All indices ranged from 0,85 to 0,99 (Table 6), confirming high internal consistency. Self-regulation and empathy recorded the strongest omega values. These consistent results across methods and dimensions affirm the ASEIQ as a reliable tool for measuring emotional intelligence.
Table 6
Scale-level reliability coefficients of the ASEIQ
|
Sample |
Dimensions |
k |
α |
ω |
rtt |
|
Subsample 1 (n = 262) |
Self-awareness |
5 |
0,95 |
0,95 |
0,95 |
|
Self-regulation |
6 |
0,99 |
0,99 |
0,99 |
|
|
Social awareness |
5 |
0,91 |
0,91 |
0,90 |
|
|
Internal motivation |
5 |
0,86 |
0,86 |
0,87 |
|
|
Empathy |
5 |
0,97 |
0,97 |
0,96 |
|
|
Subsample 2 (n = 1300) |
Self-awareness |
5 |
0,96 |
0,96 |
0,96 |
|
Self-regulation |
6 |
0,99 |
0,99 |
0,99 |
|
|
Social awareness |
5 |
0,92 |
0,92 |
0,91 |
|
|
Internal motivation |
5 |
0,87 |
0,87 |
0,88 |
|
|
Empathy |
5 |
0,98 |
0,98 |
0,97 |
|
|
Subsample 3 (n = 1560) |
Self-awareness |
5 |
0,94 |
0,94 |
0,94 |
|
Self-regulation |
6 |
0,98 |
0,98 |
0,98 |
|
|
Social awareness |
5 |
0,90 |
0,90 |
0,90 |
|
|
Internal motivation |
5 |
0,85 |
0,85 |
0,86 |
|
|
Empathy |
5 |
0,97 |
0,97 |
0,96 |
Discussion
This study developed and validated the Academic Staff Emotional Intelligence Questionnaire (ASEIQ), a psychometric instrument designed to assess emotional intelligence (EI) among university lecturers in Nigeria. Grounded in a five-factor model, such as self-regulation, empathy, self-awareness, social awareness, and internal motivation, the ASEIQ aligns with Goleman’s framework (Goleman, 1995), which conceptualizes EI as an integration of personal and social competencies. Confirmatory factor analysis (CFA) revealed that a bifactor model, positing EI as both a general construct and domain-specific factor, provided the optimal fit. This finding corroborates prior research advocating bifactor approaches in EI measurement (Owan, 2023; Owan, Bassey, Ubi, 2023), enabling simultaneous evaluation of global EI and subcomponents to clarify their interrelationships (Fotopoulou et al., 2021).
The ASEIQ had robust psychometric properties, with high internal consistency across subsamples (Cronbach’s α = 0,87–0,94; McDonald’s ω = 0,89–0,95). These reliability indices exceed established thresholds, confirming that the tool is suitable for consistent EI measurement among Nigerian academics. This reliability mirrors findings from analogous EI instruments validated across diverse contexts (Bartroli et al., 2022; Hallit et al., 2023; Pérez-Escoda, López-Cassà, Alegre, 2021). The ASEIQ’s contextual adaptation to Nigeria’s academic environment is critical, given that EI is empirically supported to reduce occupational stress, strengthening collegial relationships, and improving teaching effectiveness. By addressing region-specific dynamics, this tool facilitates targeted investigations of EI’s impact on pedagogical quality and institutional leadership.
While primarily validated in Nigeria, the ASEIQ holds promise for cross-cultural adaptation in regions with similar educational challenges. Future studies should assess its generalizability by administering the tool in diverse sociocultural contexts, including other African nations and global settings. Such comparisons clarify whether the ASEIQ requires cultural modifications or retains universal applicability.
This study has three main limitations. First, although the ASEIQ was based on Goleman’s earlier model, it does not completely align with his updated version, which outlines four core domains: self-awareness, self-management, social awareness, and relationship management. Second, the study did not assess whether the ASEIQ can predict outcomes like teaching effectiveness or emotional competence. Further work is needed to test its practical use in education and related fields. Third, the ASEIQ was not compared with other recognised emotional intelligence tools, which limits confidence in its external validity and theoretical alignment.
Conclusions
The Academic Staff Emotional Intelligence Questionnaire (ASEIQ) provides a robust tool for examining the relationships among lecturers’ emotional intelligence (EI), teaching effectiveness, and professional performance in Nigeria. While initially validated within Nigerian academia, the ASEIQ’s methodological design enables cross-cultural adaptation. Future studies should assess its validity across diverse contexts to determine generalizability and facilitate cross-national comparisons of EI’s role in educational systems. Such research could inform global applications while advancing theoretical insights into cultural influences on EI. As a psychometrically sound instrument, the ASEIQ holds dual significance: (1) enhancing quality assurance in Nigerian higher education and (2) contributing to international scholarship on emotion-cognition interactions in academia. Further refinements could establish the ASEIQ as a key resource for global universities seeking to develop emotionally intelligent pedagogical practices and improve institutional outcomes.