Context and relevance. How loneliness is perceived, experienced, and expressed can vary significantly across cultures due to differences in social norms, values, and interpersonal expectations. Therefore, it is crucial to adapt measurement tools to reflect these cultural variations and ensure their relevance. In this regard, the De Jong Gierveld Loneliness Scale is a widely recognized tool for assessing loneliness. However, it requires cultural adaptation and validation to ensure it accurately measures loneliness in diverse cultural contexts. Objective. The study aims to evaluate the psychometric properties of the De Jong Gierveld Loneliness Scale, specifically examining its factor structure, reliability, and measurement invariance among university students in Vietnam and Russia. Methods and materials. A total of 242 Vietnamese and 216 Russian students completed the scale. Exploratory factor analysis and confirmatory factor analysis were conducted separately for each group to confirm the factor structure. Cronbach’s alpha assessed reliability, and measurement invariance testing determined whether the scale functioned equivalently across cultures. Latent profile analysis identified loneliness subgroups within each sample. Results. A two-factor structure (1) emotional loneliness and (2) social loneliness was confirmed in both groups. The scale showed configural (CFI = 0,953), metric (ΔCFI = 0,004), and scalar invariance (ΔCFI = 0,005) across groups, indicating measurement equivalence, though strict invariance was not supported (ΔCFI = 0,012). Latent profile analysis revealed distinct loneliness profiles which is a demonstration of the scale's ability to differentiate groups with different characteristics. Reliability was acceptable (αVietnam = 0,78; αRussia = 0,84). Conclusions. The adapted scale demonstrated good psychometric properties in Vietnamese and Russian.
General Information
Keywords:De Jong Gierveld Loneliness Scale, cross-cultural validation, psychometric properties, vietnamese and russian students, emotional and social loneliness
Acknowledgements. Thank you to the participants for participating in the study.
Received 27.03.2025
Revised 18.06.2025
Accepted
Published
For citation:Tran, T.C. (2025). Loneliness in vietnamese and russian students: scale validation and cross-cultural comparisons. Social Psychology and Society,16(3), 205–218. https://doi.org/10.17759/sps.2025160311
Loneliness is a common human experience in which one’s focus shifts from engaging with the external world to an intense awareness of one’s inner feelings of social disconnection. Although feelings of loneliness are a natural aspect of the human condition and can sometimes serve as a signal for the need to reconnect with others, they are not inherently detrimental to most people’s lives (Barjaková et al., 2023; Hawkley, 2022; Slobodchikov, 2005). In many cases, the transient experience of loneliness can be adaptive, prompting individuals to seek out social interactions and strengthen interpersonal bonds (Archer Lee et al., 2022; Gabriel et al., 2021; Pham & Pechеrkina). This adaptive role helps promote personal growth, emotional self-awareness, and the motivation to build meaningful relationships. However, when loneliness becomes chronic and unrelenting, it may interfere with daily functioning and overall well-being (Farrell et al., 2023; Hawkley, 2022). The pathological form of loneliness, characterized by persistent feelings of isolation and distress, was recognized as a significant public health concern in early research on social disconnection (Sheftel et al., 2024). People who experience chronic loneliness often struggle to maintain relationships, leading to feelings of exclusion and a lack of necessary emotional support (Christiansen et al., 2021). Scholars have noted that when loneliness becomes entrenched, it can lead to profound emotional suffering, diminished quality of life, and even impairments in cognitive and social functioning (Hawkley, 2022; Mansfield et al., 2021).
The literature on loneliness indicates that its underlying causes and manifestations are multifaceted. Various theoretical frameworks – including cognitive discrepancy theory, evolutionary perspectives, and active theory – have been proposed to explain why some individuals experience prolonged loneliness despite an apparent desire for social connection (Le & Quang Dao, 2024; Leontiev, 1987; McCarthy et al., 2025). These theories underscore the interplay between personal dispositions and environmental factors in the emergence of chronic loneliness (McCarthy et al., 2025). Seminal work in the field revealed that the core of loneliness lies in the discrepancy between desired and actual levels of social interaction. Weiss (1973) first articulated the dual dimensions of loneliness – emotional and social – highlighting how deficits in intimate connections and broader social networks can jointly contribute to the overall experience of isolation. Building on this foundation, subsequent research has proposed that adverse interpersonal experiences, such as social rejection or the loss of significant relationships, can trigger and exacerbate feelings of loneliness (Fardghassemi & Joffe, 2022; Pham & Pecherkina, 2024; Wang et al., 2022). These negative experiences may lead individuals to withdraw further, creating a self-reinforcing cycle in which isolation deepens over time (Kirwan et al., 2025; Wu et al., 2024).
Studies have reported that individuals who suffer from prolonged loneliness frequently exhibit signs of emotional dysregulation, reduced cognitive functioning, and a heightened vulnerability to stress, all of which can further impair social interactions (Grover, 2022; Mansfield et al., 2021; Yoo-Jeong et al., 2021). Moreover, loneliness can establish a vicious cycle in which the discomfort associated with isolation leads to avoidance of social contact, thereby reinforcing the very state that the individual seeks to escape (Lawrence et al., 2022; Wu et al., 2024).
In response to the growing recognition of loneliness as a critical psychological construct, researchers have developed a variety of instruments aimed at its measurement. Among these, the De Jong Gierveld Loneliness Scale (6-item) has gained prominence due to its brevity and strong psychometric properties, making it an efficient tool for assessing both emotional and social dimensions of loneliness (De Jong Gierveld & Van Tilburg, 2010).
In Russia, the cultural context and rapid socio-economic changes have been shown to influence the experience of loneliness in unique ways. Research indicates that factors such as war, economic instability, social fragmentation, and changing family structures contribute significantly to feelings of isolation among Russian populations (Naumova & Glozman, 2021). This complex interplay between external pressures and individual perceptions underscores the need for culturally sensitive measurement tools that can accurately capture the multidimensional nature of loneliness within the Russian context. In contrast, in Vietnam, traditional family values and a strong sense of community may play a pivotal role in shaping experiences of loneliness (Thi, 2024). Despite a collectivist culture that generally may promote social integration, rapid urbanization and generational shifts have led to emerging patterns of perceived isolation, particularly among younger populations. These cultural characteristics suggest that the same loneliness measurement instrument might function differently across these contexts, highlighting the importance of a thorough adaptation process to ensure its validity and reliability.
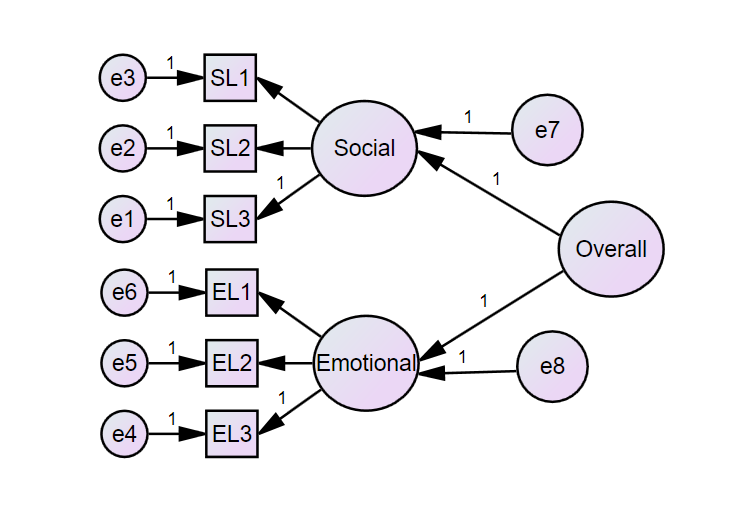
Fig. 1. Original Model of the Loneliness Scale
Given these cultural distinctions, the present study aims to adapt and rigorously test the psychometric properties of the De Jong Gierveld Loneliness Scale (6-item) in student samples from both Russia and Vietnam. By employing robust statistical techniques such as exploratory and confirmatory factor analyses, we intend to verify that the scale maintains its structural integrity and accurately reflects the dual dimensions of loneliness across these diverse cultural settings. This research is expected to yield a culturally sensitive instrument that can serve as a reliable foundation for future investigations and interventions targeting loneliness in varied sociocultural environments.
Materials and methods
Participants
Participants were selected using convenience sampling from universities in both Vietnam and Russia. Inclusion criteria required participants to be enrolled in higher education and between the ages of 18 and 25. The study sample consisted of 458 university students, including 216 from Russia and 242 from Vietnam. The Russian sample comprised 66,7% females and 33,3% males, with a mean age of 20,55 years (SD = 2,37). The Vietnamese sample included 48,8% females and 51,2% males, with a mean age of 20,57 years (SD = 0,73). Regarding year of study, most participants were in their second or third year in both countries, though the proportion of first-year students was notably lower in the Vietnamese sample (1,2%) compared to the Russian sample (14,4%) (Table 1).
Procedure
The adaptation process for the De Jong Gierveld Loneliness Scale (6-item) (De Jong Gierveld & Van Tilburg, 2010) followed a standardized procedure to ensure both semantic and conceptual equivalence across the Russian and Vietnamese versions, modeled after established guidelines (Beaton et al., 2000). Initially, the original English version of the scale was independently translated into Russian and Vietnamese by two bilingual translators for each language, whose native languages were Russian and Vietnamese, respectively. These forward translations were then merged into a single preliminary version for each language by the translators in collaboration with a project manager. Subsequently, the merged versions were independently backtranslated into English by two native English speakers fluent in Russian and Vietnamese. All translated versions were carefully reviewed by an expert committee consisting of a psychologist from each country.
Instrument
Loneliness was measured using the six-item version of the De Jong Gierveld Loneliness Scale, which assesses both emotional loneliness (three items) and social loneliness (three items). Each item is rated on a 4-point Likert scale, ranging from 1 (never) to 4 (always), with higher scores indicating greater loneliness. This shortened version has demonstrated good internal consistency and strong validity in various cultural contexts (De Jong Gierveld & Van Tilburg, 2010).
Data Analysis
Descriptive statistics were computed for all variables (in SPSS 22.0). Internal consistency was assessed using Cronbach’s α, where values > 0,70 indicate satisfactory reliability (Izah et al., 2024). Corrected item-total correlations were calculated. Confirmatory factor analysis was conducted using diagonally weighted least squares estimation to assess the factor structure of the loneliness scale (in AMOS 16.0). The model fit was evaluated using comparative fit index (CFI > 0,900), Tucker–Lewis index (TLI > 0,900), root mean square error of approximation (RMSEA < 0,08), and standardized root mean square residual (SRMR < 0,08 (Ximénez et al., 2022). A two-tailed independent samples t-test with a 95% confidence level (α = 0,05) was conducted to compare levels of loneliness between the Russian and Vietnamese participant groups. To assess the measurement invariance of the loneliness scale between Vietnamese and Russian student groups, a multi-group confirmatory factor analysis was conducted following a sequential approach. First, configural invariance was tested to examine whether the factorial structure was equivalent across groups. Next, metric invariance was assessed by constraining factor loadings to be equal between groups. Then, scalar invariance was evaluated by additionally constraining item intercepts to be equal. Finally, if appropriate, strict invariance was tested by constraining residual variances to equality. Model fit indices such as CFI, TLI, RMSEA, and SRMR were examined at each step, and change in CFI (ΔCFI ≤ 0,01) was used to determine whether imposing constraints significantly worsened model fit (Tan & Pektaş, 2020). Meeting these criteria supports that the scale functions equivalently across groups, ensuring meaningful cross-group comparisons. Latent profile analysis was used to classify participants into distinct subgroups based on loneliness scores (in Jamovi). The optimal number of classes was determined using Akaike information criterion (AIC), Bayesian information criterion (BIC), and entropy. Lower AIC and BIC values indicated better model fit, while entropy values closer to 1 suggested high classification accuracy.
Results
A comparison between Vietnamese and Russian students revealed significant differences in emotional and social loneliness levels. Vietnamese students scored significantly higher in emotional loneliness (M = 7,43, SD = 2,02) than Russian students (M = 6,43, SD = 2,23, p < 0,001). Similarly, Vietnamese students also reported higher social loneliness scores (M = 7,43, SD = 2,16) compared to their Russian counterparts (M = 6,84, SD = 2,40, p = 0,006). The total loneliness score was also higher among Vietnamese students (M = 14,86, SD = 3,47) than Russian students (M = 13,28, SD = 4,10, p < 0,001) (Table 2).
Table 1
Sample Characteristics by Country
Variable
Russia (n = 216)
Vietnam (n = 242)
Sex
- Female
144 (66,7%)
118 (48,8%)
- Male
72 (33,3%)
124 (51,2%)
Age
M = 20,55, SD = 2,37
M = 20,57, SD = 0,73
Year of Study
- 1st year
31 (14,4%)
3 (1,2%)
- 2nd year
93 (43,1%)
129 (53,3%)
- 3rd year
65 (30,1%)
79 (32,6%)
- 4th year
27 (12,5%)
31 (12,8%)
Note. N = 458; MAge = 20,56; SDAge = 1,71.
Table 2
Descriptive Statistics and T-test Results for Study Variables and Indicators
Variable / Indicator
Vietnam*
Russia*
p
Emotional Loneliness
7,43 ± 2,02
6,43 ± 2,23
<,001
I experience a general sense of emptiness [EL]
2,48 ± 0,89
2,32 ± 0,86
0,052
I miss having people around me [EL]
2,72 ± 0,79
2,09 ± 0,97
<,001
I often feel rejected [EL]
2,23 ± 0,80
2,03 ± 0,92
0,013
Social Loneliness
7,43 ± 2,16
6,84 ± 2,40
0,006
There are plenty of people I can rely on when I have problems [SL]
2,51 ± 0,84
2,31 ± 0,96
0,019
There are many people I can trust completely [SL]
2,57 ± 0,88
2,34 ± 0,90
0,007
There are enough people I feel close to [SL]
2,36 ± 0,83
2,19 ± 0,88
0,038
Overall Loneliness
14,86 ± 3,47
13,28 ± 4,10
<,001
Note. N = 458. EL = Emotional Loneliness. SL = Social Loneliness. T-test with 95% confidence intervals was applied. * = M ± SD.
Table 3
Exploratory and Confirmatory Factor Analysis
Viet Nam
Russia
Items
Factor
% of Variance
Factor
% of Variance
Social Loneliness
Emotional Loneliness
Social Loneliness
Emotional Loneliness
SL1
0,82
48
0,69
37
SL2
0,85
0,93
SL3
0,87
0,76
EL1
0,81
22
0,46
35
EL2
0,89
0,43
EL3
0,74
0,97
Cronbach's Alpha
0,81
0,75
0,85
0,75
Overal Cronbach's Alpha
0,78
0,84
Factors’ correlation
0,49***
0,48***
χ²
36
28
df
8
8
p-value
< 0,001
< 0,001
CFI
0,942
0,964
TLI
0,891
0,932
GFI
0,956
0,960
SRMR
0,048
0,044
RMSEA
0,121
0,105
Note. Extraction Method: Principal Component Analysis. ***. p < 0,001.
Exploratory and confirmatory factor analyses were performed separately for the Vietnamese and Russian student samples. Both analyses supported a two-factor structure corresponding to social loneliness and emotional loneliness. In the Vietnamese group, factor loadings for social loneliness items ranged from 0,82 to 0,87, explaining 48% of the variance, while emotional loneliness items had loadings between 0,74 and 0,89, accounting for an additional 22% of the variance. In the Russian group, social loneliness item loadings ranged from 0,69 to 0,93 (37% of the variance), and emotional loneliness item loadings ranged from 0,43 to 0,97 (35% of the variance) (Table 3).
Internal consistency was acceptable for both subscales, with Cronbach's alpha coefficients ranging from 0,75 to 0,85 across groups. The overall reliability of the scale was 0.78 in the Vietnamese sample and 0,84 in the Russian sample. The correlation between the two factors was moderate and significant in both groups (Vietnam: r = 0,49, p < 0,001; Russia: r = 0,48, p < 0,001), indicating related but distinct constructs.
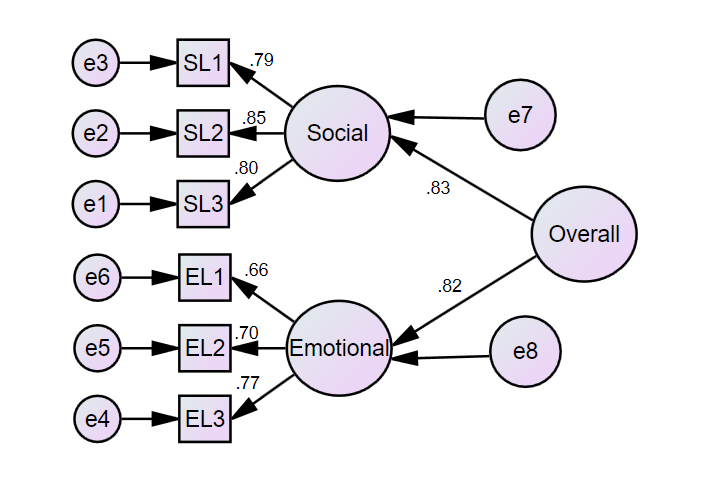
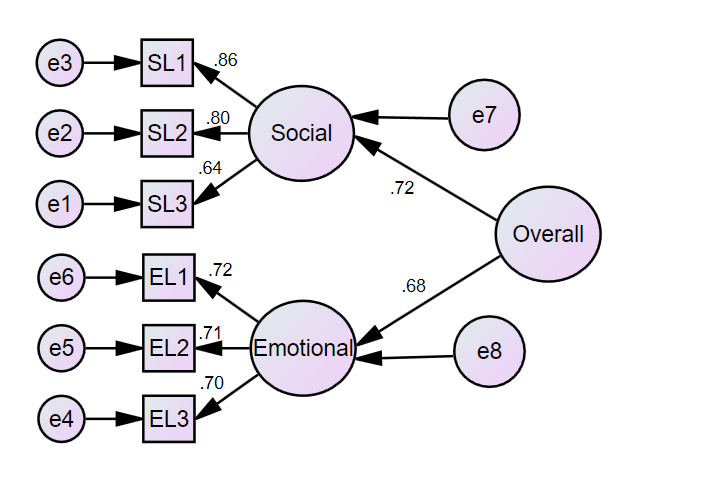
Confirmatory factor analysis indicated a good model fit in both samples. In the Vietnamese sample, the fit indices were: χ²(8) = 36, CFI = 0,942, TLI = 0,891, GFI = 0,956, SRMR = 0,048, RMSEA = 0,121. In the Russian sample, χ²(8) = 28, CFI = 0,964, TLI = 0,932, GFI = 0,960, SRMR = 0,044, RMSEA = 0,105 (Table 3, Figure 2, and Figure 3).
The results of the measurement invariance testing are presented in Table 4. The configural model demonstrated an acceptable fit (χ² = 63,06, df = 16, CFI = 0,953, RMSEA = 0,080), indicating that the factor structure was similar across groups. The metric invariance model, in which factor loadings were constrained to be equal, also showed acceptable fit (ΔCFI = 0,004), suggesting that the relationships between observed variables and their latent constructs were equivalent across groups. The scalar invariance model imposed additional constraints on item intercepts. Although there was a slight decline in model fit (ΔCFI = 0,005), it remained within the acceptable threshold (ΔCFI ≤ 0,01) (Tan & Pektaş, 2020), indicating that participants from different groups interpreted the items similarly in terms of level. However, when testing the strict invariance model the model fit deteriorated more notably (ΔCFI = 0,012), exceeding the recommended cutoff (ΔCFI ≤ 0,01) (Tan & Pektaş, 2020). This suggests that strict invariance may not hold across groups. Taken together, these results support configural, metric, and scalar invariance, allowing meaningful group comparisons at the latent mean level, while strict invariance was not established.
Table 4
Measurement Invariance Testing Across Groups
Model
χ²
df
CFI
RMSEA
Δχ²
Δdf
ΔCFI
Configural invariance
63,06
16
0,953
0,080
–
–
–
Metric invariance
71,20
20
0,949
0,075
8,14
4
0,004
Scalar invariance
77,62
21
0,944
0,077
6,42
1
0,005
Strict invariance
97,59
29
0,932
0,072
19,86
6
0,012
Note: Δχ² and ΔCFI indicate the change in chi-square and CFI compared to the less constrained model. ΔCFI ≤ 0,01 indicates acceptable invariance between models (Tan & Pektaş, 2020).
Fig. 2. Confirmatory Factor Analysis Model of the Loneliness Scale (Russian Sample)
Fig. 3. Confirmatory Factor Analysis Model of the Loneliness Scale (Vietnamese Sample)
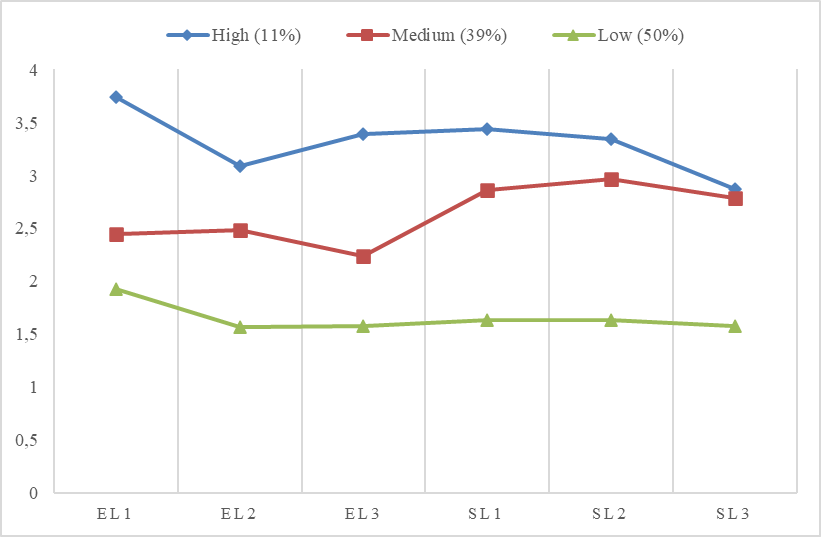
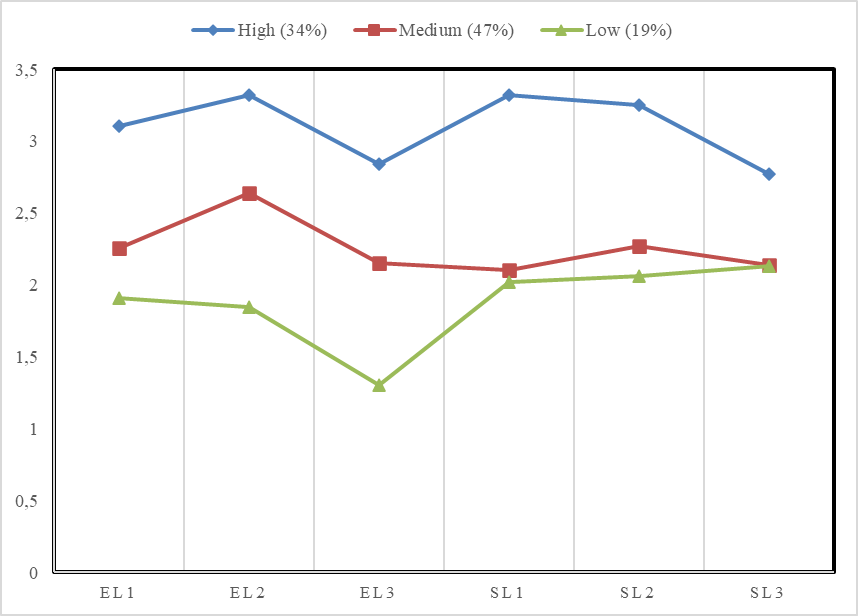
Table 5 and Table 6 presents the fit statistics for the two - to seven-class solutions in both the Vietnamese and Russian samples. Model fit indices showed consistent improvement up to the three-class solution, while the four-class solution resulted in decreased classification quality. These results indicated that the three-class solution provided the best fit to the data. In the Vietnamese sample, 34% of participants (n = 83) were classified into the high-loneliness profile, 47% (n = 113) into the moderate-loneliness profile, and 19% (n = 46) into the low-loneliness profile. Similarly, in the Russian sample, 11% (n = 23) were in the high-loneliness profile, 39% (n = 85) in the moderate-loneliness profile, and 50% (n = 108) in the low-loneliness profile (Figure 4 and Figure 5).
Fig. 4. Latent Profile Analysis Profiles for the Russian Sample
Table 5
Absolute model fit for Russian model
Class
Log-likelihood
AIC
CAIC
BIC
Entropy
df
G²
p
2
–1416
2906
3067
3030
0,90
178
958
< 0,001
3
–1337
2787
3032
2976
0,95
159
801
< 0,001
4
–1302
2755
3083
3008
0,92
140
731
< 0,001
5
–1249
2685
3097
3003
0,94
121
624
< 0,001
6
–1226
2677
3172
3059
0,95
102
578
< 0,001
7
–1216
2695
3273
3141
0,95
83
558
< 0,001
Note.N = 216.
Fig. 5. Latent Profile Analysis Profiles for the Vietnamese Sample
Table 6
Absolute model fit for Vietnamese model
Class
Log-likelihood
AIC
CAIC
BIC
Entropy
df
G²
p
2
–1327
2716
2855
2824
0,889
210
720
< 0,001
3
–1267
2628
2839
2792
0,846
194
601
< 0,001
4
–1228
2582
2864
2801
0,889
178
522
< 0,001
5
–1195
2549
2903
2824
0,903
162
457
< 0,001
6
–1165
2520
2946
2851
0,936
146
396
< 0,001
7
–1138
2498
2996
2885
0,935
130
342
< 0,001
Note.N = 242.
Discussion
The findings of this study provide a comprehensive evaluation of the psychometric properties of the adapted scale for assessing emotional loneliness and social loneliness, particularly within the context of Vietnamese and Russian student populations. Regarding the factorial structure of both versions, the findings suggest that the models for both the Vietnamese and Russian versions were consistent and adequately fit the data, similar to previous studies examining loneliness scales (De Jong Gierveld & Van Tilburg, 2010). Both scales exhibited acceptable factor loadings across groups. To assess potential differences in factor structure, we conducted a multi-group confirmatory factor analysis. The configural invariance model showed good fit which indicates that the overall factor structure was similar across groups. However, minor variations were observed in individual factor loadings (e.g., SL1 = 0,82 in Group A vs. 0,69 in Group B), suggesting slight differences in the strength of item-factor relationships. Despite these variations, the metric invariance model held (ΔCFI = 0.004), demonstrating that these differences were not statistically significant. Therefore, the scales maintained an equivalent factor structure across groups. This aligns with the notion that loneliness, though experienced differently across cultures, maintains similar underlying dimensions (De Jong Gierveld & Van Tilburg, 2010; Hawkley, 2022; Weiss, 1973). The absence of significant structural deviations across the versions suggests that the scale is robust and versatile enough for cross-cultural application.
Latent profile analysis results for both versions yielded three subgroups, but with slight variations in the distribution and characteristics of each group. In the Vietnamese version, a higher proportion of participants were classified as moderate-risk for loneliness. This pattern indicates that a substantial number of Vietnamese students perceive themselves as lacking sufficient social connection or emotional support. One possible explanation for this could be the rapid socio-cultural changes and urbanization occurring in Vietnam, which may disrupt traditional community structures and familial ties that have historically provided robust social support. Additionally, in collectivist societies, where the importance of interpersonal relationships and community belonging is emphasized, any perceived deficiency in these relationships might lead to more feelings of loneliness.
In contrast, the Russian version showed a relatively more even distribution between the moderate and low-risk groups. This may be due to cultural factors that promote individualistic coping strategies and provide access to supportive social networks and institutional structures that help alleviate loneliness. In addition, societal expectations regarding personal relationships and emotional expression in Russia might lead students to perceive or report lower levels of loneliness, even under similar conditions to those in other cultures. These findings highlight the need to consider cultural context when interpreting loneliness measures and suggest that interventions should be tailored accordingly. For example, strategies for Vietnamese students might focus on strengthening traditional social bonds and community networks that are being eroded by modernization, whereas interventions for Russian students could emphasize fostering individual resilience and alternative social support mechanisms.
Conclusions
This study demonstrated that both the Vietnamese and Russian versions of the loneliness scale exhibited robust psychometric properties, with clear structural validity and consistent fit across both samples. The scales were effective in capturing the underlying dimensions of loneliness, with all items fitting well within their respective domains. Latent profile analysis revealed three distinct subgroups, demonstrating the scale’s discriminative capacity to identify individuals with different patterns of loneliness. The findings also highlighted the cultural differences between the Vietnamese and Russian samples, further emphasizing the importance of considering cultural context in loneliness research. Overall, the results suggest that both versions of the loneliness scale are reliable, valid, and useful tools for assessing loneliness across different cultural settings.
Limitations. There are several limitations in this study. First, the research was conducted exclusively with adolescents, which limits the generalizability of the findings to other age groups, such as adults or the elderly, who may experience loneliness differently. Second, the data were collected through self-report questionnaires, which are subject to biases such as social desirability and memory recall biases, potentially affecting the accuracy of the responses. Third, the study focused on a sample from specific regions in Vietnam and Russia, and the findings may not necessarily reflect the experiences of adolescents in other areas of these countries or in other cultural contexts. Fourth, the data were gathered from educational settings, meaning that the sample may not be fully representative of adolescents who are not currently in school or those from different socio-economic backgrounds. The adapted scale demonstrated good psychometric properties in two culturally distinct university student samples. However, future research should consider expanding the scope to include broader age ranges, other underrepresented ethnic groups, and more diverse cultural settings to enhance the generalizability of the findings and explore the cross-cultural applicability of this scale.
References
Archer Lee, Y., Lay, J.C., Pauly, T., Graf, P., Hoppmann, C.A. (2022). The differential roles of chronic and transient loneliness in daily prosocial behavior. Psychol Aging, 37(5), 614–625. https://doi.org/10.1037/pag0000681
Beaton, D.E., Bombardier, C., Guillemin, F., Ferraz, M.B. (2000). Guidelines for the process of cross-cultural adaptation of self-report measures. Spine (Phila Pa 1976), 25(24), 3186–3191. https://doi.org/10.1097/00007632-200012150-00014
Christiansen, J., Lund, R., Qualter, P., Andersen, C.M., Pedersen, S.S., Lasgaard, M. (2021). Loneliness, Social Isolation, and Chronic Disease Outcomes. Ann Behav Med, 55(3), 203–215. https://doi.org/10.1093/abm/kaaa044
De Jong Gierveld, J., Van Tilburg, T. (2010). The De Jong Gierveld short scales for emotional and social loneliness: tested on data from 7 countries in the UN generations and gender surveys. Eur J Ageing, 7(2), 121–130. https://doi.org/10.1007/s10433-010-0144-6
Fardghassemi, S., Joffe, H. (2022). The causes of loneliness: The perspective of young adults in London's most deprived areas. PLoS One, 17(4), e0264638. https://doi.org/10.1371/journal.pone.0264638
Farrell, A.H., Vitoroulis, I., Eriksson, M., Vaillancourt, T. (2023). Loneliness and Well-Being in Children and Adolescents during the COVID-19 Pandemic: A Systematic Review. Children, 10(2).
Gabriel, A.S., Lanaj, K., Jennings, R.E. (2021). Is one the loneliest number? A within-person examination of the adaptive and maladaptive consequences of leader loneliness at work. Journal of Applied Psychology, 106(10), 1517–1538. https://doi.org/10.1037/apl0000838.
Grover, S. (2022). Loneliness Among the Elderly: a Mini Review. Consortium Psychiatricum,3(1), 30–36. https://doi.org/10.17816/CP143
Izah, S.C., Sylva, L., Hait, M. (2024). Cronbach's Alpha: A Cornerstone in Ensuring Reliability and Validity in Environmental Health Assessment. ES Energy & Environment, 23, 1057. https://doi.org/10.30919/esee1057
Kirwan, E.M., Luchetti, M., Burns, A., O'Súilleabháin, P.S., Creaven, A.-M. (2025). Loneliness trajectories and psychological distress in youth: Longitudinal evidence from a population-based sample. British Journal of Developmental Psychology, 43(1), 190–204. https://doi.org/https://doi.org/10.1111/bjdp.12533
Lawrence, D., Hunter, S.C., Cunneen, R., Houghton, S.J., Zadow, C., Rosenberg, M., ... Shilton, T. (2022). Reciprocal Relationships between Trajectories of Loneliness and Screen Media Use during Adolescence. Journal of Child and Family Studies, 31(5), 1306–1317. https://doi.org/10.1007/s10826-021-02066-3
Le, D.H., Quang Dao, P. (2024). Exploring the Emotional Pathway from Motivation to Facebook* Addiction in a Vietnamese Undergraduate Sample. Psychol Russ, 17(1), 100–115. https://doi.org/10.11621/pir.2024.0106
Leontiev, A.N. (1987). Activity, consciousness, and personality. Prentice-Hall Englewood Cliffs.
Mansfield, L., Victor, C., Meads, C., Daykin, N., Tomlinson, A., Lane, J., ... Golding, A. (2021). A Conceptual Review of Loneliness in Adults: Qualitative Evidence Synthesis. International Journal of Environmental Research and Public Health, 18(21).
McCarthy, J.M., Erdogan, B., Bauer, T.N., Kudret, S., Campion, E. (2025). All the Lonely People: An Integrated Review and Research Agenda on Work and Loneliness. Journal of Management, 01492063241313320. https://doi.org/10.1177/01492063241313320
Pham, Q.D., Pecherkina, A.A. (2024). How ghosting and stress impact vulnerable narcissism and maladaptive daydreaming: The role of mindfulness and rumination. Advance online publication. https://doi.org/10.1037/cns0000403
Pham, Q.D., Pechеrkina, A. Loneliness as a Motivating Factor for Maladaptive Daydreaming among Vietnamese Adolescents: The Role of Online Novel Reading. Psychology, Health & Medicine. https://doi.org/10.1080/13548506.2025.2486506
Sheftel, M.G., Margolis, R., Verdery, A.M. (2024). Loneliness Trajectories and Chronic Loneliness Around the World. J Gerontol B Psychol Sci Soc Sci, 79(8). https://doi.org/10.1093/geronb/gbae098
Tan, Ş., Pektaş, S. (2020). Examining the invariance of a measurement model by using the covariance structure approach. International Journal of Contemporary Educational Research, 7(2), 27–39. https://doi.org/10.33200/ijcer.756865
Thi, T.T.M. (2024). Involvement of Vietnamese elders in economic activities in the lens of family ties, low institutional coverage, and gender identity. International Journal of Asian Studies, 21(2), 284–303. https://doi.org/10.1017/S147959142300058X
Wang, Y., Warmenhoven, H., Feng, Y., Wilson, A., Guo, D., Chen, R. (2022). The relationship between childhood trauma and suicidal ideation, the mediating role of identification of all humanity, indifference and loneliness. Journal of Affective Disorders, 299, 658–665. https://doi.org/https://doi.org/10.1016/j.jad.2021.12.052
Weiss, R.S. (1973). Loneliness: The experience of emotional and social isolationThe MIT Press.
Wu, P., Feng, R., Zhang, J. (2024). The relationship between loneliness and problematic social media usage in Chinese university students: a longitudinal study. BMC Psychology, 12(1), 13. https://doi.org/10.1186/s40359-023-01498-4
Ximénez, C., Alberto, M.-O., Dexin, S., Revuelta, J. (2022). Assessing Cutoff Values of SEM Fit Indices: Advantages of the Unbiased SRMR Index and Its Cutoff Criterion Based on Communality. Structural Equation Modeling: A Multidisciplinary Journal, 29(3), 368–380. https://doi.org/10.1080/10705511.2021.1992596
Yoo-Jeong, M., Haardörfer, R., Holstad, M., Hepburn, K., Waldrop-Valverde, D. (2021). Is Social Isolation Related to Emotion Dysregulation and Retention in Care Among Older Persons Living with HIV? AIDS and Behavior, 25(1), 171–181. https://doi.org/10.1007/s10461-020-02957-4
Information About the Authors
Thuy C. Tran, Bachelor of Economics, Institute of Economics and Management, Ural Federal University named after the first President of Russia B.N. Yeltsin, Ekaterinburg, Russian Federation, ORCID: https://orcid.org/0009-0003-1400-1995, e-mail: thuychitran@mail.ru
Contribution of the authors
The author declare no conflict of interest.
Conflict of interest
The author declare no conflict of interest.
Ethics statement
All procedures performed in the study involving human participants were in accordance with the ethical standards of the institutional and/or national research committee and with the APA ethical standards.
Metrics
Web Views
Whole time: 319
Previous month: 19
Current month: 31
PDF Downloads
Whole time: 147
Previous month: 9
Current month: 18
Total
Whole time: 466
Previous month: 28
Current month: 49