Introduction
The problem of teacher shortage is currently relevant for most regions of the Russian Federation. A pertinent research direction is the study of factors influencing young people's choice of the teaching profession. This is evidenced by the increasing number of publications in recent years dedicated to both theoretical aspects of this problem and the results of empirical studies, which require a valid and reliable instrument.
However, a wide variety of methods are currently used for data collection: author-developed questionnaires (Bakina & Yaremtchuk, 2023; Korshunova & Beresneva, 2021); methods for studying academic motivation (Arkhipova et al., 2022); methods for studying the motivational-need sphere (Grushetskaya et al., 2024); tests of general professional readiness (Shchelina et al., 2024); and non-specific methods for choosing the teaching profession, reflecting motives for career choice in general (Moskalenko, 2024), career values (Kremen & Kremen, 2023), types of professional orientation (Dzhiga & Komarovskaya, 2023), and preferences in choosing a type of profession (Shchelina et al., 2024). This diversity of approaches to studying the factors behind the choice of the teaching profession does not allow for the generalization of data obtained by different researchers from different groups.
Meanwhile, in foreign psychology, the FIT-Choice ("Factors Influencing Teaching Choice") questionnaire has gained widespread recognition (Watt & Richardson, 2007). Long-term research results using this methodology are presented on the project page: http://www.fitchoice.org. The project has gained international recognition, with the methodology being tested in various countries: Albania (Agaj et al., 2023), Iran (Eghtesadi, 2021), Korea (Kim et al., 2021), Serbia (Simic et al., 2021), China (Wang et al., 2024), and others. Researchers emphasize the high validity of the FIT-Choice methodology. The objective of the present study is to examine the applicability of the FIT-Choice Scale for studying the factors behind the choice of the teaching profession in a Russian sample.
The FIT-Choice methodology is based on Social Cognitive Career Theory (SCCT) (Lent et al., 1994) and Expectancy-Value Theory (Wigfield & Eccles, 2000). The theory is based on concepts such as self-efficacy (an individual's beliefs about their abilities, a set of convictions related to specific performance indicators in an activity), expected outcomes (personal beliefs about the consequences of certain behaviors), and personal goals (the intention to engage in a specific activity or achieve a certain outcome). Expected outcomes are formed through diverse experiences of direct and observational learning (Lent et al., 1994).
Expectancy-Value Theory explains the reasons for choosing a particular activity: attainment value (the importance for a person to perform a task at a high level), intrinsic value (the enjoyment a person derives from performing a task), utility value (the awareness of the benefits gained from a particular choice of activity), and cost (the "price" to be paid for a particular activity choice, manifested in emotional and time expenditures, limitations, etc.) (Wigfield & Eccles, 2000). Research also shows that the choice of a professional path depends not only on the presence of certain values but primarily on the expectation of success that, in the students' opinion, will be achieved in the activity.
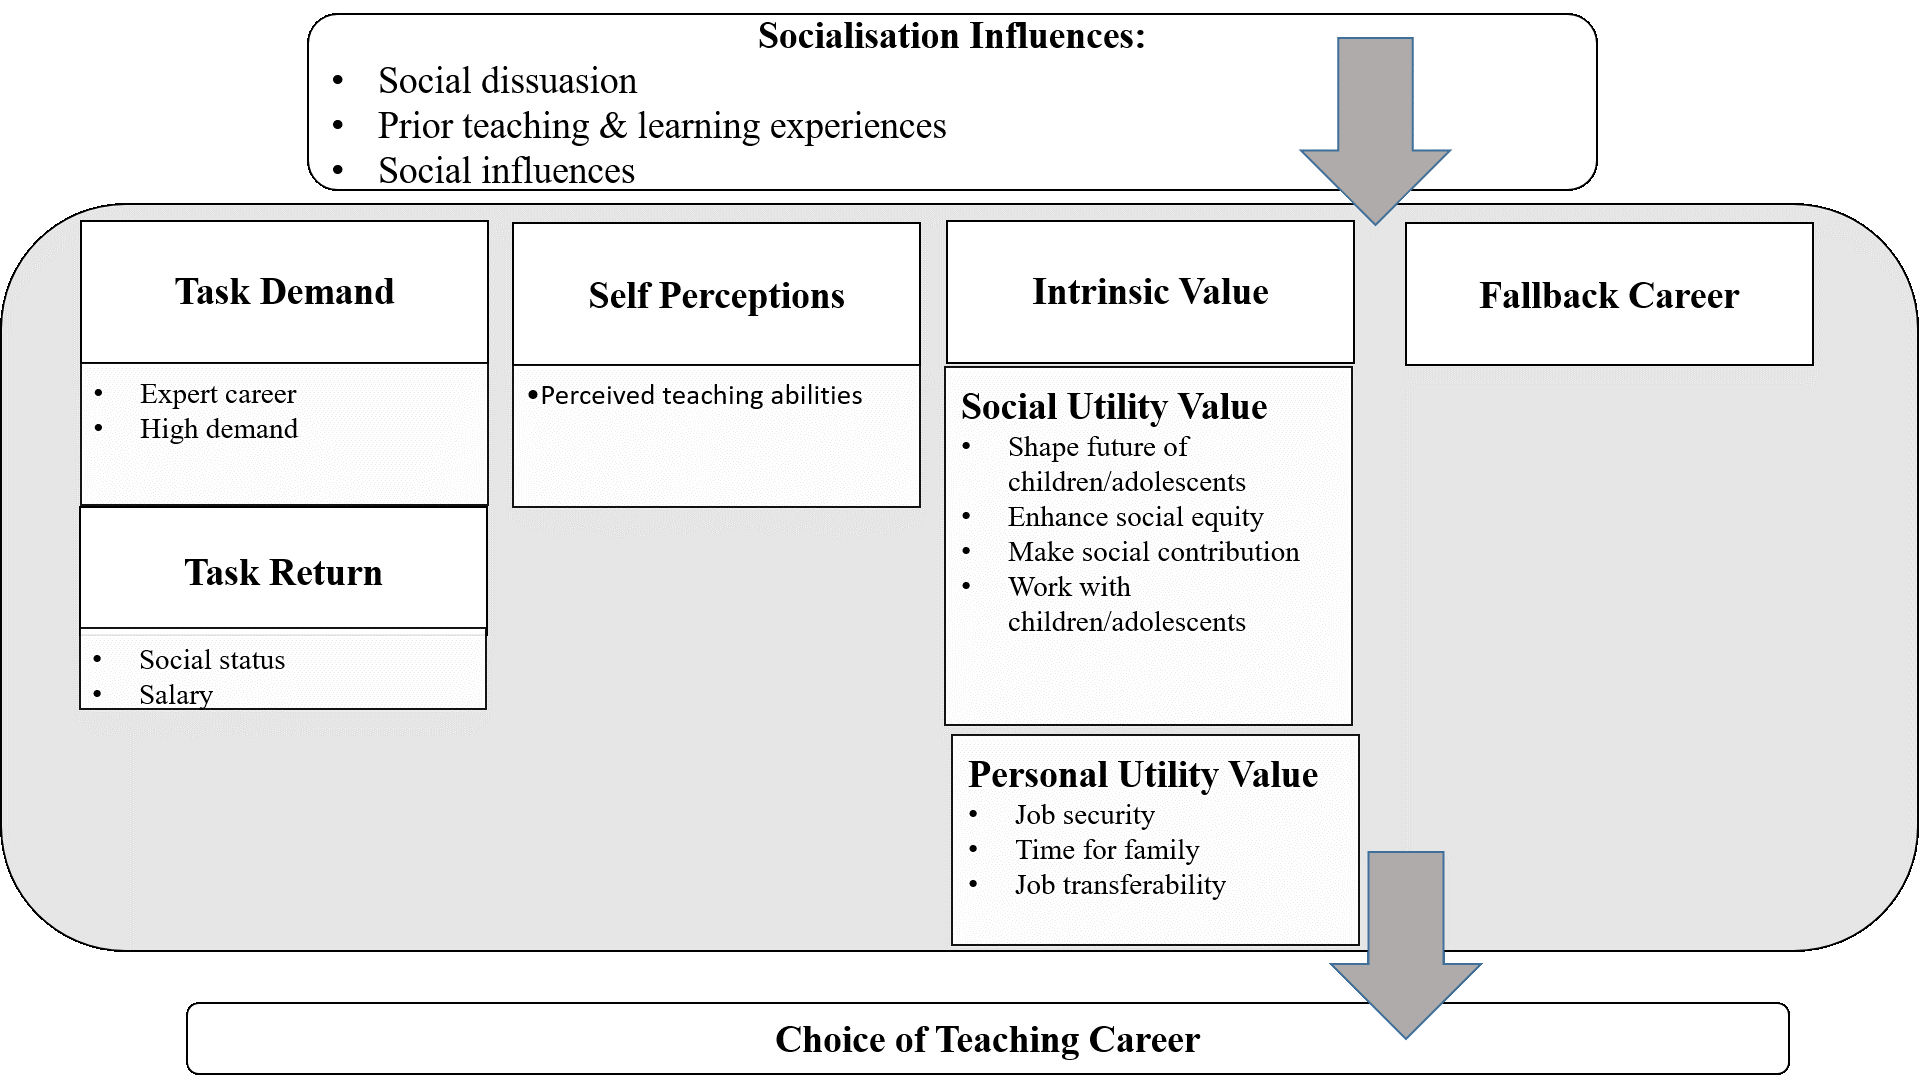
The structure of FIT-Choice (Watt & Richardson, 2012) includes the following blocks: social influences on career choice (positive learning experience in the role of a student, support for career choice by the social environment, dissuasion from others regarding the career choice); perception of task demand (the degree of difficulty and demand of the profession) and task return (social status, salary); intrinsic career value as interest in pedagogy and the desire to be a teacher; social utility value as the opportunity to influence the development of children and adolescents, enhance social justice, make a social contribution to societal development, and work with children and adolescents; personal utility value as the opportunity to spend time with family, the ease of finding a job, including when moving to another location; self-perceptions (perception of one's own abilities to teach children); and the motive of choosing teaching as a fallback career (Fig. 1).
Materials and methods
The English version of the FIT-Choice Scale questionnaire includes three parts of test items: B1-B54 (items directly assessing motives for choosing the teaching profession), C1-C15 (items reflecting respondents' opinions about the teaching profession), D1-D6 (items assessing the respondent's satisfaction with their choice of the teaching profession and negative reactions from their social environment). The original test comprised 58 items, with agreement with each rated on a seven-point scale.
The adaptation process of the FIT-Choice Scale questionnaire included the following stages: translation and pilot testing, assessment of item difficulty, examination of the questionnaire's factor structure, testing of internal consistency, validation, and construction of test norms.
Questionnaire translation was carried out independently by four psychologist proficient in English. The translated texts were compared, and the versions that best reflected the semantic content of the test items were selected. During translation, the last two parts (C and D) were combined under a common instruction for presentation. Items in part B were rated on a scale from 1 ("not at all important") to 7 ("extremely important"), and items in parts C and D were rated on a scale from 1 ("strongly disagree") to 7 ("strongly agree").
Pilot testing was conducted on a sample of 55 students pursuing education in the field 44.03.01 Pedagogical Education (bachelor's level) across different specializations. The testing aimed to check the correspondence of the proposed formulations to the students' ideas about the reasons that prompted them to choose the teaching profession. After filling out the questionnaire, students were invited to suggest changes to the wording of the methodology items if necessary. The absence of suggestions indicates the correctness of the translation and its relevance to the respondents' experience.
Subsequent stages of methodology standardization were carried out on a sample of 310 first- and second-year students, of which 75 were receiving secondary vocational pedagogical education (based on 9 years of schooling), 224 were studying in the bachelor's program field 44.03.05 Pedagogical Education with two specializations, and 11 were in the master's program field 44.04.01 Pedagogical Education (master's level). Data on the sample are presented in Table 1 and reflect the general distribution of students in a pedagogical university. The survey was conducted using Yandex Forms, where all questions were mandatory, and respondents were guaranteed confidentiality.
Table 1
Standardization Sample Characteristics (N = 310)
|
Level of Education |
gender |
% |
Average Age |
Training Profiles |
|
Secondary Vocational Education |
female |
93,4 |
16,9 |
Preschool Education, Primary School Teaching, Physical Education |
|
male |
6,6 |
16,6 |
||
|
Higher Education (Bachelor’s Degree) |
female |
78,9 |
19,4 |
Geography and Biology, Foreign Languages, History and Social Studies, Mathematics and Physics, Primary Education and Russian Language, Russian Language and Literature, Technology and Computer Science, Physical Education and Life Safety |
|
male |
21,1 |
19,8 |
||
|
Higher Education (Master’s Degree) |
female |
63,6 |
28,0 |
Innovative Technologies and Educational Design, Pedagogy and Educational Psychology |
|
male |
36,4 |
28,8 |
Assessment of item difficulty was carried out by calculating the difficulty index for each statement to exclude items with low discriminant power. The difficulty index (I) was calculated using the formula: I = M * 100 / 7, where M is the arithmetic mean for the item. To examine the factor structure of the questionnaire, principal component analysis (PCA) with Varimax rotation, performed in STATISTICA 10, and confirmatory factor analysis (PLS-SEM model), performed using SmartPLS 4, were used. Internal consistency was tested using the split-half method with Pearson's correlation coefficient and Cronbach's alpha. For validity testing, data from the obtained questionnaire scales were compared with T.I. Ilyina's "Motivation for University Studies" methodology (Pearson's rxy correlation). The final stage was testing the obtained scales for normality and constructing test norms using the quartile range.
Results
The assessment of item difficulty showed (Yaremtchuk et al., 2025) that most items possessed sufficient discriminant power; however, two items (C7 "Teaching requires great emotional strain" and C11 "Teaching is hard work") were excluded from the test, as the difficulty index (I = 87,8) indicated a high degree of student agreement with these statements.
The remaining test items were subjected to principal component factor analysis with Varimax rotation, resulting in the identification of 10 factors reflecting different groups of motives for choosing the teaching profession, collectively explaining 68,6% of the data variance.
The first factor explained 37,1% of the variance and integrated items from 5 scales of the English version: "Teaching Abilities," "Intrinsic Career Value," "Work with Youth," "Shape Future of Children/Adolescents," and "Make Social Contribution." The first two scales in the FIT-Choice model belong to the "Self-Perceptions" block, reflecting self-assessment of one's own abilities and desires. The combination of this block with scales from the "Social Utility Value" block in the factor structure indicates a less differentiated motivational structure for career choice among Russian students compared to data from other countries and may be related to the specifics of Russian culture, where individual self-perception is integrated with the assessment of one's capabilities and self-efficacy.
The second factor, explaining 6,2% of the variance, combined items from three scales related to part C (respondents' opinions about the teaching profession): "Expert Career" (C10, C14, C15), "High Demand" (C2), and "Social Status" (C5). The first two scales belong to the general block "Task Demand," while item C5 "Teachers are bearers of high moral values" apparently reflects the specifics of modern Russian education, where the perception of the teacher as a model of morality has transformed from an indication of high teacher status into demands placed on them by society.
Factor 3 (5,4% of the variance) also included items from block C, but related to students' perceptions of salary (C1, C3) and social status (C4, C8, C9, C12, C13) of teachers. The semantic combination of scales corresponds to the "Task Return" block in the theoretical model of the questionnaire and indicates the rewards attracting people to the profession.
Factors 4-8 (explaining 5,0%, 3,8%, 2,6%, 2,4%, and 2,1% of the variance) coincided in content with the English version of the methodology, combining items into the scales "Time for Family," "Social Dissuasion," "Prior Teaching and Learning Experiences," "Social Influences," and "Social Utility Value."
The last two factors explain 2% and 1,5% of the data variance. Factor 9 was the only one that included variables with both high positive and high negative loadings. At one pole of the factor were items reflecting students' satisfaction with their choice of the teaching profession (D1, D3, D5), and at the other — items where students agreed that they ended up in teacher education by chance, considering teaching as a "fallback career" (B11, B35). The mutual repulsion of these variables indicates that if the career choice was a fallback option, dissatisfaction with the made choice is high. Since the methodology focuses on career choice motives, we named this scale "Choice of Teaching as a Fallback Career." When processing data, the values of items B11 and B35 are considered with direct values, and items D1, D3, D5 are inverted (R) into a reverse scale.
The tenth factor, combining items from the scales "Job Transferability" (B8, B45) and "Job Security" (B27), was named "Ease of Employment" by us. We believe this name better reflects the motivation of Russian students, unlike the foreign version, which is more focused on student mobility, their orientation towards frequent relocation, and movement both within one country and between countries.
Based on the factor analysis results, seven items with low factor loadings (B14, B20, B22, B31, B38, B48) or sufficiently high loadings on several factors simultaneously (B53) were excluded from the questionnaire.
To test the factor structure of the methodology, confirmatory factor analysis (PLS-SEM model) was used, performed with the SmartPLS 4 program, which showed the following model fit indices: SRMR = 0,074; RMSEA = 0,078; CMIN/df = 2,892; Chi-square = 3603,978; IFI = 0,82; NFI = 0,711; CFI = 0,818; PNFI = 0,689, PCFI = 0,753. The use of Cronbach's alpha coefficient reflects the consistency of items within the obtained questionnaire scales (Table 2).
Table 2
Cronbach’s Alpha values for the FIT-Choice subscales
|
Factor |
Subscales |
Cronbach's alpha |
|
F1 |
Self Perceptions |
0,950 |
|
F2 |
Task Demand |
0,838 |
|
F3 |
Task Return |
0,889 |
|
F4 |
Time for family |
0,855 |
|
F5 |
Disuasion social |
0,792 |
|
F6 |
Положительный опыт обучения в роли ученика / Prior teaching and learning experiences |
0,844 |
|
F7 |
Social influences |
0,855 |
|
F8 |
Social Utility Value |
0,910 |
|
F9 |
Fallback Career |
0,322 |
|
F10 |
Job transferability |
0,817 |
As a result, we obtained the following factor structure of the questionnaire (see Fig. 2).
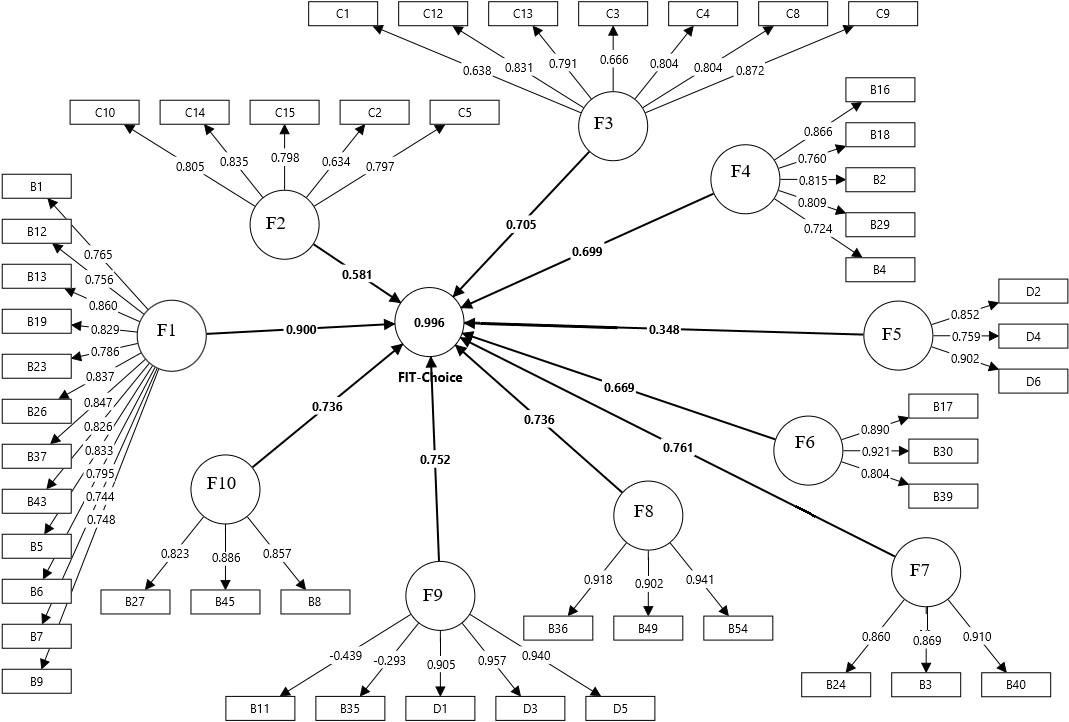
In the final version, we retained 49 items (Appendix), divided into two parts requiring different instructions. Since calculating scale scores involves a general summation of points for items belonging to different parts, continuous numbering of items, common to part 1 and part 2, was used.
Internal consistency of the questionnaire was tested using the split-half method, dividing the test into two parts consisting of items with even and odd numbers. Consistency was checked using Pearson's correlation coefficient and Cronbach's alpha (Table 3). The calculations indicate a high degree of internal consistency of the methodology.
Table 3
Reliability metrics for the FIT-Choice Scale subscales
|
Statistical Criteria |
Coefficient |
|
rxy-Pearson |
0,915 |
|
Cronbach's alpha |
0,933 |
To test the validity of the questionnaire, the data obtained with it were compared with T.I. Ilyina's "Motivation for University Studies" methodology (Table 4). Correlation analysis shows significant relationships for almost all scales at p ≤ 0,01, indicating the sufficient validity of the methodology.
Table 4
Correlations between FIT-Choice Scale subscales and Ilyina’s Motivation Inventory (rxy-Pearson)
|
FIT-Choice Scale Subscales |
Ilyina’s Motivation Inventory |
||
|
Knowledge Acquisition Motivation |
Professional Mastery Motivation |
Diploma Obtainment Motivation |
|
|
Self Perceptions |
0,406** |
0,538** |
0,238** |
|
Task Demand |
0,307** |
0,102 |
0,224** |
|
Task Return |
0,278** |
0,426** |
0,292** |
|
Time for family |
0,252** |
0,384** |
0,227** |
|
Disuasion social |
0,191** |
0,217** |
0,105 |
|
Prior teaching and learning experiences |
0,182** |
0,295** |
0,168** |
|
Social influences |
0,323** |
0,409** |
0,184** |
|
Social Utility Value |
0,313** |
0,393** |
0,176** |
|
Fallback Career |
–0,374** |
–0,601** |
–0,231** |
|
Job transferability |
0,276** |
0,425** |
0,292** |
** – p ≤ 0,01.
Testing the scales for normality showed a predominant non-compliance of the obtained distributions with the normal distribution, most often with a pronounced right-sided asymmetry. In this regard, the quartile range was used to construct primary norms for the scales.
Discussion
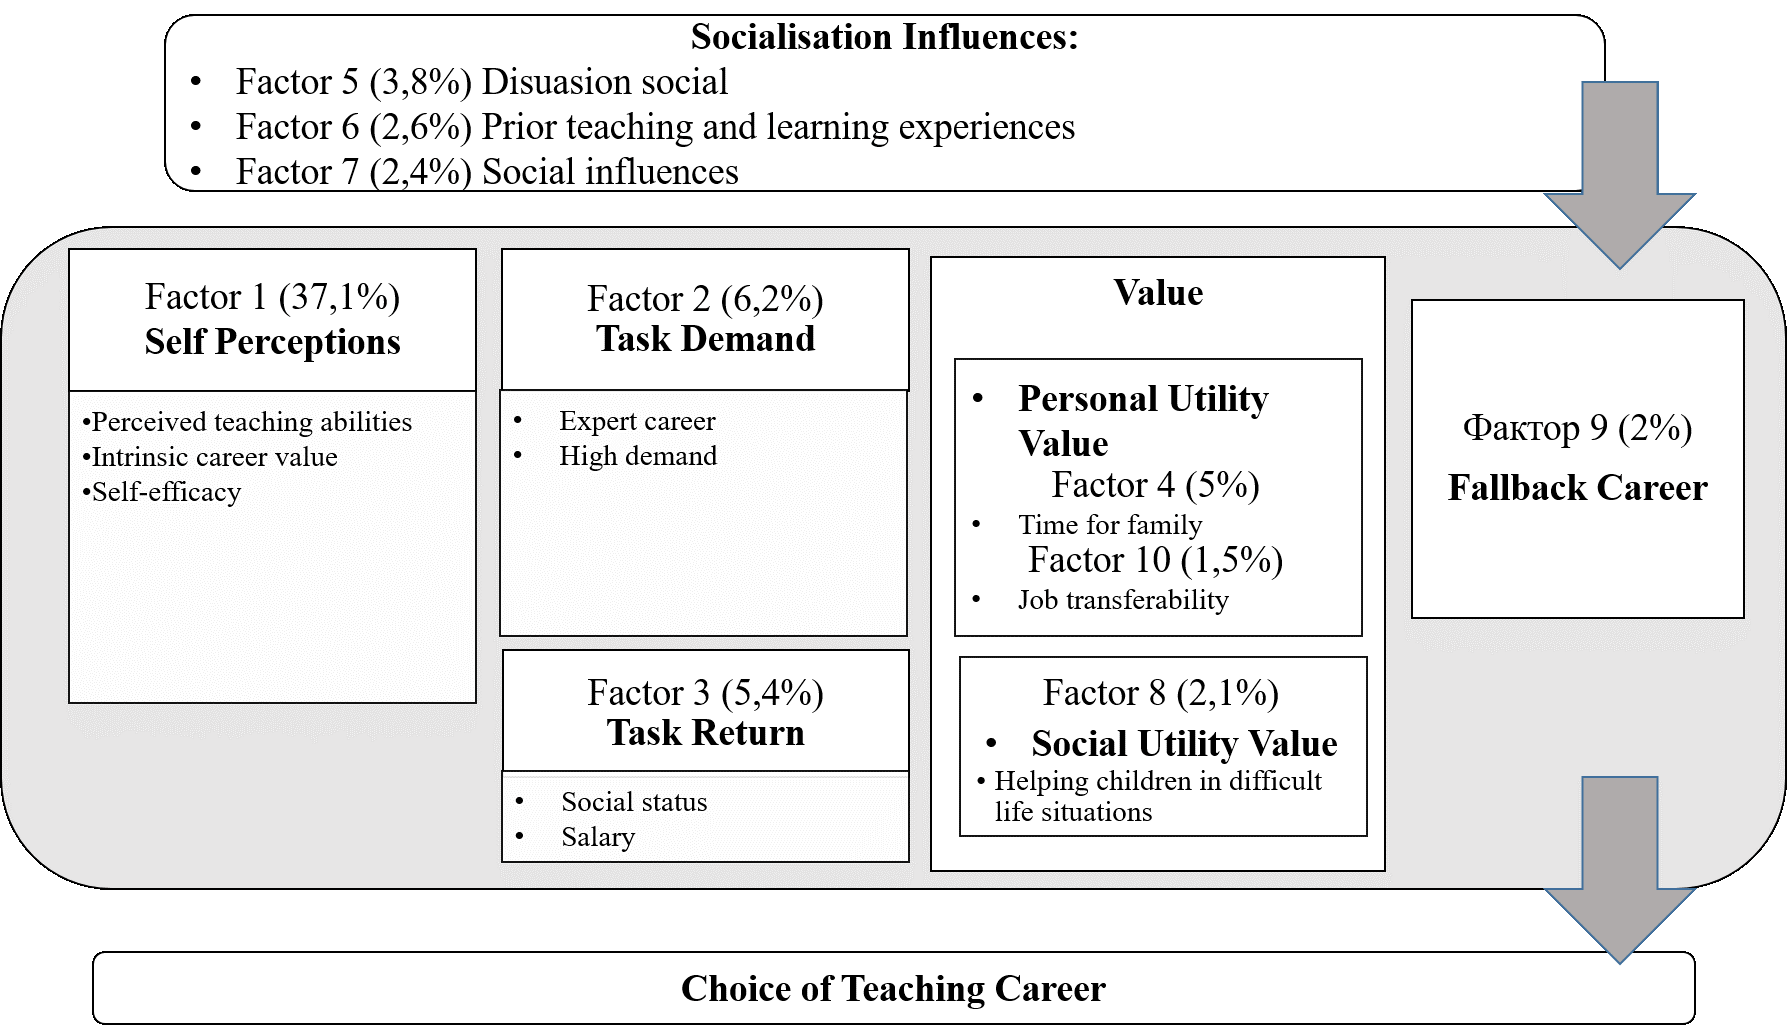
As a result of the testing, a number of test items were excluded from the methodology due to their low discriminant power and weak contribution to the substantive load of the factors. The questionnaire retained 49 out of 58 items from the version taken for adaptation. The obtained results show that instead of the 18 scales of the original methodology, grouped into six blocks, only 10 factors are identified in the Russian sample (self-perceptions, task demand, task return, time for family, social dissuasion, prior teaching and learning experiences, social influences, social utility value, fallback career, ease of employment), constituting a general scale of motivational orientation towards pedagogical activity. At the same time, the obtained factors correspond to the theoretical model of the FIT-Choice Scale (Fig. 3) and can be logically divided into corresponding semantic groups.
The methodology showed high internal consistency of scales and items and sufficiently high validity.
Descriptive statistics data (Yaremtchuk et al., 2025) indicate that for Russian students, the most significant guideline in choosing the teaching profession is the task demand (high professionalism and expert knowledge, high psycho-emotional load, high personal requirements), and important motivating factors are positive learning experiences in the role of a student, anticipation of ease of employment, and self-perception as capable of pedagogical activity, interested in this field, and believing in their ability to be successful in this activity and influence others through it. The least common among the surveyed sample was the choice of teaching as a fallback career. Our data are consistent with the results identified using the FIT-Choice Scale in other countries, while having their own specifics. According to our data, students pursuing a teaching profession perceive it as a profession with high demands and are motivated primarily by their positive learning experiences.
Conclusion
The materials presented in this article show that the FIT-Choice Scale ("Factors Influencing Teaching Choice"), widely used in foreign research, has confirmed its suitability for the Russian sample, demonstrating high internal consistency and validity.
At the same time, the internal factor structure of the methodology turned out to be more concise compared to foreign counterparts: out of 18 scales of the original methodology, 10 were retained in the Russian version, and some items were excluded from the questionnaire due to their insufficient discriminant power or low factor loadings. The resulting version of the methodology contains two parts, which include a total of 49 items.
The overall structure of the methodology corresponds to the theoretical model of the FIT-Choice questionnaire, making it possible to compare data obtained with the questionnaire with data obtained in other countries. The availability of norms for the Russian sample makes it possible to compare data obtained in different regions of the country and take the results into account when developing policies to attract young people to the teaching profession.
At the same time, testing the methodology on a sample of working teachers is required, which may result in a modified version that allows identifying the factors that keep teachers in the profession.
Limitations. The limitations of this study include the unequal representation of different genders and educational levels within the standardization sample. This constraint is partially mitigated by the fact that the respondent distribution reflects the demographic composition of a specific pedagogical university's student body. However, it does not allow for differentiating the motivation of students across diverse strata. Furthermore, the structure of motivation may exhibit regional specificity, necessitating an expansion of the study's geographical scope. Another limitation is the absence of test-retest reliability assessment for the instrument.