Introduction
Adolescence is one of the most critically important periods of development, during which a multitude of cognitive, psychological, physiological, and social changes converge, creating a unique social situation of development. Many psychologists and educators note a decline in interest in the educational process, the emergence of a new system of relations with adults and peers, and the development of a new "self-image" (Vygotsky, 1931; El'konin, 1971). This period is also often characterized by emotional instability, the onset of anxiety disorders, and a surge in behavioral problems (Lin, Guo, 2024; Briggs, 2009; Podol'skii et al., 2011). The problems an individual encounters in adolescence can have long-term consequences not only for their school life but also influence later life events: career choice, family, and well-being in adulthood (Sigurdson et al., 2015; Jonsson et al., 2011; Schlack et al., 2021). This is precisely why many researchers strive to identify factors associated with the emergence of difficulties and problems in a child's school life, in order to develop appropriate strategies for prevention or intervention.
Research on child mental development reveals complex interrelationships between cognitive, emotional, behavioral, and social factors. To account for the multifaceted nature of the relationships between these characteristics and academic achievement, researchers increasingly turn to a person-centered approach, as opposed to a variable-centered approach. While the variable-centered approach assumes that a sample or population can be described by average parameters, the person-centered approach treats the individual as the unit of analysis, not seeking to focus on a single aspect or characteristic, thereby providing researchers and practitioners with a deeper understanding of the social and psychological situation of development (Watt, Parker, 2020). The person-centered approach posits that the sample and/or population are heterogeneous and may consist of several subgroups, each with a unique set of parameters differently related to each other (Howard, Hoffman, 2017; Morin, Gagne, Bujacz, 2016).
Various methods can be used to identify such groups, with the most popular being Latent Profile Analysis (LPA) or Latent Class Analysis (Obersky, 2016). LPA is based on probabilistic modeling, making it a flexible tool for identifying latent homogeneous groups based on a set of characteristics of interest to the researcher (Howard & Hoffman, 2017). Furthermore, this approach allows for assessing the uncertainty in classifying each group. The algorithm finds the optimal number of groups and assigns each observation a probability of belonging to one of them. The result is a set of latent profiles (classes), each with a unique pattern of characteristics.
Previous research on psychological characteristics of schoolchildren using latent profile analysis has revealed heterogeneity within populations in terms of the severity of various characteristics and their interrelationships. For example, a study of sixth-grade students in Brazil identified seven latent profiles based on academic skills, assessment of behavioral problems, and social skills, which differed in levels of adaptation, social skills, and academic performance (Orpinas et al., 2014). Belonging to a specific profile (poorly adapted with low achievement) was a strong predictor of school exclusion. Another study in the USA also showed heterogeneity among students in terms of social and psychological school adaptation, identifying three latent profiles ("Well Adapted," "Low Adapted," "Moderately Adapted") (Mindrila, 2016). Interestingly, these groups were replicated across several age cohorts and were relatively stable over time, although the proportion of students in each latent class changed. Understanding the specifics of a latent group of learners allows for more targeted interventions for each group.
Research on Russian samples of schoolchildren has also demonstrated the promise of this approach for a deeper understanding of processes in middle and high school. In particular, a study of students in grades 6–8 regarding the severity of various types of engagement (behavioral, cognitive, emotional, and social) revealed several latent profiles of students that were consistently replicated across different grades (Morosanova & Potanina, 2024). It was shown that the general decline in engagement during the transition from 6th to 7th grade was related to a decrease in cognitive engagement, which may be explained by a decline in overall cognitive activity.
At the same time, it should be noted that we found a limited number of studies on Russian data that analyze latent student profiles, taking into account both academic performance and a broad set of psychological characteristics. Typically, analyses of psychological well-being or school performance are conducted within a variable-centered approach (e.g., analysis of predictors of school performance) (Tikhomirova et al., 2015). However, the person-centered approach allows for a broader picture of ongoing processes, considering the possible heterogeneity of the sample.
In light of the above, this study has two objectives:
- To identify and analyze latent profiles of students in grades 5–11 based on their academic performance, psychological well-being, cognitive characteristics, and physical condition.
- To assess changes in the distribution of latent profiles from grades 5 to 11.
Materials and methods
The study involved 1387 students in grades 5–11 from general education institutions in the Irkutsk region, aged 11 to 18 years (51% girls, mean age = 13,68 years, SD = 1,91). Digital psychodiagnostic tools were used for data collection. Students completed tasks in computer labs according to uniform protocols under the supervision of a member of the research team. The distribution by grade is presented in Table 1.
Table 1. Distribution by classes
|
Class |
Quantity (%) |
Averageage (st. deviation) |
|
5 |
279 (20%) |
11,28 (0,46) |
|
6 |
232 (17%) |
12,24 (0,47) |
|
7 |
267 (19%) |
13,32 (0,47) |
|
8 |
201 (14%) |
14,61 (0,71) |
|
9 |
216 (16%) |
15,27 (0,56) |
|
10 |
125 (9%) |
16,4 (0,49) |
|
11 |
67 (5%) |
17,33 (0,47) |
The following indicators were used to identify student groups:
- Body Mass Index (BMI).BMI was calculated based on weight and height (kg/m²).
- Daytime Sleepiness Index.The Pediatric Daytime Sleepiness Scale (Zakharov et al., 2023) was used. Higher scores indicate greater daytime sleepiness; participants scoring 16 points or more belong to the group with significant daytime sleepiness. In the total sample, 39% of students had scores above the norm.
- Cognitive Indicators:
Non-verbal intelligence. Raven's Progressive Matrices test was used. The test is divided into five blocks of 12 tasks each. One point is assigned for each correctly solved task, with a maximum possible total of 60.
b. Spatial reasoning. A test of spatial abilities and assessment of technical reasoning (Mechanical Reasoning, Ecipenko et al., 2018) was used. The test includes 16 items; 1 point is assigned for each correct answer (maximum = 16).
c. Vocabulary (Golovin, 2015). The test measures vocabulary size and is used for an express assessment of verbal intelligence (Maslennikova et al., 2017). The test consists of several blocks. In this case, scores from the first block were used. In this block, respondents are presented with words sequentially and must indicate whether they know the meaning. Fake words are included to check for guessing. The maximum score is 95. - Psychological Well-being:
For assessing emotional and behavioral problems in children and adolescents, the Strengths and Difficulties Questionnaire (SDQ) (Goodman, 2001) was used. The instrument has five 5-item scales: "Emotional Symptoms," "Conduct Problems," "Hyperactivity/Inattention," "Peer Relationship Problems," and "Prosocial Behavior." Validation and assessment of psychometric properties of the SDQ on a Russian sample were conducted by V. Ruchkin et al. (Ruchkin et al., 2007). The Russian version of the questionnaire was used (Ruchkin et al., 2007). The following SDQ scales were used in the analysis:
Emotional problems score. SDQ Emotional Problems scale, assessing emotional problems and heightened anxiety (max = 10).
b. Peer problems score. SDQ Peer Problems scale, assessing problems in peer relationships (max = 10).
For assessing life satisfaction, the Multidimensional Students' Life Satisfaction Scale (MSLSS) (Huebner, 1994) was used. The Russian version includes five subscales: family satisfaction, school satisfaction, teacher satisfaction, self-satisfaction, friend satisfaction (Sychev et al., 2018; Tabueva et al., 2024). The following scales were used in the analysis:
c. Family Satisfaction. MSLSS Family Satisfaction scale shows the degree of satisfaction with relationships with family members (max = 30).
d. School Satisfaction. MSLSS School Satisfaction scale assesses children's satisfaction with school life regarding support for their interests and general attitude towards school and learning (max = 30).
e. Self-Satisfaction. MSLSS "Self" scale is aimed at assessing the level of satisfaction with oneself and a positive self-attitude (max = 30). - Academic Performance:
Average grades (over 4 quarters) in Mathematics(grades 5–6) or Algebra and Geometry (grades 7–11).
g. Average grades (over 4 quarters) in Russian Language and Literature.
Data analysis
To identify groups of students based on their academic performance, psychological well-being, and cognitive characteristics, Latent Profile Analysis (LPA) (Muthén, 2001) was used. LPA is an exploratory technique, a type of latent variable modeling where the latent variables are discrete. An advantage of discrete latent models is that their distribution is estimated from the data rather than assuming a normal distribution. LPA implies the existence of "hidden" subgroups within the general sample, leading to a mixture of distributions across these latent groups.
LPA uses probabilistic mathematical modeling based on correlations between variables to identify probable groups and assign individuals to them. In the first stage, the algorithm tests different models with varying numbers of latent classes. Models differ not only in the number of latent classes but also in the type of covariance structures. Specifically, models can vary in whether variance of variables within classes is allowed to differ, whether correlations between variables are allowed, and whether cluster sizes can vary.
Based on the comparison of several statistical criteria, the model with the best fit indices was selected. These indices include: maximum log-likelihood, Bayesian Information Criterion (BIC), Integrated Complete-data Likelihood (ICL), and a measure of model uncertainty. ICL is calculated based on BIC but penalizes models with high uncertainty.
Before inclusion in the model, all variables except cognitive indicators were standardized relative to the sample mean (z-scores: [raw value – sample mean] / sample SD). To account for changes in cognitive scores from grade 5 to 11, they were standardized relative to the mean for the corresponding grade ([raw value – grade mean] / grade SD).
After selecting the best-fitting model, the obtained latent profiles were compared based on the mean values of the included variables. Then, the proportion of each latent profile was calculated for students in grades 5–11 separately for each grade.
The analysis was conducted in the R environment using the mclust package.
Results
The distribution of the variables included in the analysis is shown in Table 2.
Table 2
Indicators of variables included in the analysis
|
Indicators |
Average |
St. deviation |
25th percentile |
75th percentile |
|
BMI |
20,47 |
4,11 |
17,66 |
22,13 |
|
Daytime drowsiness index |
13,75 |
6,40 |
9 |
18 |
|
Nonverbal intelligence |
39,8 |
8,6 |
34 |
46 |
|
Spatial abilities |
8,4 |
2,6 |
7 |
10 |
|
Vocabulary |
52,9 |
18,2 |
40 |
65 |
|
Emotional problems |
3,15 |
2,63 |
1 |
5 |
|
Problems with peers |
2,95 |
1,92 |
1 |
4 |
|
Satisfaction with the family |
18,8 |
4,98 |
20 |
28 |
|
Satisfaction with the school |
23,9 |
5,02 |
15 |
23 |
|
Satisfaction with oneself |
22,4 |
5,25 |
19 |
27 |
|
Average mathematics points |
3,81 |
0,58 |
3,25 |
4,13 |
|
Average points in the Russian language and literature |
3,97 |
0,58 |
3,5 |
4,38 |
Spearman correlations between the selected indicators were examined (Fig. 1).
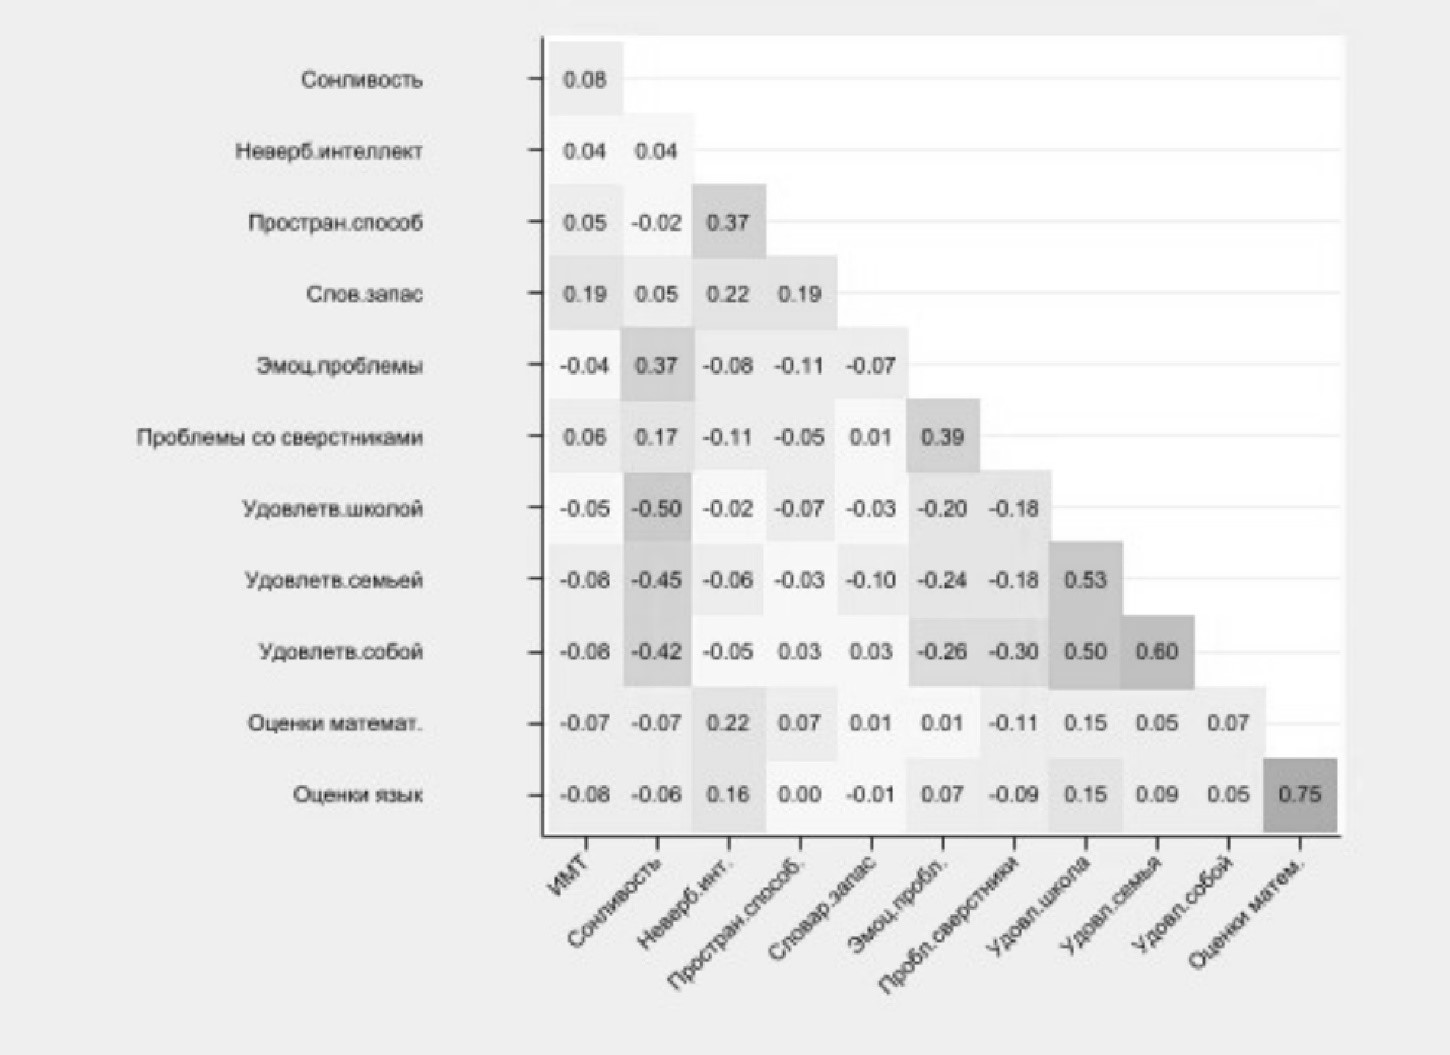
Analysis of correlations shows that BMI has no significant correlations with other indicators except a weak positive correlation with vocabulary. The daytime sleepiness index is negatively related to satisfaction indicators and positively related to the emotional problems scale.
Satisfaction indicators are strongly positively correlated with each other and moderately negatively correlated with problem indicators. Grades in mathematics and Russian language are positively related to nonverbal intelligence and school satisfaction.
Results of latent profile analysis of students
The model with 4 latent classes showed the best fit indices, where variables within each latent class are considered uncorrelated, and variables can have different variances (diagonal, varying volume and shape). The model indices are presented in Table 3.
Table 3
Model indicators based on the results of the analysis of latent profiles
|
log-likelihood |
BIC |
df |
ICL |
Степень неопределенности / The degree of uncertainty |
|
3625,9 |
6535,6 |
99 |
6422,97 |
0,03 |
The main characteristics of each latent profile can be described as follows:
Latent Profile 1 (159 observations, 11%):
- "Adequate Students without Difficulties"
- Cognitive indicator values are close to zero, indicating average cognitive abilities (relative to age norms).
- Average family satisfaction and below-average school satisfaction (the lowest among all profiles).
- No pronounced emotional or peer relationship problems.
- Grades in mathematics and language are also close to or slightly below average.
This is a group of adequately performing students without pronounced psychological difficulties, who are not very satisfied with school.
Latent Profile 2 (389 observations, 28%):
- "Successful and Content"
- High academic performance and high levels of cognitive abilities.
- Low levels of emotional problems and peer relationship problems.
- Low level of daytime sleepiness.
- High levels of family, school, and self-satisfaction.
This group of students is generally content with their lives, well-rested, and the most academically successful.
Latent Profile 3 (525 observations, 38%):
- "Overloaded Students"
- Slightly above-average BMI, high level of sleepiness, which may be a consequence of overload, stress, or lack of sleep.
- Very low indicators of school, family, and self-satisfaction.
- High indicators of emotional problems and peer relationship problems.
- Average grades in mathematics and language.
- Scores on cognitive tests are slightly below average for their age.
A group of students who manage academically but experience high levels of stress, fatigue, and dissatisfaction with their social environment.
Latent Profile 4 (313 observations, 23%):
- "Low-Achieving but Socially Adapted"
- Levels of family, school, and self-satisfaction are slightly above average.
- The lowest academic results.
- Levels of emotional problems and peer relationship problems are below average.
- The level of cognitive abilities is close to average.
A group of low-achieving students without significant adaptation or communication problems.
Figure 2 presents the indicators (z-scores) for the variables across the four latent profiles.
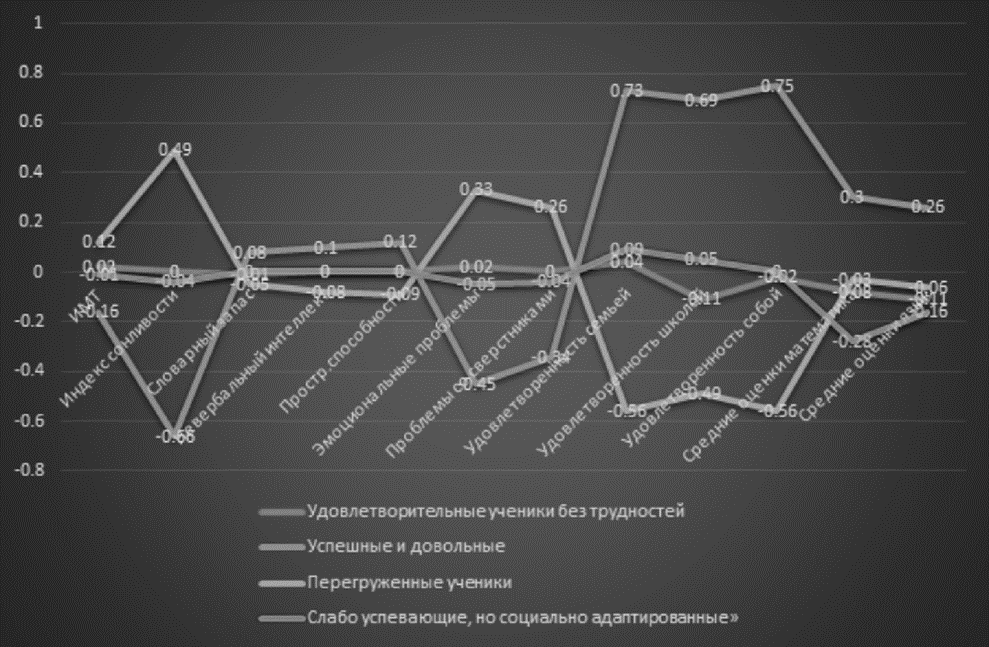
Fig. 2. Indicators of the average values of variables for four latent profiles
Next, we analyzed how the described latent profiles are distributed across grades (see Fig. 3).
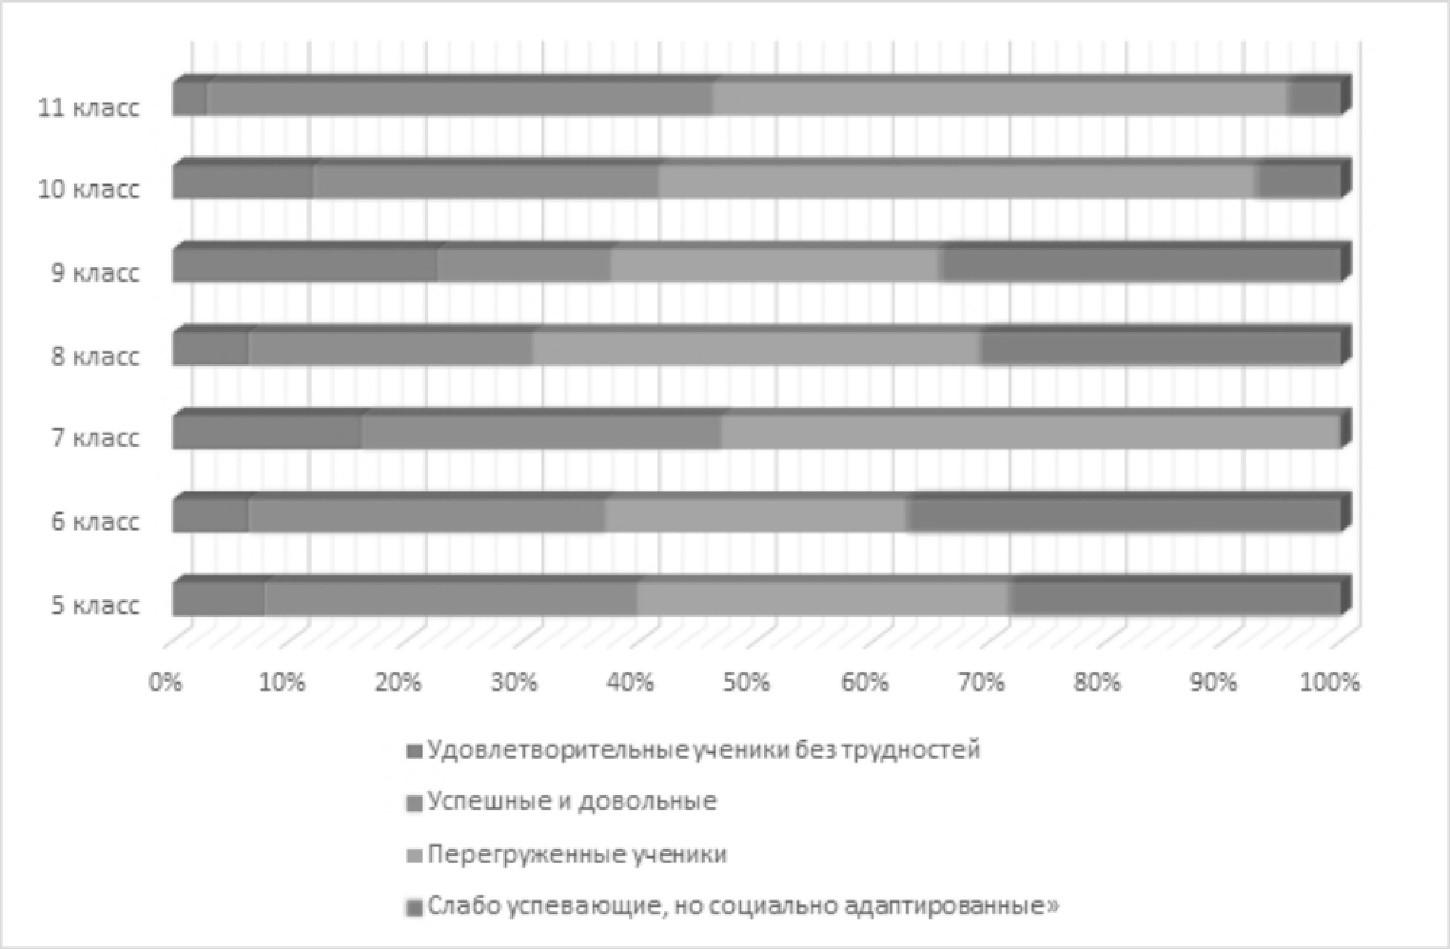
Thus, it can be seen that the proportion of students from each latent profile varies from grade to grade. In particular, the proportion of "Overloaded Students" (with average grades but low satisfaction and high problem levels) is highest in grade 7 (53%), and also in grades 10–11 (51% and 49%, respectively). Conversely, the proportion of "Successful and Content" students is highest in grade 11 (43%) and lowest in grade 9 (15%). Low-achieving but adapted students are more common in grade 6 (37%) and grade 9 (34%). It should also be noted that in grade 7, students with this latent profile were not identified.
Discussion of results
Based on indicators of psychological well-being, cognitive characteristics, as well as sleepiness index and BMI, four latent profiles of students in grades 5–11 were identified. The most numerous (38% of the sample) is the latent profile of "Overloaded Students," who generally have satisfactory average grades in mathematics and Russian language but report emotional and social problems, low satisfaction with school, family, and self, and have high daytime sleepiness. Half of the students in grades 7, 10, and 11 have this profile. The share of "overloaded students" is especially high in grade 7. The second most represented latent profile is "Successful and Content" (28% of observations). These are students with high grades, high scores on cognitive tests, high satisfaction indicators, and low levels of problems. The highest proportion of such students is in grade 11 – 43%. The lowest proportion of such students (only 15%) is in grade 9.
Attention should also be paid to students with the profile "Low-Achieving but Socially Adapted" (23% of observations). Such students have the lowest average grades compared to other profiles but do not experience significant psychological problems. The share of such students is particularly large in grade 6 (37%) and grade 9 (34%). Interestingly, in grade 7, students with this profile were not found. The least represented (only 11% of the sample) was the latent profile "Adequate Students without Difficulties." Students with this profile generally have satisfactory academic performance indicators and no particularly pronounced problems but have quite low indicators of school satisfaction. It should be noted that the analysis did not identify a separate group of students with low academic performance and low psychological well-being indicators. Possibly, the proportion of such schoolchildren is too small to form a separate latent profile. On the other hand, it is possible that these children did not participate in the study for various reasons.
The identified latent profiles allow us to look at the dynamics of psychological and emotional well-being from grades 5 to 11, considering a large number of parameters. It can be stated that grades 5–6 are relatively favorable, with a fairly high proportion of successful and adapted students. In grade 6, the share of low-achieving students without pronounced psychological problems increases. In all likelihood, the decline in academic performance does not yet affect psychological well-being at this age.
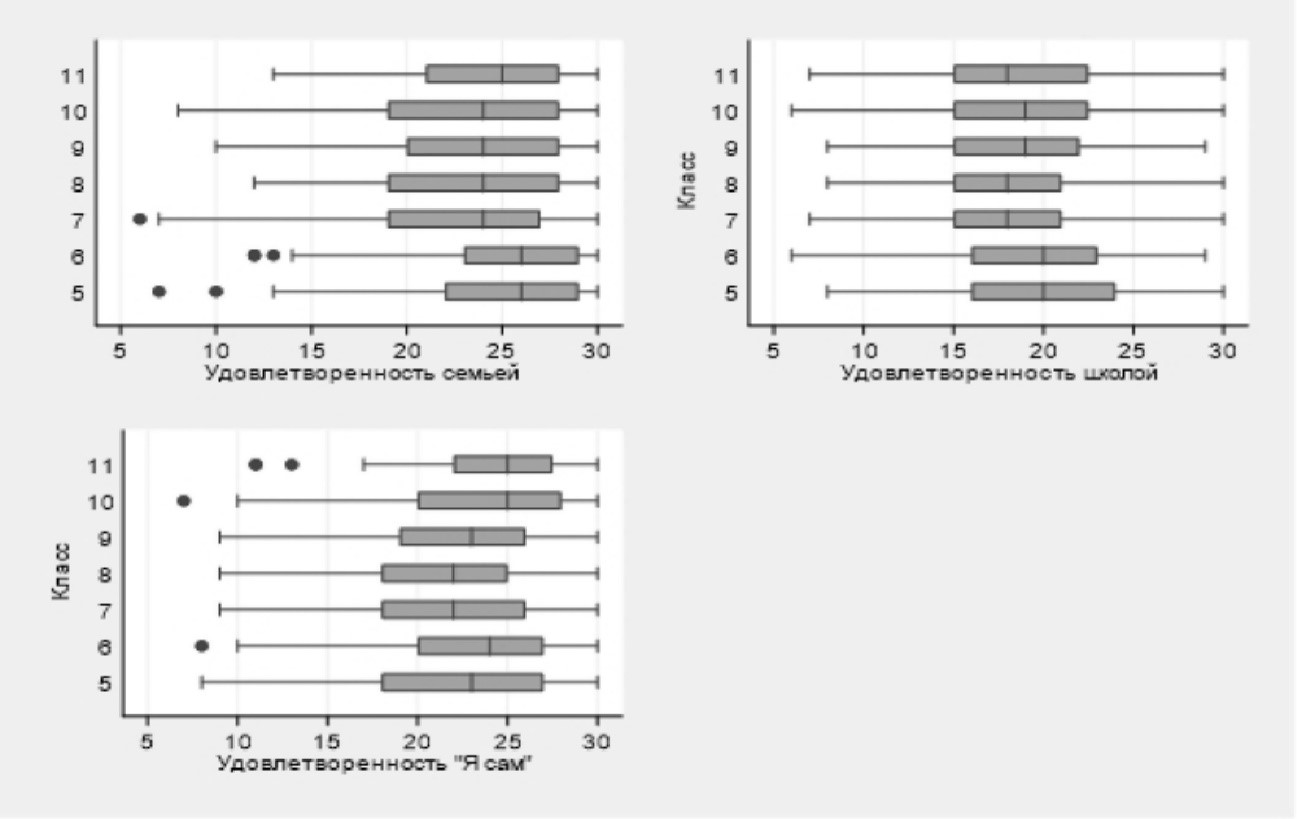
In grade 7, the picture changes; in many respects, grade 7 appears to be the most problematic. On the one hand, the proportion of "overloaded" students increases significantly. These students may demonstrate satisfactory academic performance but experience problems in both peer relationships and emotional state. It is in this grade that students show the lowest level of satisfaction with school, family, and self (Fig. 4).
On the other hand, students with the "Low-Achieving but Adapted" profile were not found in grade 7. Given the sharp increase in the proportion of "overloaded" schoolchildren, it is possible that those students who were in this profile in grade 6 may "move" to a less favorable profile in terms of psychological state in grade 7. Of course, the available data do not allow us to speak about dynamics in terms of individual trajectories of transition from one latent class to another; we can only hypothesize based on data on differences between grades.
In grade 8, the situation stabilizes, and the ratio of students of different profiles becomes approximately the same as in grade 6.
In grade 9, the situation changes again, as compared to previous grades, the proportion of "average students" increases, but the share of "successful students" decreases. This may be related to the increasing complexity of the school curriculum and the need to prepare for the State Final Attestation.
Grades 10 and 11 show a similar picture in terms of the representation of "overloaded students." Among students in these grades, the proportion of such "overloaded" students is very high and comparable to the situation in grade 7, although the reasons for this situation may be different. For example, analysis of changes in daytime sleepiness indicators revealed that it is in grade 10 that students have the highest average scores for daytime sleepiness (Fig. 5).
On the other hand, it can be seen that grades 10 and 11 differ in the representation of the "successful" profile, as in grade 11 the share of "successful" students is significantly higher than in grade 10. However, it should be noted that the sample of grade 11 students is small, and the situation may change with a larger sample.
Conclusion
Based on the analysis, the model with 4 latent profiles showed the best fit: Latent Profile 1 "Adequate Students without Difficulties" accounted for 11% (159 observations), Latent Profile 2 "Successful and Content" – 28% (389 observations), Latent Profile 3 "Overloaded Students" – 38% (525 observations), and Latent Profile 4 "Low-Achieving but Socially Adapted" – 23% (313 observations). The proportion of students in each latent profile varies from grade 5 to 11.
Regarding the choice of possible corrective or preventive measures, it can be noted that students in different latent profiles require different approaches. From the teachers' perspective, students from the "Low-Achieving but Adapted" profile may seem the most problematic. However, from the perspective of long-term consequences, the profile of "overloaded" students appears more "risky."
Furthermore, it is worth noting that the cognitive indicators of students in this profile are slightly lower than those of schoolchildren in the "low-achieving" profile, despite their higher academic performance. It can be assumed that maintaining relatively high academic performance may be quite costly for many students in terms of psychological and physical well-being. It is also possible that a slight decrease in cognitive indicators may be associated with increased stress and fatigue, as indicated by high daytime sleepiness scores.
The obtained results also indicate that the relationships between indicators of psychological well-being, cognitive, and physical characteristics are complex and may differ across subgroups. For a better understanding, both detailed analysis (e.g., structural equation modeling) within the separately identified latent profiles and longitudinal and qualitative studies are necessary.