1. INTRODUCTION
Hydraulic siphons are used extensively in underground drainage systems underneath railway embankments and roads to remove the excess of water during and after a rainfall event. These are critical assets where failure has the potential to cause the road or railway to flood with a loss of its structural stability and transport capacity. Some form of continuous remote monitoring would be of great benefit in proving the on-going safety of the assets and to give early warning of failure to enable remedial works to be planned and implemented in a timely manner and to mitigate the impact of failure by allowing time to take appropriate mitigation measures. Such a system would reduce significantly or eliminate completely the need for regular CCTV survey of the siphons. This would lead to substantial cost savings, since CCTV survey of the siphons is expensive and may prove to be impossible if the siphons cannot be pumped dry.
The purpose of this investigation has been to recreate one of the inverted siphons in laboratory conditions and undertake a series of tests making use of the acoustic pipe monitoring system developed at the University of Bradford [Bin Ali, 2010]. This system uses the recorded response to an acoustic waveform passed along the pipe to give an instant picture of the pipe condition both in terms of silt levels and significant structural defects. The present project was targeted at using similar technology making use of the lessons learned and discoveries made in the last five years, but with the transducers being under water rather than in the air.
2. EXPERIMENTAL SETUP
A full-scale siphon using sections of 450 mm (ID) concrete pipes has been designed and constructed in the Hydraulics Laboratory at the University of Bradford. The siphon was installed in a waterproof plywood box. The box was initially filled with a 500 mm layer of single size fine sand. The dimensions of the siphon and the box are illustrated in Figure 1. In some of the experiments the horizontal section of the siphon was fully surrounded by sand. In other experiments a proportion of this section was surrounded by the air. The box was filled with water when damage was inflicted to the pipe wall and joints. The dimensions of the box were selected taking into regard the properties of the acoustic signals so that the surrounding material could be considered infinite.
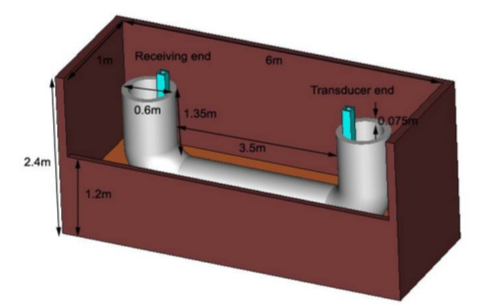
Figure 1. A 3-D sketch of the siphon facility at the University of Bradford.
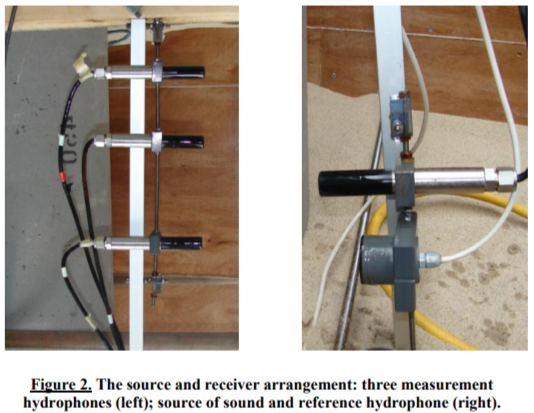
The siphon was instrumented with four 25 mm hydrophones Type SQ31 by Sensor Technology Inc. (Canada). The hydrophones have a traceable calibration history. Hydrophones H1- H3 were installed in one leg of the siphon and distributed non-equidistantly through the vertical direction to provide a measure of the spatial variation in the acoustic pressure in the siphon. The hydrophone H4 was installed in the right leg of the siphon 75 mm above the speaker and used as a reference receiver (see Figure 2 (left)). The source was a 50 mm speaker Type K50WP by Visaton (Germany) installed in the centre of the right leg of the siphon (see Figure 2 (right)). The speaker was installed in a waterproof container and had a plastic diaphragm which allowed its operation underwater in a sealed enclosure. The hydrophones and the speaker were attached securely to two stiff aluminium sections which were lowered into the opposite legs of the siphon. The instruments were kept in the same positions in all of the experiments. The emitted sound was a sinusoidal sweep in the frequency range of 100-10000 Hz. The received signals were simultaneously sampled, filtered and deconvolved to obtain the acoustic impulse response of the siphon.
The siphon was filled with clean water to a level of 900 mm below the top of the right vertical pipe (this was taken as the reference water level). The siphon was then left to settle so that the larger air bubbles created by filling the siphon were allowed to escape to the atmosphere. Typically, an acoustical measurement and water temperature reading were taken at no earlier than 30 min after the siphon was filled or when the level of water was deliberately increased or reduced.
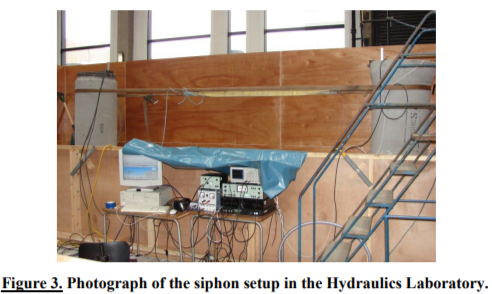
Figure 3 presents a photograph of the experimental facility in the Hydraulic Laboratory at the University of Bradford which was developed to study sound propagation in water-filled siphons.
3. SIGNAL PROCESSING METHODS
Hydraulic siphons are complex drainage systems in which non-local changes are common. These systems contain a large amount of imperfections which include wall roughness, joints, scattered debris and structural defects. These are rather difficult to characterise by using conventional acoustic reflectometry methods, e.g. those proposed by Sharp [Sharp, 1997]. In this case, the matched field processing (MFP) method using sections of 450mm (ID) concrete pipes can be used to determine a degree of change. MFP is typically used in the frequency domain and is known to be sensitive to changes in the complex acoustic fields. It requires a number of signals recorded coherently on an array of two or more receivers. The sensitivity of this method is a function of the frequency range, type and size of the pipe, and the receiver array arrangement.
The ambiguity surface can be used as a scalar estimate, like in case of the similarity between the signals received on the hydrophone array in two different experiments. It gives a graphic and numerical indication of how two fields compare to each other. Its mean and standard deviation is also some useful estimates of this similarity.
4. EXPERIMENTAL METHODOLOGY
4.1. Porous sediment effect
In this experiment the siphon was fully surrounded by dry sand and filled with water up to the level of 900 mm below the top. Ten acoustically transparent bags were prepared and filled with 5 kg single sized fine sand. The cross-sectional dimension of one sand bag corresponded to approximately 20% of the pipe cross-sectional area. Bags were tied to a 9 m rope as shown in Figure 4. The rope was then used to transport the bags in and out of the siphon. The number of bags deposited in the siphon by these means varied from 1 to 10. Measurements were taken in the usual manner. The acoustic sensors were removed and re-installed each time when the bags were deposited or taken out of the siphon to avoid damage to the sensors.
Figure 4. Sandbags are prepared for the insertion into the siphon.
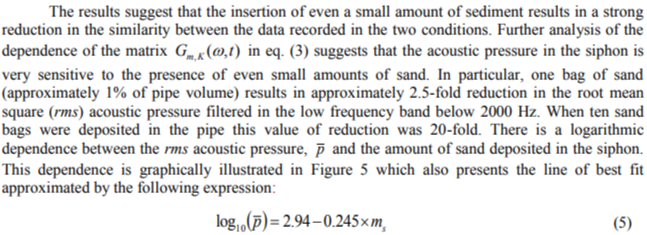
The presence of sediment has also a strong effect on the mean ambiguity surface and its standard deviation (see Figure 6). The maximum change in the mean ambiguity surface (28% reduction) occurs when 5 bags with sand were deposited in the siphon. The mean value of ambiguity surface did not depend strongly on the amount of deposited sand and it varied between 60% and 69%. A similar comment can be made regarding the standard deviation in the ambiguity surface which was approximately 30%. These results suggest that the presence of sediment can be reliably detected by monitoring the rms acoustic pressure and mean value of the ambiguity surface. Equation (5) can be used or modified if necessary to relate the amount of porous sediment to the rms acoustic pressure registered in the hydrophones.
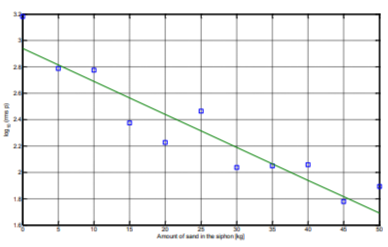
Figure 5. The relation between the mass of sand deposited in the siphon and the rms sound pressure.
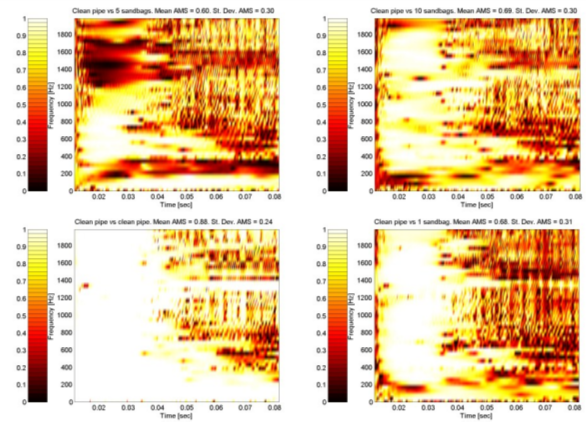
Figure 6. The correlation between acoustic pressure data (AMS) for the siphon with and without porous sediment.
4.2. Wall damage effect
The purpose of this experiment was to study the effect of wall damage on the acoustic field in the siphon. The 50% of the horizontal siphon pipe was surrounded by sand. The box was filled with water to the level 900 mm below the top of the siphon (in line with the reference water level). Artificial cuts were inflicted to the top of the horizontal siphon section. Measurements were taken in the presence of: (i) 50 mm longitudinal cut; (ii) 100 mm longitudinal cut; (iii) 200 mm longitudinal cut; (iv) 200 mm longitudinal and 55 mm transversal cuts; (v) 200 mm longitudinal and 150 mm transversal cuts; (vi) 200 mm longitudinal cut and 120 mm x 70 mm hole. These conditions are illustrated in Figure 7.
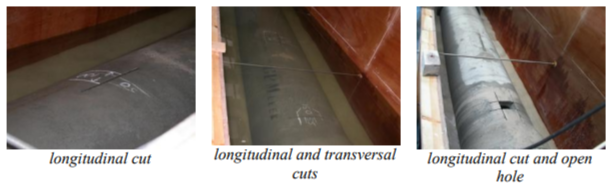
Figure 7. Photographs of the artificial damage inflicted to the top of the horizontal pipe.
The analysis of the results for the sound pressure spectra calculated with exp. (3) suggests that dependence of the rms pressure on the type of damage is rather complex and it is impossible to establish any unique relation between the extent of damage and the acoustic pressure spectra in the siphon. A short longitudinal cut (e.g., 50 mm and 100 mm long) results in the apparently increased rms pressure (in the frequency range between 100 and 600 Hz). This effect is likely to be attributed to the oscillations of water in the cut which acts like Helmholtz resonator. Figure 8 presents the ambiguity surface data comparing the acoustic field in the undamaged siphon with that in the damaged siphon. 17-23% reduction in the mean value of the ambiguity surface is observed for these two conditions (see Figure 8). Here the standard deviation in the ambiguity surface data is about 29% which is well above that observed in the reproducibility experiment. When the length of the cut was extended to 200mm, the rms pressure reduced by approximately two-fold. This effect is comparable to that caused by the presence of 5 kg of sand in the siphon. It may be possible that a porous deposit in the siphon was created when the cuts were made in the pipe. This deposit together with the longitudinal and transversal cuts could act as acoustic absorbers which have a similar effect to that observed in the case of sand in the siphon pipe, when a 25% reduction in the mean value of the ambiguity surface and 30% reduction in its standard deviation for the acoustic signals recorded under these conditions was found. When a 55 mm transversal cut was introduced subsequently, the rms pressure increased by 26% (to the mean ambiguity surface of 76%) and the value of the mean ambiguity surface did not show a significant change (24% versus 25% under the previous condition). When the transversal cut was converted to a 120 mm x 70 mm hole, the rms pressure further increased by approximately 13% and a similar mean value of the ambiguity surface (74%) was obtained. A noticeable increase in the acoustic pressure in the low frequency range (long white horizontal line near 100 Hz) was observed when the rectangular hole in the pipe wall was cut out.
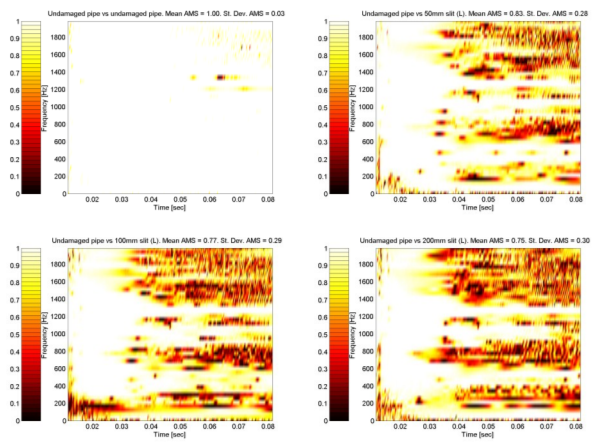
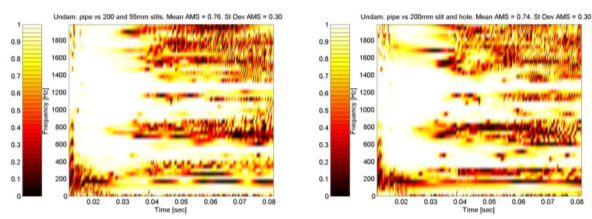
Figure 8. The correlation between acoustic pressure data for the siphon with and
without wall damage.
5. CONCLUSIONS
A new full-scale laboratory facility has been constructed and used to study the acoustic field in a siphon under a range of operational and structural conditions. This facility included a full-scale model of a concrete siphon, water-proof enclosure, acoustic sensors, data acquisition/signal processing hardware and software algorithms. The results have shown that it is possible to detect reliably a sediment blockage from the acoustical data. The main measure of the deposited sediment amount is the energy of the received signal integrated over a relatively broad frequency range. A greater amount of sediment results in a greater attenuation of the acoustic signal propagated through the siphon, thus a reduced spectral energy. It was found that an extended 20% blockage would result in approximately 20-fold reduction in the acoustic energy propagated through the siphon. Therefore, it is possible to measure accurately the amount of sediment present in the siphon by using the acoustic data. For this purpose a simple engineering formula has been derived. These changes are much larger than any changes due to changing surrounding ground conditions.
The main measure of pipe damage is variations in the received signal spectrum. These variations can be subtle and their patterns can be complex so that the spectrogram is no longer a good measure of damage. A smaller crack can result in an increase of sound pressure level at certain frequencies and reduction at other frequencies, caused by the resonance and absorption effects. Increasing the crack dimension can result in the opposite effect. Therefore, it is suggested to adopt the correlation between the signals recorded in the siphon with and without damage as the main measure of siphon structural integrity. A possible method to measure the correlation is to construct the ambiguity surface by applying a matched field processing method (e.g. [Tolstoy, 2009]) to the acoustic pressure impulse response. The results show that a 50 mm long slit made in the middle of the siphon in the longitudinal direction results in approximately 17% loss in the mean ambiguity surface and 30% standard deviation. The second slit administered in the transversal direction results in further 9% reduction in the correlation coefficient, which are measurable effects.
[Bin Ali, 2010] This work was presented at the International Conference on Condition Monitoring and Machinery Failure Prevention Technologies in 2011. Published with permission of the British Institute of Non-Destructive Testing.
© The British Institute of Non-Destructive Testing, 2011.