Introduction
Well-being, as well as happiness and prosperity — closely related phenomena that describe the most positive experiences of a young person, — have formed a vast area of psychological, pedagogical and sociological research in recent years.
Researchers have proven that a high level of well-being in all the main components thereof ensure a person functions effectively and contributes to self-realization [Yaremtchuk, 2021; Butler, 2016; Ryan, 2019; Ryff, 2019]. However, “well-being” is defined both as an objective indicator of life satisfaction (for example, when assessing the quality of life in a city, region, country, etc.), and as a subjective indicator — “a subjective assessment of life as a whole being close to the maximum desirable state” [Isaeva, 2022].
Analysis and systematization of well-being studies allows us to differentiate between hedonistic and eudemonistic approaches to the well-being of adolescents and young people [Antonova, 2018; Byzova, 2018; Veselova, 2021; Volkova, 2022; Galazhinskij, 2019; Glotova, 2018].
Studies carried out within the framework of the hedonistic approach and focused on positive feelings and overall satisfaction [Butler, 2016; Pezirkianidis, 2021] have described the influence of the modernization of Russian society on the social well-being of young people and the connections between subjective quality of life and ideas of happiness among youth. Future prospects were analyzed in terms of subjective well-being, with attention to features such as emotional well-being, happiness and life satisfaction and young people, including gender-associated characteristics of well-being [Antonova, 2018; Byzova, 2018; Veselova, 2021; Volkova, 2022; Glotova, 2018; Seligman, 2018].
Within the framework of the eudemonistic approach, well-being is described in terms of personal development, the acquisition of a personal identity, a high level of self-realization, and the ability to have primary agency in one’s own life. Well-being is associated with the development of personal resources of positive functioning and with a personal assessment of predictors of happiness; they speak of well-being as becoming a holistic, meaningful and fully fledged being [Giangrasso, 2021; Ryan, 2019; Ryff, 2019; Seligman, 2018]. Such studies are dedicated to the strategies for achieving psychological well-being by modern youth and the relationship between morality, social status and psychological and emotional development [Byzova, 2018; Seligman, 2018].
One of the most well-known implementations of this approach is the PERMA well-being model, created and presented by M. Seligman in The Theory of Well-being [Ryan, 2019]. In 2016, based on that model, Australian researchers J. Butler and M. Kern developed the PERMA-Profiler diagnostic tool which tool demonstrated high reliability and validity. Following M. Seligman in her understanding of well-being, the authors discussed “prosperity” as a state of equilibrium between a high level of emotional, psychological and social well-being [Samokhvalova, 2022]. The questionnaire is widely used by psychologists around the world, particularly in England, Greece, Korea, Italy, and the United States of America [Osin, 2020; Ascenso, 2018; Bradburn, 2019; Diener, 2021; Giangrasso, 2021; Pezirkianidis, 2021; Seligman, 2018]. In 2021, the questionnaire was translated and adapted to be administered in Russia [Golovej, 2019].
The factors of psychological well-being in thecontext of their specific socio-cultural conditions remains an important issue to be researched. Despite the fact that the phenomenon of psychological well-being and its manifestations among Russian youth are a focus of scientific interest, the nature and degree of influence of social and socio-psychological factors on the psychological well-being of Russian youth are still obscure. Socio-demographic characteristics that determine the psychological well-being of different youth groups, the relationship between life goals and values, and the attitude of young people with different levels of psychological well-being to modern global trends and technologies are of social and practical importance for establishing a basis of evidence for state policy on working with youth.
The goal of the current study was to assess the factors of psychological well-being of Russian youth.
Methods and tools
The study of the level of psychological well-being of Russian youth was carried out with the PERMA-Profiler questionnaire (Butler, Kern, 2016), adapted for the Russian-speaking sample by Isaeva, Akimova, and Volkova [Golovej, 2019; Samokhvalova, 2022]. The adapted PERMA-Profiler questionnaire corresponds structurally to the original theoretical construct and has passed checks for convergent and discriminant validity, has high reliability in terms of internal consistency (Cronbach’s alpha=0.80) and, in general, meets the requirements for psychodiagnostics tools [Golovej, 2019].
The questionnaire was administered to the youth of Central Russia through Google forms. The study was anonymous and was conducted on a voluntary basis. The form also included questions about the socio-demographic characteristics of the respondents, their life goals, values, and attitudes to global trends and modern technologies.
The results of the study were processed using the methods of descriptive statistics, frequency analysis, and analysis of differences in the computer programs IBM SPSS STATISTICS 26. To analyze the differences in categorical data presented in percentage terms, Pearson’s χ2 goodness-of-fit test was used; analysis of differences in quantitative data was carried out through the ANOVA (Fisher’s F test) procedure.
Effect sizes were calculated using the software provided on the Psychometrica portal (www.psychometrica.de).
Thu study sample consists of 11,811 young people aged 18 to 35, of whom: 6,118 (51.8%) are 18—22 years old, 2,480 (21.0%) — 23—30, 3,213 (27.2%) — 31—35. 3,729 (31.6%) are males, 8,078 (68.4%) females; 4,125 (34.9%) graduated from the University, 1,509 (12.7%) graduated from middle educational level institution, another 6,177 (52.3%) are currently studying at institutions of different levels.
Results
The assessment of the psychological well-being of Russian youth was carried out with the PERMA-Profiler questionnaire for a Russian-speaking sample.
The data collected indicates that descriptive statistical estimates of the questionnaire scales are close to the values obtained during the testing of the Butler-Kern questionnaire on a sample of 31,965 people from 18 countries (Table 1) [Samokhvalova, 2022].
The highest values were obtained for the Happiness (M=7.40; Median=8.00) and Positive emotion (M=7.31; Median=7.67) scales. It is on these scales of the questionnaire that the median and mean values are somewhat higher than in the comparative sample. The lowest values were noted on the Loneliness (M=4.47; Median=4.00) and Negative Emotion (M=5.77; Median=5.67) scales.
Normality check with the Kolmogorov-Smirnov (KS) test showed that the data on the scales are distributed normally (KS=0.045÷0.157; p≤0.01). All scales, except for the Negative Emotion, showed a right-sided asymmetry (А=-0.792÷-0.433), which is consistent with previous studies by Butler and Kern [Samokhvalova, 2022].
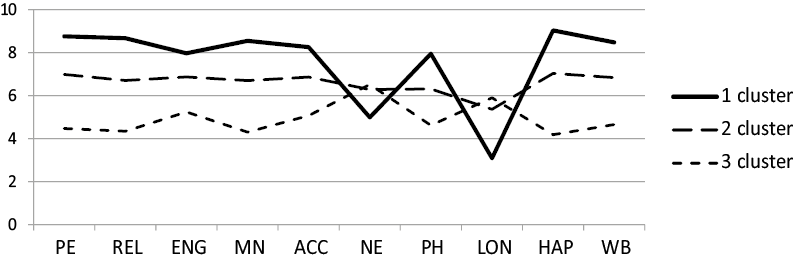
At the same time, the data showed heterogeneity in the distribution between respondents with different levels on the well-being scales. Three groups (clusters) of respondents were identified through the cluster analysis procedure of K-means clustering applied to the preliminary standardized data (Fig. 1).
4,913 (41.6%) respondents were assigned to the first cluster, 4,912 (41.6%) to the second, and 1,986 (16.8%) to the third. All three clusters are statistically different regarding wellbeing scales (according to the results of ANOVA and χ2 test) (see Table 2, Table 3, Table 4).
Respondents assigned to Cluster 1 have significantly higher estimates on PERMA-Profiler scales with a clearly ‘positive’ meaning (for example, Positive Emotion, Physical Health) and lower values on ‘negative’ scales (such as Negative Emotion or Loneliness) than other respondents (Fig. 1).
For those assigned to the 3rd cluster, values on the positive scales were significantly lower, and on negative scales significantly higher, than for other respondents. This group is comparatively smaller than other groups in the sample (16.8%).
Cluster 2 included respondents with an average level on the scales.
Respondents assigned to clusters 1, 2, 3 will be further called respondents with a “high”, “average”, and “low” levels of well-being, respectively. These names are conditional and introduced to facilitate further meaningful interpretation of the data obtained. The objective values on the scales ranged from average to high for all respondents.
Respondents with differences in the scales of well-being also varied in marital status, the presence or absence of children, and income levels (Table 2).
A greater number of respondents assigned to Cluster 1 with a high level of well-being are officially married and live with a spouse and/or children, and earn more than 40,000 rubles per month. Among them, fewer people have no children.
In the group of respondents assigned to the 3rd cluster with a low level of well-being, there are significantly more of those who have no children, and fewer of those who are officially married, live with their families and have an income of more than 40,000 rubles.
Respondents from Cluster 2 with an average level of well-being in terms of the above characteristics are in between the 1st and 3rd clusters. The effect sizes for all characteristics in Table 2 is less than 0.1, which is considered to be low [Choi, 2019].
Life goals, values and prospects
We also collected the data on life values, life goals and life prospects. Table 3 shows the characteristics for which there were statistically significant differences in the distribution of respondents assigned to different clusters and the corresponding values of the individual characteristics.
The blocks “Life values”, “Accomplishment of life goals”, and “Life prospects” on Table 3 contain the percentage of respondents who have marked the appropriate answer in the survey. The “Life goals” block includes the average rankings, reflecting the importance of this goal for the respondent (the most important goal takes first rank).
For Cluster 1, there are significantly more respondents (compared to the rest) who are clearly positive towards their future in various spheres of life, including their future in their profession. In addition, a strong family and a good education are the most important goals.
Respondents assigned to Cluster 3 are characterized by a greater number of those interested in material well-being, passive in the achievement of their goals and pessimistic about the future. For this group of respondents, life goals related to material wealth and power over other people are the most significant.
The effect size is large for the indicator “I look to the future with confidence and optimism” from the “Life prospects” block (φ=0.805), and average for the indicator “To have a strong family” from the “Life goals” block (f=0.267). The effect size of the remaining indicators in Table 3 is low (φ=0.1÷0.3; f=0.1÷0.25). The effect size for “Nothing depends on me” from the “Accomplishment of life goals” block is below 0.1.
Table 1
Descriptive statistics of wellbeing scales in the study sample
and comparative sample (according to Butler, Kern, 2016)
|
Scale name |
Study sample (N=11811) |
Comparative sample (N=31965) |
||||
|
M (SD) |
Median |
Min/Max |
M (SD) |
Median |
Min/Max |
|
|
Positive Emotion |
7.31 (1.79) |
7.67 |
0/10 |
6.69 (1.97) |
7.00 |
0/10 |
|
Relationship |
7.14 (1.98) |
7.33 |
0/10 |
6.90 (2.15) |
7.33 |
0/10 |
|
Engagement |
7.05 (1.61) |
7.33 |
0/10 |
7.25 (1.71) |
7.67 |
0/10 |
|
Meaning |
7.08 (1.85) |
7.33 |
0/10 |
7.06 (2.17) |
7.67 |
0/10 |
|
Accomplishment |
7.15 (1.56) |
7.33 |
0/10 |
7.21 (1.78) |
7.67 |
0/10 |
|
Negative Emotion |
5.77 (1.86) |
5.67 |
0/10 |
4.46 (2.06) |
4.33 |
0/10 |
|
Physical Health |
6.71 (1.95) |
7.00 |
0/10 |
7.33 (2.18) |
7.33 |
0/10 |
|
Loneliness |
4.47 (2.77) |
4.00 |
0/10 |
- |
- |
- |
|
Happiness |
7.40 (2.11) |
8.00 |
0/10 |
7.02 (1.66) |
7.38 |
0/10 |
Notes: PE — Positive Emotion; REL — Relationship; ENG — Engagement; MN — Meaning; ACC — Accomplishment; NE — Negative Emotion; PH — Physical Health; LON — Loneliness; HAP — Happiness; WB — Total Wellbeing
Table 2
Family and income
|
Indicator |
% of respondents |
Difference between clusters |
|||||
|
Total |
1 Cluster |
2 Cluster |
3 Cluster |
χ2 |
P |
Effect size |
|
|
Married — officially |
33.2 |
38.5 |
31.8 |
23.5 |
8.21 |
0.02* |
φ=0.099 |
|
Live with a family (spouse, children) |
38.6 |
44.3 |
37.6 |
27.2 |
8.18 |
0.02* |
φ=0.098 |
|
No children |
63.5 |
59.9 |
64.3 |
70.7 |
7.34 |
0.03* |
φ=0.088 |
|
Income more than 40,000 rub/month |
7.20 |
9.40 |
6.00 |
4.30 |
6.11 |
0.04* |
φ=0.073 |
Notes: χ2 — Pearson’s χ2; P — p-value; * — p ≤ 0.05; φ — Matthews correlation coefficient.
Table 3
Life goals, values and prospects of youth
|
Indicator |
% of respondents in a cluster |
Difference between clusters |
|||||
|
Total |
1 |
2 |
3 |
Criterion |
P |
Effect size |
|
|
Life values |
|||||||
|
The most important is …material wealth |
19.8% |
15.5% |
20.1% |
29.5% |
χ2=13.91 |
0.00*** |
φ=0.167 |
|
Life goals |
|||||||
|
… to have a strong family |
1.48 |
1.39 |
1.49 |
1.69 |
F=53.92 |
0.00*** |
F=0.267 |
|
… to get an education |
2.02 |
1.96 |
2.02 |
2.14 |
F=16.03 |
0.00*** |
F=0.154 |
|
… to have a lot of money |
2.19 |
2.26 |
2.17 |
2.07 |
F=15.21 |
0.00*** |
F=0.151 |
|
… to have power, control over others |
2.86 |
2.92 |
2.81 |
2.84 |
F=4.98 |
0.01** |
F=0.107 |
|
Accomplishment of life goals |
|||||||
|
Nothing depends on me |
7.7% |
4.3% |
7.3% |
11.4% |
χ2=6.73 |
0.04* |
φ=0.076 |
|
Life prospects |
|||||||
|
I will achieve more than my parents |
53.5% |
62.3% |
51.8% |
35.8% |
χ2=15.01 |
0.00*** |
φ=0.181 |
|
I look to the future with confidence and optimism |
51.2% |
73.1% |
42.2% |
19.0% |
χ2=66.81 |
0.00*** |
φ=0.805 |
|
I clearly understand my professional future |
57.7% |
69.3% |
54.0% |
38.7% |
χ2=17.91 |
0.00*** |
φ=0.216 |
Notes: χ2 — Pearson’s χ2; F — F-test; P — p-value; * — p ≤ 0.05; ** — p ≤ 0.01; φ — Matthews correlation coefficient; f — Cohen’s coefficient.
Table 4
Attitudes of young people to global trends and high technology
|
Indicator |
% of respondents in a cluster |
Difference between clusters |
|||||
|
Total |
1 |
2 |
Total |
Criterion |
P |
Total |
|
|
Global trend |
|||||||
|
Care for the environment |
47.0% |
61.1% |
46.3% |
29.5% |
χ2=22.62 |
0.00*** |
φ=0.272 |
|
Animal protection |
45.0% |
67.1% |
53.7% |
33.1% |
χ2=22.94 |
0.00*** |
φ=0.276 |
|
High technology |
|||||||
|
Trust in unmanned vehicles |
3.53 |
3.53 |
3.56 |
3.43 |
F=4.53 |
0.01** |
F=0.105 |
|
Trust in Russian technologies |
3.64 |
3.81 |
3.62 |
3.27 |
F=86.16 |
0.00*** |
F=0.338 |
|
Ready to use innovative tech |
3.52 |
3.58 |
3.53 |
3.37 |
F=11.02 |
0.00*** |
F=0.122 |
|
Ready to work with robots |
4.02 |
4.10 |
4.02 |
3.84 |
F=16.88 |
0.00*** |
F=0.148 |
Notes: χ2 — Pearson’s χ2; F — F-test; P — p-value; * — p ≤ 0.05; ** — p ≤ 0.01; *** — p ≤ 0.001; φ — Matthews correlation coefficient; f — Cohen’s coefficient.
Attitudes to global trends and high technology
Data on the participants’ attitude to global trends (conscious consumption, ecology, urbanization, animal protection, waste processing) and high technologies (unmanned vehicles, robots and other technical systems controlled by artificial intelligence) are presented in Table 4. Analogous to the previous tables, only those indicators are reported which varied significantly between clusters.
A majority from Cluster 1 support global trends in ecology and animal protection.
Trust in unmanned vehicles and in Russian modern technologies is much higher among respondents with a high level of well-being compared to others. They, and the respondents with an average level of well-being, are more ready to use innovative technologies and work with robots.
Fewer respondents from Cluster 3 are interested in following global trends, most of them don’t trust autonomously driven transport technologies or Russian modern technologies in general, and they are less ready to use innovative technologies and work together with robots.
The effect size is average for the indicator “Trust in Russian technologies” from the “High technologies” block (f=0.338). Other indicators in Table 4 have a low effect sizes (φ=0,1÷0,3; f=0,1÷0,25).
Discussion
The study shows that young people aged 18 to 35 living in Central Russia have average and high estimates of well-being.
The results of the cluster analysis speak to the consistency of the well-being scales: for the respondents of one cluster, the values on total well-being, Positive Emotion, Relationships, Engagement, Meaning, Achievement, and additional scales were conditionally allocated to same level (high, average or low).
It was determined that study participants with different levels of well-being also differ in their family status, income level, life position, life goals, and ways to achieve those goals. They perceive their material well-being in different ways, and have diverse attitudes towards modern global trends and technologies.
Among the respondents with the highest values on the well-being scales, there were significantly more officially married young people, living with their families, and having an income level of more than 40,000 rubles per month, sufficient to cover every day needs. In addition, more respondents from this cluster have an active approach to life, look to the future with optimism and are confident in success in life compared to others. A strong family and a good education are among the most significant life goals for them. More than others, the majority of these respondents are committed to actions aimed at preserving the environment and protecting animals. They have more confidence in modern technologies, including autonomous vehicles and Russian high tech, and are ready to work with robots controlled by artificial intelligence.
Respondents who showed the lowest values of well-being and its components are less likely to have children, be married, live with a family or have an income of more than 40,000 rubles. A significantly larger number of respondents in this group prioritize material well-being, but at the same time, they are not active in achieving their most significant goals — high earnings and gaining power over others. For the most part, they are not confident or optimistic abotu the development of their situation in the future, they do not show interest in global trends, including the preservation of the environment and the protection of animals. Compared to the others, they trust modern technologies, including those developed in Russia, to a lesser extent.
Respondents who have average values of well-being have characteristics that mainly describe the middle ground between the previous two groups.
The effect size for the difference in socio-demographic characteristics (family status, having children, income) between the clusters is less than 0.1. At the same time, the effect size for differences in psychological characteristics (life goals, values, life prospects, attitudes towards global trends and high technologies) is greater than 0.1. This may indicate that psychological characteristics are more significant for the well-being of Russian youth than socio-demographic indicators.
It is noteworthy that psychological characteristics, especially those such as the desire to have a strong family, confidence and optimism about the future, and trust in Russian technologies, contribute more to psychological well-being than the social effects (see tables 2, 3, 4). These characteristics are essentially related to personal choice; they require a person to make a decision, which is especially important in youth. It is these characteristics that can be nurtured through the influence of society.
Conclusion
The results of the study indicate that the characteristics of family status, attitudes towards one’s future, following global trends and a trusting attitude towards modern innovative technologies are factors of well-being among Russian youth aged 18—35 years.
Young people who are characterized by a positive perception of future prospects, a focus on a strong family and a good education, a trusting attitude toward the adoption of modern technologies, following global trends in environmental, and a humanistic orientation, have higher values of general well-being and its components compared to those oriented towards increasing material wealth and power over other people, characterized by a pessimistic attitude towards the future, a dissatisfaction with their financial situation, and a low trust in modern technologies.
The results of the study can be used in public programs aimed at improving the well-being of young people.
This study has a number of limitations. First of all, the data were collected only in the Central region of Russia. To properly generalize the results, it is necessary to collect data in other Russian regions. Besides, the study did not consider the personal characteristics of various youth groups or the scope of their professional activities, hobbies, etc. Future research should focus on studying these characteristics to get a detailed picture of the factors and determinants of the well-being of Russian youth. Isaeva O.M., Akimova A.Yu., Volkova E.N.