Introduction
Smartphones have become crucial components of the digital landscape. They are the most commonly used tools in nearly all aspects of life, from TV to social media and banking to shopping. The increase in smartphone use has prompted researchers to investigate its impact on attention, the cognitive skill most affected by the acceleration of information flow caused by information technologies [DeWeese, 2014; Cecutti, 2021; Aru, 2022].
Continuous partial attention (CPA) describes the phenomenon in which individuals constantly monitor several information sources simultaneously, often without fully focusing on any one source. The CPA involves paying minimal simultaneous attention to many sources of information. This behavior, fueled by technological advancements, grants access to a vast array of information. For example, we can check tweets on our smartphones while watching TV and checking emails on our personal computers. Unlike multitasking, CPA may result in poor and inefficient task performance [Mills, 2013]. While the digital world offers unlimited information, it is also a constant source of distraction [Rose, 2010].
The habit of using smartphones and other devices simultaneously is rapidly rising and becoming the norm [Heitmayer, 2022]. Approximately 89 percent of interactions with smartphones are initiated by the user rather than by a notification [Heitmayer, 2021]. This suggests that the annoyance caused by smartphones is not caused by the devices themselves, but rather by the learned behavior of the users. This, combined with the increasing amount of screen time in the digital world, is a major source of attention problems among students. To determine how students are affected by prolonged smartphone use, it is important to establish a relationship between CPA and smartphone screen time.
Related Literature
A growing body of research has examined the effects of prolonged smartphone screen time (PSST) on attention, showing that it can negatively affect attention, leading to decreased concentration and difficulty focusing on tasks. Related studies have addressed the increasing prevalence of problematic smartphone use and its effects on human health, cognition, and psychology [Neophytou, 2021].
One literature stream suggests minimal effects of smartphone use on attention [Wilmer, 2017] and assumes that PSST will not have long-term consequences [Cecutti, 2021]. Meanwhile, the other literature stream argues that PSST exerts negative cognitive and psychological effects on employees. J. Aru and Rozgonjuk showed that PSST can cause an inability to exert prolonged mental effort, which can impair real-world creativity and information gain [Aru, 2022]. S.M. Föckel found a significant, weak, positive relationship between smartphone screen time and depression symptoms among young adults, regardless of self-control [Föckel, 2022].
Studies from both streams of literature have presented contextual approaches. A. Sela, N. Rozenboim, and H.C. Ben-Gal identified two contradictory modes of smartphone use: the unaware mode, in which a smartphone is used in conjunction with other activities, and the aware mode, in which a smartphone represents an active lifestyle [Sela, 2022]. They found that PSST in the unaware mode exerted a negative effect on quality of life. Similarly, A.B. Fortes, P.L. Broilo, and C.S.M.D. Lisboa investigated the relationship between smartphone use and psychological well-being [Fortes, 2021]. Their results showed that smartphone use was negatively associated with psychological well-being, but this relationship was weakened by cognitive reappraisal strategies and communication-related smartphone use. Their findings suggest varying implications for smartphone use according to the type of use and emotion regulation strategies employed.
Research has also explored smartphone screen time in different groups. Osailan found that the daily average smartphone screen time (DASST) among participants aged 18–30 years was 7,8 ± 2,2 hours [Osailan, 2021]. In S.M. Föckel [Föckel, 2022] reported that participants aged 18–29 years had a DASST of 4.7 hours.
PSST has been linked to negative effects on split attention, the ability to simultaneously attend to multiple tasks or information sources [DeWeese, 2014; Cecutti, 2021; Aru, 2022]. DeWeese reported that PSST is associated with increased multitasking, which can lead to decreased task performance and increased cognitive load [DeWeese, 2014]. L. Cecutti, A. Chemero, and S.W. Lee found that PSST is linked to an increase in the time required to switch between tasks, which impairs the ability to effectively manage multiple information sources [Cecutti, 2021]. PSST has also been associated with a decreased ability to filter irrelevant information, which is essential for effective split attention [Aru, 2022]. This drawback may be due to the constant interruptions and distractions provided by smartphones, which can hinder individuals’ ability to focus on a single task and filter irrelevant information.
The literature also shows that PSST affects the task performance. C. Stothart, A. Mitchum, and C. Yehnert noted that smartphone interactions lead to poor performance in concurrent tasks [Stothart, 2015]. Baumeister and Tierney underline that students with PSST lose motivation to complete cognitively challenging activities as limited attentional resources and capacity must be shared between tasks [Baumeister, 2011]. This partial attention is insufficient for completing concurrent tasks such as driving. Based on the existing literature, we formulated the main hypothesis of this research as
- H1: PSST is a significant predictor of CPA.
Individuals who engage in continuous partial attention (CPA) tend to have lower levels of cognitive control because they constantly switch between tasks and stimuli. This condition can lead to reduced productivity and an inability to focus on any task for an extended period. CPA can negatively affect attention, as individuals may not fully engage with others when they constantly monitor their devices for new information.
The top apps downloaded globally in Q3 2022 were Photo Sharing, Short Video Platform, Facebook, Messaging App, Snapchat, and Telegram [Koetsier, 2022]. The negative effects of mobile applications have been examined in the literature. For example, Short Video Platform usage has been studied to determine its influence on attention deficit hyperactivity disorder [Yeung, 2022]. Pan et al. examined the active versus passive use of Short Video Platform and its association with female users’ self-esteem pertaining to appearance and weight [Pan, 2023]. They found that active use had positive effects, whereas passive use had negative effects. Therefore, it is important to investigate the relationship between smartphone applications and CPA.
Although the existing literature has investigated the effects of prolonged smartphone screen time (PSST) on attention, it has not focused on the effects of CPA, which could be the most likely outcome of PSST. Determining the predictive relationship between PSST and CPA can contribute to the literature on problematic smartphone use.
Current Investigation
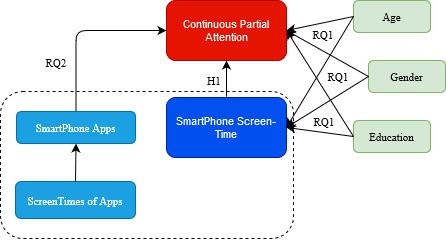
This study investigated the impact of PSST on CPA. We compared students’ CPA and DASST scores according to age, sex, and education. We then investigated the relationship between smartphone applications and CPA. We formulated two research questions in addition to the main research hypothesis.
- RQ1: How do CPA and DASST scores vary according to students’ age, sex, and education?
- RQ2: What is the relationship between smartphone applications and CPA?
Methods
Quantitative data were collected and analyzed. We then realized that the quantitative findings needed more in-depth explanation, and the most appropriate method for this was an in-depth inquiry through focus group interviews. Therefore, we collected qualitative data through focus group interviews. Accordingly, this study adopted an explanatory mixed-methods design. The mixed methods research design is suitable for studies in which the findings obtained from the quantitative data collected in the first stage are explained using qualitative data [Creswell, 2011]. The conceptual model is illustrated in fig. 1.
To the best of our knowledge, this is the first study to suggest that smartphone screen time may be associated with CPA.
Data Collection
Quantitative data were collected using questionnaires with three sections. The first section gathered demographic information, including the participants' age, sex, and education level. The second section included a single 10-point Likert-type question aimed at assessing continuous partial attention (CPA): 'While I am constantly tracking and engaging with technology, I cannot fully pay attention to what I am actually doing.' Single-item measures, as used here, have been demonstrated to be effective in attention-related constructs [Sarstedt, 2009], particularly when the construct is clear and confined, as is the case with the CPA. This section aimed to measure continuous partial attention (CPA). Single-item measures have been effectively used in various fields [Christophersen, 2011], such as finance [Ittner, 1998], clinical psychology [McKenzie, 1999], social and personality psychology [Aron, 1992], and occupational psychology [Dolbier, 2005]. Single-item measures “perform acceptably considering dependability” for simple constructs, although they are not suitable for complex constructs [Sarstedt, 2009]. A single item may be adequate if the construct being assessed, such as future behaviors, is sufficiently confined or clear to respondents [Freed, 2013].
We applied a test–retest method to determine the reliability of the single CPA scale. The Cronbach’s alpha for test–retest reliability was 0,899, indicating high reliability [George, 2019]. These criteria suggest that correlation and regression analyses can be safely applied to CPA scores.
The final section of the questionnaire collected information on the participants’ DASST and the apps with the highest weekly screen times. Two questions were asked to measure the participants’ screen time, and directions explaining how to access weekly reports on their smartphones were provided. Research using direct screen time data is increasingly common because of the potential for bias and unreliability of self-reported data [Gower, 2018].
Data were collected from eight students through a focus group interview to explain the findings of the quantitative analysis for Research Question 2 (RQ2). The interview was conducted during the second session of a PhD mixed methods research course. The quantitative phase findings were summarized at the beginning of the interviews. A focus group interview was conducted to explain the Short Video Platform findings related to RQ2. The interview lasted for 8 min and 35 s.
Participants
Graduate students were selected as research participants for two reasons. First, we aimed to minimize unaware smartphone use, as identified by A. Sela, N. Rozenboim, and H.C. Ben-Gal [Sela, 2022], and factors such as age range and occupational differences. Second, we aimed to collect accurate smartphone screen time data and the most frequently used applications. Master’s and doctoral students are among those who are most open to sharing data for scientific research purposes.
In this study, we followed the Committee on Publication Ethics (COPE). This study and its protocols were approved by the Scientific Research and Publication Ethics Committee of Anadolu University, Turkey. The questionnaire was shared with 120 master’s and doctoral students at Anadolu University. A total of 103 students completed the questionnaire. The participants were informed about their voluntary participation via a corresponding form, and they were able to complete the questionnaire without being recorded. Their demographic characteristics were also obtained as shown in Table 1.
Table 1
Demographic Frequencies
|
Demographics |
Groups |
Frequencies (f) |
Percentage (%) |
|
Sex |
Female |
52 |
51,5 |
|
Male |
49 |
48,5 |
|
|
Education |
Master’s |
58 |
57,4 |
|
Doctoral |
43 |
42,6 |
|
|
Age |
< 30 years |
28 |
27,7 |
|
30–45 years |
63 |
62,4 |
|
|
> 45 years |
10 |
9,9 |
Critical case sampling, a purposive sampling technique, was used to identify participants for the qualitative research phase. The focus group interview participants were eight participants with the highest Short Video Platform screen times.
Data Analysis
A Student’s t-test was performed to examine the effects of sex and education on the DASST and CPA. ANOVA was used to examine the effects of different age groups on the DASST and CPA. A General Linear Model (GLM) was applied to further investigate the effect of DASST on CPA while controlling for sex, age, and education. These methods were chosen for their robustness in analyzing differences across multiple groups and multiple factors. Descriptive statistics were used to investigate the relationship between smartphone apps and CPA (RQ2). Correlation and regression analyses were performed to test the main hypothesis of this study. Pearson’s correlation analysis was used to determine the relationship between the DASST and CPA. Linear regression analysis was conducted to investigate the predictive value of the PSST on students’ CPA.
The raw voice recording data obtained from the focus group interview were first transcribed into text. The codes were then generated from the text. Finally, the codes were combined and transformed into themes that were then reviewed. Inductive content analysis was performed using NVivo 12, a qualitative data analysis software, to create the themes.
Results
The DASST of the 103 students was 255 ± 124 minutes, which is within the range of 7,8 ± 2,2 hours reported by A. Osailan [Osailan, 2021], but is higher than the average of 4,72 hours reported by S.M. Föckel [Föckel, 2022]. The mean CPA score of the students was 5,77 ± 2,47 (on a 10-point Likert scale), indicating moderate levels of continuous partial attention. According to the students, Photo Sharing was the most frequently used smartphone application. This finding is consistent with the Q3 2022 data of Data. ai [Koetsier, 2022]. The details of the findings from the analyses are presented under the subtitles for the two research questions and the main hypothesis.
RQ1: Demographic Comparisons
No significant differences were observed in CPA or DASST scores across demographic groups (p > 0,05 for all comparisons).
Table 2
Effects of Sex, Age, and Education on DASST and CPA
|
Demographics |
Groups |
N |
CPAa (X) |
p |
DASSTb (X) |
p |
|
Sex |
Female |
52 |
6,13 |
0,113 |
261 |
0,997 |
|
Male |
49 |
5,39 |
249 |
|||
|
Education |
Master’s |
58 |
5,67 |
0,633 |
268 |
0,235 |
|
Doctoral |
43 |
5,91 |
238 |
|||
|
Age |
< 30 years |
28 |
5,89 |
0,121 |
271 |
0,101 |
|
30–45 years |
63 |
5,97 |
259 |
|||
|
> 45 years |
10 |
4,20 |
187 |
Note: a Continuous partial attention; b daily average smartphone screen time.
No significant differences were found in the average CPA and DASST scores when analyzed with respect to demographic variables. Students aged above 45 years had the lowest mean CPA and DASST scores. Meanwhile, male students aged under 30 years showed insignificant improvements in overall scores. A GLM was applied to further investigate the effects of DASST on CPA while controlling for students’ sex, age, and education. Accordingly, we summarized the statistics for the GLM of CPA in Table 3.
Table 3
Analysis of the Effects of DASST on CPA by General Linear Model
|
Demographics |
Groups |
N |
CPAa (Means) |
p |
η² |
|
Sex |
Female |
52 |
6,13 |
0,205 |
0,015 |
|
Male |
49 |
5,39 |
|||
|
Education |
Master |
58 |
5,67 |
0,442
|
0,006
|
|
Doctoral |
43 |
5,91 |
|||
|
Age |
< 30 years |
28 |
5,89 |
0,208 |
0.03 |
|
30–45 years |
63 |
5,97 |
|||
|
> 45 years |
10 |
4,20 |
|||
|
Overall Model |
R2 = 0,1723, Adj. R2 = 0,0595, F = 1,527, p = 0,13 (95% CI), η² = 0,172 |
||||
Note: a Continuous partial attention.
We applied a GLM and conducted ANOVA omnibus tests to adjust for age, sex, and level of education. However, the average CPA scores by sex, education, and the three age groups failed to show significant differences. The eta-squared values (η²) were calculated to show effect sizes. The effect size metric, eta-squared, is frequently used in ANOVA. In an ANOVA model, the effect size is used to calculate the percentage of variation accounted for by each main and interaction effect. The effect sizes revealed small demographic effects on the relationship between CPA and DASST.
RQ2: Smartphone Apps and CPA
The participants identified the smartphone apps with the highest average weekly screen time, as shown in Fig. 2. The two smartphone apps that students most frequently cited as having the highest weekly screen times were Photo Sharing (23), Messaging App (17), Video Sharing (9), Microblogging and Internet Web Browsers (5), Short Video Platform and Streaming Platform (2), and others (1).
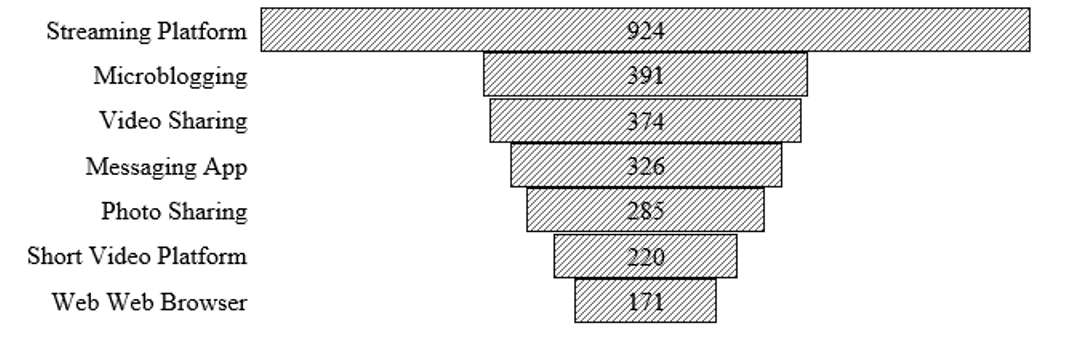
Streaming Platform had the highest screen time with an average of 924 min, which is natural as it is a video streaming app; however, the instant chat application Messaging App also had a high average weekly screen time of 326 min.
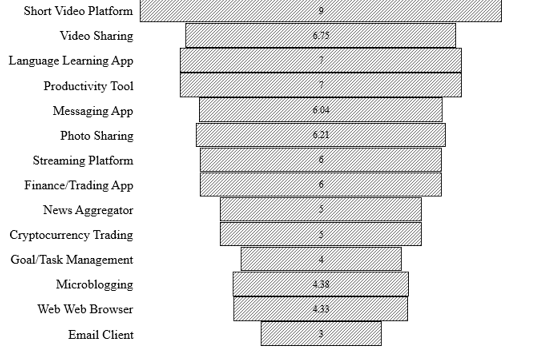
Fig. 3 shows the CPA averages of the apps with the highest weekly average screen time. Short Video Platform had the highest CPA score, which supports the results of Yeung and Abi-Jaoude [Yeung, 2022], who found that Short Video Platform causes attention problems among adolescents. The mean CPA scores of the other apps were close to or below average. Future research should investigate the CPA effects of apps using more participants.
Qualitative Findings
A focus group interview was conducted to explain Short Video Platform’s impact on CPA. Eight students with the highest Short Video Platform screen times (coded as P1, P2, and so on) were selected for the focus group interview. At the beginning of the interview, the definition of CPA and the findings on the impact of Short Video Platform on CPA were shared with participants. The interview consisted of a single open-ended question (“Based on your experience, why do individuals who spend a long time on Short Video Platform have higher CPA averages than others?”). The following six themes, as shown in Fig. 4, were identified in the content analysis: hypnotic algorithm, distracting redundancy, marketing advertisement, passive receiver mode, short video flow, and surprise content factor. These themes were categorized into content- and system-related themes, respectively.
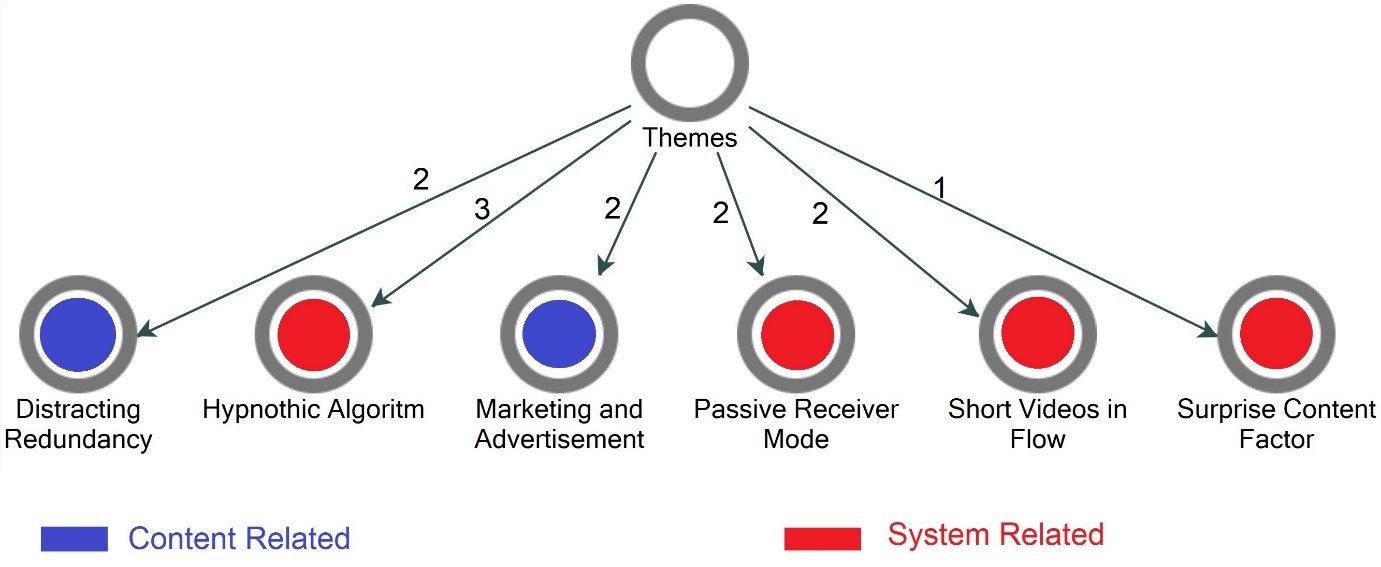
The students emphasized that Short Video Platform content is distractingly unrelated, lacks integrity, and marketing and advertising elements are distractingly abundant in the content. Both themes were related to the content. The students also stated that Short Video Platform users are passive receivers, the app has no user control other than scrolling, flow is provided by short videos, and a state of self-hypnosis emerges as the app maintains users’ attention with surprising content. Two interviewees stated the following:
“...so there is an algorithm behind it. Yeah, it’s taking the videos that we spend the most time on, and it’s going through content types that are close to that...” (P2)
“I feel like it’s out of my control… my control over the whole system is just scrolling.” (P5)
These findings support A. Sela, N. Rozenboim, and H.C. Ben-Gal [Sela, 2022] and Pan et al. [Pan, 2023], who reported that prolonged smartphone use in the unaware (passive) mode has a negative effect on quality of life. These findings are also aligned with the related literature highlighting the hypnotic effects of Short Video Platform-like mobile interactions.
H1: PSST predicts CPA
The central hypothesis of this study is that the PSST predicts CPA. To test this hypothesis, we first determined whether the dependent variable, CPA scores, was normally distributed using the Shapiro–Wilk test (W = 0,982, p = 0,18 > 0,05). We then examined the correlation between smartphone screen time and CPA using Pearson’s correlation analysis. In the correlation analysis, we found a positive, moderate relationship between smartphone screen time and CPA (Pearson’s r = 0,251, p = 0,011 < 0,05). We subsequently tested the predictive effect of smartphone screen time on CPA using linear regression analysis. The regression analysis showed that the DASST positively and significantly predicted students’ CPA (F(1,99) = 6,64, p = 0,011 < 0,05, R2 = 0,0628, adjusted R2 = 0,0533). This finding supports the related literature [DeWeese, 2014; Cecutti, 2021; Aru, 2022], suggesting that excessive smartphone use can lead to a decrease in split attention abilities and a lower level of cognitive control as users are constantly switching between tasks and stimuli. We drew scatterplots to visualize the predictive structure across the age and sex groups, as shown in Fig. 5.
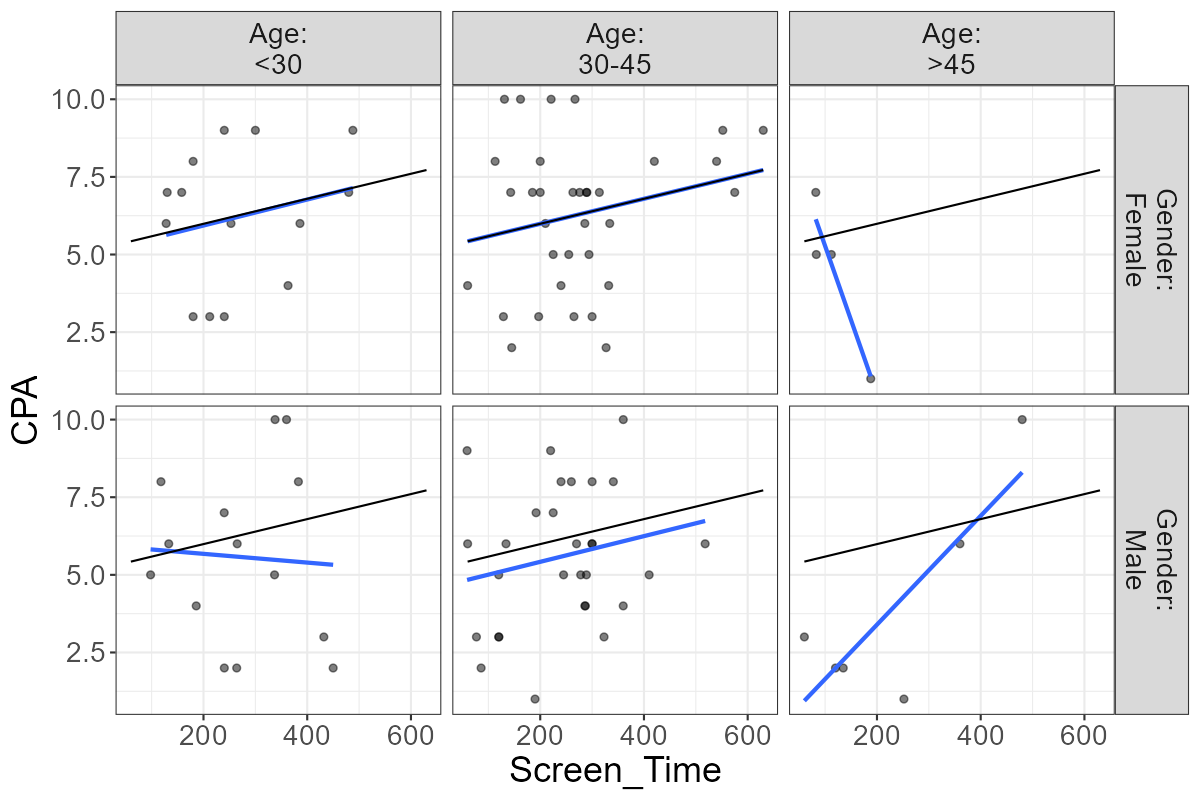
A regression line was used as the fitted line in the scatterplots. Graph analysis revealed that the regression line for students aged 30–45 years was consistent with the average regression line. The same was true for females under the age of 30 years. However, the CPA scores of male students aged under 30 years changed inversely with screen time. This difference among younger students can be investigated in future studies; as only a few participants were aged over 45 years, a comparison could not be made.
Conclusions
This study makes an original contribution by establishing a predictive relationship between prolonged smartphone screen time and continuous partial attention. To the best of our knowledge, this is the first study to explicitly explore this relationship among graduate students using real-time screen data. Our findings advance the understanding of how digital behavior impacts attention span.
The findings of this research showed that master’s and doctoral students had an average of 6 hours and 15 minutes of smartphone screen time per day, which is higher than the averages recently found by A. Osailan [Osailan, 2021] and S.M. Föckel [Föckel, 2022] for the 18–30 age group. Comparisons by demographic characteristics showed no statistically significant differences between the groups, although those younger than 30 years had a higher screen time and lower mean CPA.
Photo Sharing and Messaging App had the highest total weekly screen time, Streaming Platform had the highest overall screen time, and Short Video Platform had the highest average CPA. In the focus group interview, the students identified four themes related to the Short Video Platform app (hypnotic algorithm, passive receiver mode, short video flow, and surprise content) and two themes related to the content structure (distracting redundancy and marketing and advertising) that could account for the findings.
The main hypothesis of this study is that the PSST predicts CPA. Correlation and regression analyses showed that DASST positively and significantly predicted students’ CPA, thus supporting H1 and rejecting H0. However, this predictive impact did not differ significantly according to sex, age, or education level. Interestingly, screen time had a negative correlation with the average CPA of male students younger than 30 years.
The literature presents three main perspectives on the effects of smartphone screen time on attention: a negative effect [Aru, 2022; Föckel, 2022], an insignificant effect [Cecutti, 2021; Wilmer, 2017], and a negative effect depending on the situation [Sela, 2022]. While the predictive relationship between DASST and CPA in this study supported the negative effect perspective, the results of the focus group interview supported the situational effect perspective, emphasizing that this effect occurred in the unaware-use mode.
Limitations
This study had two limitations. First, CPA was measured using a single-item scale. The rationale for this is that valid and reliable measurement techniques for CPA are rare in the literature. Second, this study was based on a specific sample of postgraduate students in a particular country at a specific time.
Recommendations
These findings highlight the practical need for educational interventions focusing on digital literacy and mindfulness training. Such programs could help students manage the cognitive demands of prolonged smartphone use, thereby improving their focus and academic performance.
Future studies should employ direct measurement strategies for CPA. One potential method is to take screenshots of weekly reports with the necessary permissions to reduce errors. One study used a mobile app to automatically record screen time in the background [Christensen, 2016]. While the fear of missing out (FOMO) is similar to CPA but focused on fear rather than poor performance due to a lack of focus, FOMO can also be used as a predictor of CPA. H. Scott and H.C. Woods [Scott, 2018] found that FOMO is a key predictor of social media and problematic smartphone use. Huang et al. [Huang, 2022] studied smartphone stress, which is related to prolonged smartphone use and CPA, and identified six contributing factors: poor information and communication, unmet recreational motivation, online learning burden, social worries, pointless and overloaded alerts, and online verbal attacks. Future research should explore the relationship between these factors and CPA using structural equation modeling.