Introduction
Every child deserves to grow up in a safe environment, free from the pervasive threat of bullying and prejudice [Alabdulrazaq, 2020]. The prevalence and detrimental impact of bullying among children and adolescents necessitate serious attention and comprehensive action [Alotaibi, 2022]. To combat this pervasive issue effectively, it is imperative to develop interventions that address the diverse forms of bullying, including physical, verbal, social, and cyberbullying [Allport, 1954]. Additionally, these interventions should be firmly grounded in established theoretical frameworks to provide a clear understanding of their underlying mechanisms and unique contributions to the field [Alrokban, 2019]. Despite significant progress in research and intervention efforts, a critical examination of existing literature reveals the need for interventions that go beyond conventional approaches. This study aims to contribute to the existing body of knowledge by presenting a novel bullying and prejudice intervention that offers a distinctive theoretical rationale and differentiation from previously published interventions [Gaffney, 2019].
At the core of our intervention lies a robust theoretical foundation based on prominent theories related to bullying and prejudice [Muijs, 2017]. Drawing from the social learning theory, social cognitive theory, and the social-ecological model, our intervention seeks to address bullying as a complex interplay of individual, social, and environmental factors [Muijs, 2017]. By incorporating these theories, we aim to develop targeted strategies that not only address the immediate bullying behaviors but also consider the broader social context that perpetuates and sustains such actions [Srinivasan, 2022].
The intervention that will be used in the current study stands apart from prior efforts due to its incorporation of innovative and tailored components [Types of Bullying, 2022]. Through extensive research and analysis, specific strategies that directly target the diverse forms of bullying prevalent among schoolchildren have been identified [What Is Cyberbullying, 2022]. The intervention encompasses a comprehensive approach that includes individual-level skill-building, fostering social support networks, and promoting positive school environments [Who Is at, 2022].
In contrast to earlier interventions, which may have focused primarily on certain types of bullying or specific age groups, our intervention seeks to comprehensively address the varying needs of diverse populations [Gaffney, 2019]. By conducting a thorough comparative analysis with previously published interventions, we highlight the distinctive attributes that position our approach as a pioneering effort in the field [Midgett, 2020]. This study strives to advance our understanding of how to effectively reduce bullying and prejudice by examining the intervention's theoretical underpinnings and unique components [Thompson, 2017]. By explicitly elucidating the rationale behind our strategies, we aim to shed light on the underlying mechanisms that drive behavioral change and ultimately contribute to lasting positive outcomes [Lerner, 2011]. Through the identification of limitations in previous interventions and empirical research, we recognized a significant research gap that inspired the development of our intervention [Gaffney, 2019]. With a focus on empowering schoolchildren to become active defenders against bullying and prejudice, we seek to address the dearth of comprehensive interventions targeting multiple forms of bullying and diverse populations [National Centre Against, 2022].
We acknowledge potential challenges and constraints in implementing our intervention [Chatters, 2012]. By transparently discussing these limitations, the study aims to foster a deeper understanding of the complexities associated with anti-bullying efforts and provide valuable insights for future research and development [Bronfenbrenner, 1979].
Embarking on this pioneering study, our motivation is rooted in the belief that our innovative intervention targeting bullying and prejudice will offer a valuable addition to the field [Bandura, 1977]. By grounding our strategies in well-established theories, differentiating our approach from existing interventions, and addressing the specific needs of diverse populations, we are confident that our research will help advance the collective efforts to create safe and inclusive environments for all children and adolescents [Shaheen, 2017]. Therefore, the study looked at an exploration of participants' perceptions towards both behaviors involved in assessing their feelings about bullying behavior, as well as their concerns regarding prejudice. Additionally, the study aimed to identify the participants' subjective emotions concerning these behaviors.
Significance of the study
This study explores the effectiveness of a prevention program on bullying and prejudice among adolescents. It is significant as the findings can contribute to evidence-based strategies for ending bullying behavior. Educators, policymakers, and practitioners should take note of the study's insights to reduce instances of bullying and promote positive social relationships among adolescents. Bullying has severe consequences, so understanding the impact of prevention programs is crucial. The study can help develop programs that effectively target underlying behaviors and attitudes.
Moreover, the study reveals the link between bullying and prejudice, emphasizing the need for prevention programs to tackle biases and promote tolerance. This can create a more inclusive society. The study has significant implications for designing effective interventions and strategies to combat bullying and create safer environments for adolescents.
Theoretical and conceptual framework of the study
Our bullying prevention program is based on a combination of several theoretical frameworks, including Bandura's Social Learning Theory [Baiden, 2020], Social Cognitive Theory [Bandura, 1986], and the Social-Ecological Model [Allport, 1954]. The program aims to empower teenagers and reduce bullying behavior and prejudice by addressing cognitive functions, intergroup communication techniques, systems of ecology, and positive youth development [Palade, 2023]. The conceptual model integrates these theories, utilizing a feedback loop to examine the effects of the program on mediating variables, such as cognitive processes, intergroup relations, and ecological influences, offering a comprehensive understanding of the dynamics among adolescents.
Definition of study variables:
- "Bullying is the deliberate misuse of power through repeated harmful behavior, affecting individuals or groups who feel powerless to stop it [Bowes, 2019].
- Discrimination is unfair treatment based on characteristics like race, gender, age, or sexual orientation [Johnson].
- Attitude refers to enduring beliefs and feelings towards social objects, while knowledge is information gained through experience [Alsaleem, 2021; Moore, 2017].
- An educational program is a structured set of activities to achieve learning goals [Salmon, 2018].
- Prejudice is forming opinions about others based on group membership, such as ethnicity, gender, or religion [Reisen, 2019].
Aim of the study:
The primary objective of the present study was to examine the effects of a training prevention program in reducing incidents of bullying and prejudice among adolescents attending 103 schools in Jeddah, Saudi Arabia.
Specific objectives:
- Evaluate the students' knowledge and attitudes regarding bullying and prejudice behavior before and after the implementation of the intervention program in both the experimental and control groups.
- Investigate the relationship between knowledge and attitudes towards bullying and prejudiced behavior in both groups.
- Compare the experimental and control groups in terms of their knowledge, attitudes, empathy, and their willingness to intervene in instances of bullying and prejudice before and after the intervention program.
- Examine the potential associations between students' demographic backgrounds and their knowledge and attitudes towards bullying and prejudiced behavior, both before and after the training program.
This study seeks to answer the following research questions:
Research Question 1 (RQ 1): What was the effect of the prevention training program on the knowledge of adolescent students before and after the training intervention?
Research Question 2 (RQ 2): What was the impact of the prevention training program on prejudicial attitudes and skills related to bullying behavior before and after the educational training?
Research Question 3 (RQ 3): How did the demographic characteristics of the participants influence the effects of the pre-post educational training on bullying behavior prevention?
Materials and methods
Study area/setting and subjects:
A girls' school in Jeddah, Saudi Arabia was selected for a study on bullying and prejudice. The school, known as School 103, has 18 classes with an average of 19-22 students in each class. Jeddah's diverse population adds complexity to social interactions, and the city's educational landscape plays a crucial role in shaping students' experiences. Understanding the local context is crucial for effective intervention against bullying and prejudice.
Study design:
A randomized experimental study design was employed to investigate the hypothesis concerning the knowledge and attitudes of middle-level education adolescents in reducing bullying and prejudice behaviors among them. This research design was considered suitable for establishing a cause-effect relationship because it allowed the researchers to actively ensure that the two groups of participants were equivalent in terms of their characteristics and other potential confounding factors.
Sample size and sampling technique
A power analysis was conducted to validate the sample size of 180 students, ensuring statistical power for detecting effects. By inputting our chosen significance level (α) set at 0,05, power (1−β), and an estimated effect size into the calculator, we were able to determine the minimum sample size necessary to achieve our research objectives. This calculation served as a crucial step in validating the robustness of our research design, reinforcing our commitment to conducting a study that is both methodologically sound and capable of producing meaningful and statistically significant findings.
A purposive convenient sampling technique was used to select middle-level education students from a school in Jeddah, Saudi Arabia. The sample included 60 students from grades 7, 8, and 9 each, with random assignment into control and intervention groups. Approval from students, parents, and the school principal was obtained to ensure ethical participation. Transparent permissions and collaborative efforts emphasized methodological and ethical integrity in the research.
Data collection instrument:
The tools of the current study consist of 3 main tools as the following:
- The demographic characteristics: The research segment pertaining to demographic characteristics obtained data on participants' age, academic standing, country of origin, parental education level, place of residence, family's socioeconomic status, family size, and sibling birth order. Additionally, it investigated their engagement in anti-bullying initiatives and their encounters with bullying or prejudice, with the objective of exploring the influence of demographics on these matters. This analysis contributes to the enrichment of the study's results.
- Bullying amongst diverse populations (badp) evaluation scale. The bullying and Prejudice Assessment Questionnaire, known as BADP, was originally developed by [Hu, 2021]. The BADP questionnaire consists of six subscales that assess knowledge of prejudice and bullying. These subscales include knowledge, skills, efficacy, likelihood of intervention, perceived participant role, and frequency of encounters and intervention in bullying and prejudice situations. The participants rated their responses on a 7-point Likert scale, ranging from 1 (not at all) to 7 (extremely high), to evaluate their knowledge, abilities, feelings, attitudes, and the likelihood of intervention. The frequency of experiences and interventions in bullying and discrimination situations were also rated on a 7-point Likert scale, ranging from 0 (never or very rarely) to 5 (4-7 times a week). Sample questions from the BADP included assessing the participants' understanding of bullying, various forms of bullying, and different approaches to dealing with bullying. The participants were also asked to rate the frequency of their encounters with specific bullying behaviors, such as physical harm or the use of derogatory language.
According to Ishiyama's study, Cronbach's alpha for each measure in the BADP were as follows: Knowledge (0,73), Skills (0,74), Efficacy (0,66), and Intervene (0,66). These scores indicate the reliability of the measures in assessing the relevant constructs.
- Basic empathy scale. The Basic Empathy Scale (BES), developed by [Ishiyama, 2011], was employed in the current study. The purpose of the BES is to gauge both cognitive and affective empathy, evaluating individuals' capacity to understand and share the emotions of others. This measurement tool comprises 20 statements, which participants rate on a 5-point Likert scale spanning from 1 (strongly disagree) to 5 (strongly agree). The BES is comprised of two subcategories: Affective Empathy and Cognitive Empathy. To determine the overall BES score, the scores from these two subcategories are combined. The Cronbach's alpha values for the cognitive and affective subscales of the BES were found to be α=0,79 and α=(value missing from the provided information), respectively, indicating good internal consistency reliability. The scale also demonstrated significant factorial validity and reliability [National Centre Against, 2022]. The BES was administered to participants both before and after the treatment, as well as to the control group.
Validity and reliability
The BADP evaluation scale and BES survey were selected to assess changes in knowledge, attitudes, behaviors, and empathy levels before and after the intervention. These tools have been proven to be valid and reliable in measuring the relevant constructs. The BADP scale by Ishiyama [Muijs, 2017] covers various aspects including knowledge, skills, efficacy, intervention likelihood, participant role perception, and frequency of encounters related to bullying and prejudice. It exhibits acceptable internal consistency and reliability, making it suitable for this study. Similarly, the BES by [Ishiyama, 2011] evaluates cognitive and affective empathy with good internal consistency reliability and factorial validity.
Furthermore, these measurement instruments underwent a meticulous process of translation, back-translation, and pilot testing in Arabic to ensure cultural appropriateness and linguistic clarity for the target audience. The pilot study indicated high internal consistency reliability scores as measured by Cronbach's Alpha, was reported at 83,5 for knowledge, 83,7 for skills, 87,8 for efficacy, 84,8 for intervention, and 70,8 for empathy scales., further authenticating the Arabic version of the questionnaire for evaluating knowledge, attitudes, and behaviors concerning bullying and prejudice among adolescents.
In summary, these chosen tools provide a strong foundation for assessing the effectiveness of the prevention program due to their comprehensive nature, validity, reliability, cultural sensitivity, and ability to track changes over time.
Data collection procedure:
The data collection process was initiated subsequent to obtaining official approvals from CONJ, KAIMRC, and IRB. Students in grades 7, 8, and 9 were invited to participate following consent from themselves, their parents, and the school principal. A total of 180 students were evenly distributed into control and intervention groups through random assignment utilizing a random number table.
Each student was allocated a unique code for identification purposes during group allocation. The researchers conducted training sessions focusing on the identification, prevention, and intervention of bullying incidents, as well as addressing biases. These sessions included the use of PowerPoint presentations and handouts, with precautions taken to minimize researcher bias.
Subsequent to the training, evaluations were conducted and collected by a different team member to reduce bias. The training program spanned six hours over two sessions, covering various aspects of bullying and prejudice prevention. To accommodate logistical constraints, students were divided into morning and afternoon sessions, with the researchers ensuring comprehensive instruction during both periods.
All students convened for theoretical discussions, while clinical training took place in smaller subgroups to provide personalized attention. Despite facing logistical challenges, the methodology effectively met the students' schedules, offering an inclusive and impactful learning experience for all participants.
Prevention Program
The prevention initiative, known as 'Building Bridges', presents a range of components designed to tackle bullying and prejudice among adolescents effectively:
- Educational Workshops: These workshops provide a thorough grasp of bullying and prejudice through multimedia presentations, discussions, and real-life scenarios. Participants gain insights into various manifestations of bullying and prejudices, thereby increasing their awareness and empathy.
- Empathy and Emotional Intelligence Training: Tailored modules are utilized to nurture empathy and emotional intelligence through role-playing activities and guided discussions, fostering compassion and understanding among the participants.
- Enhancing Assertiveness and Conflict Resolution Skills: The training in conflict resolution equips participants with the tools to respond assertively in bullying situations while upholding respect for others. Through role-playing exercises and debriefing sessions, individuals can practice assertive responses and conflict-resolution techniques.
- Practical Exercises:
- Practicing "I-Statements": Participants are taught how to express feelings and needs assertively.
- Active Listening Drills: Participants engage in pair exercises to enhance active listening skills.
- Role-playing Conflict Resolution Scenarios: Simulated conflicts guide participants through steps toward resolution.
- Assertive Communication Practices: Analyzing assertive versus aggressive behaviors in simulated videos helps participants refine their communication skills.
- Fostering Inclusivity and Appreciation for Diversity: Activities are structured to promote understanding and appreciation for diversity, creating an inclusive environment that values each individual's contributions.
- Establishing Safe Environments: Special focus is given to creating secure spaces within schools where participants can openly discuss their experiences and seek assistance from trained facilitators or counselors.
- Peer Support and Defenders Training: Participants receive training on intervening safely in bullying incidents to support victims, reinforcing positive behaviors within peer groups.
- Engaging Families and Communities: Teachers collaborate with parents and caregivers to extend program principles beyond school hours. Community events aim at fostering collaboration in eradicating bullying and prejudice.
In essence, 'Building Bridges' provides a comprehensive strategy for preventing bullying and prejudice by integrating education, skill enhancement, inclusivity promotion, as well as community engagement efforts.
Control group:
In contrast, the control group refrained from engaging in the preventive training program. Their participation was confined to the completion of pre-test and post-test questionnaires exclusively.
Data management and analysis plan:
The collected data were coded and analyzed using the latest version of the statistical software SPSS. Descriptive statistics such as frequencies, percentages, means, and standard deviations were calculated to summarize the data. Independent sample t-tests were performed to compare the item means of knowledge evaluation between the experimental group and the control group. Additionally, paired t-tests were conducted to analyze the changes in total knowledge, attitudes, empathy, and practice role scores within the participants' responses from the pre-test to the post-test. Statistical tests appropriate for assessing the association between the participants' sociodemographic variables and the study variables were employed, with a significance level set at p<0,05.
Ethical considerations:
The study underwent a formal approval process, beginning with submission to the research unit at the College of Nursing, Jeddah, KAIMRC, and IRB (NO. SP22J/065/06). After receiving approval, the study was then submitted to the Ministry of Education for further approval. Once the necessary approvals were obtained, the principal of the 103 schools was approached to seek approval from the parents of the students. The study subjects were then informed about the study's purpose and procedure. They were assured that their participation was voluntary and that they had the right to withdraw from the study at any time without facing any penalties. It was emphasized that their responses would remain anonymous and their data would be kept confidential within the records and office of NGHA.
Results
Table 1 The participant demographics of the study revealed no significant differences between the Experimental and Control groups in terms of age, nationality, and family size. However, a significant difference was found in the distribution of average income and participants attending workshops within the school. It is worth noting that more than half of the participants in both groups attended workshops overall, with no significant differences between the two groups.
Table 2 Outlined the distribution of participants based on their encounters with bullying and prejudice. Within the Experimental group, 68,2% reported instances of bullying from classmates, while in the Control group, 60,6% indicated being bullied by 59,5% of their peers. Although there was no statistically significant variance in overall exposure to bullying between the two groups, notable differences were evident in specific instances of bullying.
Significant variances emerged between the Experimental and Control groups concerning item no. 2, which pertains to physical actions such as kicking or pushing others, and item no. 4, which encompasses racial slurs or stereotypes directed at individuals, with p-values of 0,010 and 0,021, respectively. However, no significant distinctions were noted between the groups for other aspects related to experiences of bullying. In terms of participants' engagement in bullying behaviors, no significant differences were detected between the Experimental and Control groups.
Figure 2 demonstrated the comparison of roles perception in the pre- and post-assessment between the Experimental and Control groups. In the Experimental group, prior to intervention, percentages were as follows: 2,4% identified as bullies, 29,8% as victims, 28,2% as defenders, and 42,9% as witnesses. Following the intervention, these figures notably shifted to 0,0% as bullies, 7,1% as victims, 61,9% as defenders, and 31% as witnesses.
On the other hand, the Control group exhibited pre-assessment percentages of: 11,3% as bullies, 26,8% as victims, 33,8% as defenders, and 28,2% as witnesses. Post-assessment results indicated a change to 2,8% identified as bullies, 4,2% as victims, 28,2% as defenders, and a significant increase to 64,8% assuming the witness role.
Both groups experienced a transformation in their perception of roles post-intervention with a reduction in negative roles (bullies and victims) and an elevation in positive roles (defenders and witnesses). Notably, the Experimental group demonstrated a more substantial increase in defenders and a decrease in victims compared to the Control group which showed a higher proportion of participants transitioning into the witness role during post-assessment analysis.
Table 3 shows the comparison between the experimental group (N=84) and the control group (N=71) in various domains including knowledge, communication skills, attitudes, ability to intervene, and empathy was detailed in the table both before and after the intervention. Both groups demonstrated significant enhancements across all domains post-intervention with highly significant p-values (P<0,001) indicating improvements in total knowledge score, communication skills, attitudes, ability to intervene, and empathy.
Large to medium effect sizes (r) ranging from -0,563 to -0,854 for the experimental group and from -0,017 to -0,802 for the control group underscored the substantial impact of the intervention on these domains. The control group generally displayed lower post-intervention scores compared to the experimental group in all areas, signaling the effectiveness of the intervention.
Notably, while the control group exhibited noteworthy improvements in total empathy, particularly in affective emotional empathy and cognitive emotional empathy, the effect sizes were relatively smaller than those of the experimental group. Overall, these results suggest that participants' knowledge, communication skills, attitudes, ability to intervene, and empathy were effectively enhanced by the intervention, with greater improvements observed in the experimental group over the control group.
Table 4 compares the abilities of participants in an experimental and control group (N=155) to perceive their role in addressing bullying behavior and prejudice, both in the past and presently. Results indicate significant improvements in perception within both groups from the past to the present, with mean scores increasing in both experimental (from 2,9048 to 3,5476) and control (from 2,7887 to 3,5493) groups. Paired t-tests confirm the statistical significance of these improvements (p<0,001), with t-values of -6,028 for both groups. These findings suggest that the intervention in the experimental group, alongside potential external factors, has positively influenced participants' abilities to perceive their role in addressing bullying and prejudice.
Table 5 displayed a significant disparity emerged in knowledge levels based on the level of study (χ²=10,093, p=0,006*), notably with participants in Level 7 exhibiting higher inadequate knowledge in the experimental group. However, other factors such as nationality, age, family size, and income do not show significant differences. The data suggests that certain demographic characteristics may influence knowledge levels differently depending on the group and the specific characteristic at P>0,05.
Table 6 indicate significant associations between sociodemographic factors and communication skills within the experimental and control groups. Notably, family size significantly impacts communication skills, with participants from families with 3-7 members demonstrating higher competence compared to those with 8-16 members (χ²=5,490, p=0,019*). Furthermore, participants in Level 7 exhibit lower competence in communication skills compared to Levels 8 and 9 in the experimental group (χ²=4,334, p=0,114), while a similar trend is observed in the control group (χ²=4,175, p=0,124). While other factors such as nationality, age, and income do not show significant differences.
Table 7 shows that the Significant differences in attitude are observed based on the level of study in both groups (experimental: χ²=9,447, p=0,009*; control: χ²=2,329, p=0,312), particularly with Level 7 participants in the experimental group exhibiting significantly more negative attitudes. Income significantly influences attitude in the experimental group (χ²=7,948, p=0,047*), with low-income backgrounds associated with more negativity. While other factors such as nationality, age, level of parent education do not reach statistical significance, suggesting potential avenues for targeted interventions to address attitude differences among participants.
Table 8 showed that significant differences in intervention ability are observed based on the level of study in both groups (experimental: χ²=13,804, p=0,001*; control: χ²=2,064, p=0,356). Participants in Level 7 in the experimental group exhibit significantly lower intervention ability compared to those in Levels 8 and 9, other factors such as nationality, age, family size, and income do not exhibit significant differences. The data suggests that certain demographic characteristics may influence intervention ability differently depending on the group and the specific characteristic.
Table 9 Significant differences in affective domain of empathy are observed based on the level of study in the experimental group (χ²=5,361, p=0,069), with participants in Level 7 showing significantly lower positivity compared to other levels. while other sociodemographic factors like nationality, age, family size, and income do not exhibit significant differences. These findings suggest potential variations in empathy levels based on certain demographic characteristics, emphasizing the need for targeted interventions to enhance empathy across different groups.
Table 10 shows that the significant differences in cognitive domain of empathy are observed based on the level of study in both groups (experimental: χ²=10,009, p=0,007*; control: χ²=14,954, p=0,001*). Participants in Level 7 in both groups exhibit significantly lower empathy compared to other levels. while others such as nationality, age, family size, and income do not exhibit significant differences. These findings suggest potential variations in empathy levels based on certain demographic characteristics, indicating the importance of tailored interventions to foster empathy across different groups.
Table 11 examines sociodemographic factors impacting empathy levels. No significant difference in empathy is seen across study levels in the experimental group (χ²=0,967, p=0,617), but a significant variation is noted in the control group (χ²=2,989, p=0,224), where Level 7 participants exhibit higher empathy. These results emphasize the intricate nature of empathy and its connection to demographic traits, highlighting the need for tailored empathy-building strategies for diverse populations.
In Figure 3, the Experimental group, post-intervention, showed substantial improvements across various metrics. 83,3% demonstrated satisfactory knowledge, 79,8% exhibited competent communication skills, 70,2% showcased positive attitudes, and 79,8% displayed enhanced abilities to intervene and manage bullying situations. Conversely, the Control group, despite not receiving intervention training, also showed significant improvements from pre-intervention to post-intervention, though specific numbers aren't provided.
Figure 4 depicts the Experimental group across-the-board improvements in empathy domains post-intervention. Pre-intervention, percentages for empathy domains were 45,2%, 38,1%, and 35.7%, respectively, which increased to 54,0%, 61,9%, and 64,3% post-intervention. Surprisingly, the Control group had higher scores in all empathy domains during the pre-assessment, with percentages of 53,5%, 54,9%, and 57,7%, respectively. However, these scores declined to 46,5%, 45,1%, and 42,3%, respectively, in the post-assessment.
Discussion
The study presents the results of an experimental investigation that examined the efficacy of a bullying prevention program in a girls' school in Saudi Arabia. It provides an overview of the prevalence of bullying among school children, their knowledge regarding bullying, and their capacity for empathy towards others. The findings related to the first research question (RQ 1), assessing the impact of the prevention training program on the knowledge of adolescent students before and after the intervention, are presented in Table 3. The study found that the prevention training program effectively contributed to a reduction in both bullying experiences and witness accounts among students in the experimental group. A statistically significant decrease in the occurrence of these two aspects was observed within the experimental group in comparison to the control group.
The studies provide evidence for the value of implementing such programs to address bullying among adolescents. The findings of the study presented in Table 3 show significant differences observed in several items within the experimental group, but no significant differences were detected in cognitive emotional empathy, effective emotional empathy, and total empathy. The observed reduction in bullying experiences among the experimental group had a moderate effect size (d=0,47, p<0,001), indicating a meaningful but not overwhelming impact of the prevention program. A similar outcome was reported by [McLeod] in their study on a bystander intervention program aimed at reducing bullying in an ethnically diverse, low-income community school. They found a significant increase in knowledge and confidence, as well as a significant decrease in bullying behavior among students who underwent the training.
Moreover, the impact of a prevention program on bullying behavior and empathy reported that the program effectively increased knowledge and enhanced attitudes related to bullying, but did not have a significant impact on cognitive-emotional empathy, effective emotional empathy, and total empathy. The effect sizes for knowledge, communication skills, and attitudes regarding bullying and empathy were moderate to large, indicating practical significance. However, the specific components of empathy assessed in the study may require more time or a different approach to be effectively influenced by the prevention program.
A study by [Šmigelskas, 2018] found that bullying prevention programs may not lead to significant changes in empathy. Our study's results align with this, as empathy did not differ significantly between the experimental and control groups. Empathy is complex and influenced by various factors, making it challenging to measure. More research is necessary to evaluate long-term improvements in empathy after intervention and to gain a deeper understanding of how empathy evolves during the program. The conclusion of this study regarding empathy outcomes may not be definitive based solely on its findings. However, it highlights the need for more research and improvement of programs that aim to promote empathy in teenagers. It is worth noting that the current study's results are in contrast to previous research, which has shown positive effects of prevention programs on empathy. For example, [Thompson, 2017]) conducted a study on a bullying prevention intervention and found that it led to improvements in empathy among the participants. Similarly, [Smith, 2020] reported positive effects on empathy-related outcomes among students as a result of a school-based intervention. However, some studies have yielded contrasting results. For instance, a survey by [Herman, 2020] found that although a prevention program resulted in significant changes in attitudes and behaviors related to bullying, there were no notable differences in knowledge scores. This suggests that educational interventions' impact on knowledge may vary depending on the specific program content, duration, and implementation. It is important to consider that knowledge alone may not be sufficient to bring about substantial changes in attitudes and behaviors related to bullying. Comprehensive prevention programs often aim to address multiple factors, such as promoting empathy, enhancing communication skills, and fostering positive school environments. [Farrington, 2010] conducted a study evaluating a school-based bullying prevention program and found a significant increase in knowledge scores among participants who received the intervention.
Moreover, the study found that the educational program was successful in improving students' understanding of bullying. The intervention program was effective in reducing bullying behaviors and promoting positive role models. Participants perceived themselves as defenders instead of bullies or victims. The bystander behavior also shifted positively, indicating increased proactive intervention against bullying incidents. These changes support the effectiveness of the intervention program in fostering a safe school environment.
The Control group undeniably demonstrated a decrease in negative roles, which strongly implies the influence of external factors on the participants' perceptions. It is crucial to note that a higher percentage of participants in the Control group took on the role of witnesses in the post-assessment, indicating a clear and significant improvement in their awareness of the importance of witnessing and reporting bullying incidents, without the need for direct intervention training. This behavior change is indisputably in line with the Hawthorne effect. It is highly probable that external factors, such as conversations or community-wide initiatives, had a profound impact on the changes observed in the Control group.
Table 1 presents how the demographic factors impacted the effectiveness of pre-post educational training on preventing bullying behavior. The study revealed that the control and experimental groups did not have significant differences in most demographic variables, indicating that the randomization process created comparable groups. However, two demographic variables, income, and the location of the bullying workshops, showed significant differences between the two groups. The income disparity may lead to differences in participants' experiences, perspectives, and available resources, and must be considered when interpreting the study's results. Further investigation is necessary to identify the factors that caused this shift. It's important to note that the unequal distribution of participants between the groups may have introduced bias, despite the lack of a significant difference between them. Therefore, advanced statistical techniques such as propensity score matching, covariate adjustment, subgroup analyses, and sensitivity analyses are necessary to account for differences between the groups and ensure reliable results. Accurate reporting of participant characteristics is essential to interpret the study's findings and draw valid conclusions.
According to the study, there were notable discrepancies in the placement of bullying workshops between the control and experimental groups, which could potentially hinder the program's implementation and necessitate a thorough analysis. It is recommended that further investigation be conducted to examine the impact of variables such as income levels on the outcomes and to make adjustments accordingly. By exploring the interaction between variables and the training program, valuable insights could be gained into their capacity to moderate the effects of reducing bullying and prejudice among adolescents. The study also recognizes that focusing solely on one elementary school for girls with common characteristics may have influenced the findings, particularly with regard to demographic variables. The experimental group consisted of a larger percentage of students from affluent backgrounds, which could be attributed to their parents' educational attainment.
The findings of this study are in line with previous research such as Shaheen et al.'s [Salmivalli, 2011] study on factors affecting bullying experiences among Jordanian school adolescents. The study revealed that low-income families experienced higher levels of bullying. Furthermore, the study suggests that parental education plays a significant role in participation in Bullying Awareness Workshops, particularly in the experimental group [Gordon, 2022; Orben, 2020].
Another significant result indicated by the study is that most of the participants in both the experimental and control groups reported experiencing bullying mainly from their classmates. This finding is consistent with several similar studies in the field. For instance, [Pettigrew, 2006]; and Santos-Neto's ETD study on bullying among adolescents found that classmates were the most common perpetrators of bullying. Similarly, [Smith, 2020] reported that peer victimization was predominantly carried out by classmates. These studies provide further support for the idea that classmates play a significant role in perpetuating bullying behaviors. However, some studies have reported different results regarding the source of bullying. For example, a study by [Chatters, 2012] revealed that adolescents' bullying can originate from multiple sources, including not only classmates but also friends, siblings, and even strangers. This study suggests that the sources of bullying may vary depending on the specific context and individual experiences.
It is crucial to take into account cultural and contextual factors that can impact research findings. For example, [What Is Cyberbullying, 2022] discovered in a study conducted in a different cultural context that adolescents were more frequently bullied by their friends than their classmates. This difference emphasizes the significance of cultural diversity when interpreting and generalizing findings related to the sources of bullying. The study "Bullying among children and adolescents in the SAARC countries: A scoping review" revealed that the school environment influences the pattern of bullying in settings where individuals have limited control over their groups. Bullying can occur among a diverse group of students, including indirect victimization and cyberbullying [Elmahdy, 2022; Roberts, 2017]. Bullies use their power to establish social status, while victims often lack emotional support or defenders. The study's findings suggest that higher-intensity conditions and pronounced hierarchies within classrooms are associated with an increased risk of persistent bullying. In summary, the study underscores the intricate nature of bullying in school settings and the factors that contribute to its occurrence and persistence.
Our study shows that the most common forms of bullying witnessed by participants were physical aggression such as kicking, hitting, or pushing, and verbal aggression using racial slurs or stereotypes. This aligns with previous research by [Alrokban, 2019]) who found that verbal bullying (41,7%) was the most prevalent type, followed by physical bullying (17,0%), among secondary school children. Similarly, [Salmivalli, 2011] survey of middle and high school adolescents found that girls were most commonly physically threatened or injured (22,1%) and experienced derogatory comments about their race or culture (20,9%).
Regarding our third research question (RQ 3), we found that only participants' educational study level significantly impacted their understanding of how to handle bullying and prejudice. This could be because higher levels of education equip individuals with greater knowledge about diversity, discrimination, and effective communication strategies, which in turn influence their attitudes toward bullying and prejudice. Previous studies by [Šmigelskas, 2018] have reported that individuals with higher levels of education possess more knowledge and skills when it comes to managing diversity, discrimination, and communication strategies. [Aldrup, 2022] have also shown that people with higher education levels tend to have more accepting attitudes towards marginalized groups, as education provides the tools to examine societal issues and cultivate empathy and understanding critically. However, [Jolliffe, 2006] found no consistent correlation between one's education level and ability to empathize. Nevertheless, exposure to diverse perspectives can foster greater understanding and compassion, which has the potential to positively affect attitudes toward bullying and prejudice. The study found that physical and verbal aggression, including racial slurs and stereotypes, were the most common forms of bullying [Yu, 2022] These findings align with previous research and highlight the need to understand the complex nature of bullying. [Demo, 1996] Additionally, further research could delve deeper into the relationship between education level and attitudes towards marginalized groups in the context of bullying and prejudice. Nonetheless, education and exposure to diverse perspectives can play a crucial role in promoting empathy, understanding, and acceptance, which are essential in combating bullying and prejudice behaviors [Abed, 2023].
Conclusion
The study found that a prevention program effectively reduced bullying among adolescents by improving their knowledge, communication skills, and attitudes. 79,8% of participants showed proficient communication during bullying incidents. Further research is needed on empathy aspects. The program emphasizes fostering positive social interactions and safer school environments by focusing on key factors like knowledge, communication, attitudes, and intervention abilities. Continued implementation of evidence-based prevention programs and support for adolescents in developing social-emotional skills are crucial for combatting bullying and promoting positive youth development.
Recommendations:
- The training prevention program effectively enhances knowledge about bullying and its prevention in educational settings.
- Follow-up assessments are recommended to evaluate long-term knowledge retention and monitor changes in empathy levels.
- Emphasizing empathy development is crucial in bullying prevention efforts. Integrating interventions to boost empathy can enhance the program's effectiveness.
- Assessing impacts on communication skills, attitudes, and behavioral outcomes related to bullying is essential.
- Future research should focus on exploring long-term effects and conducting follow-up assessments at different intervals.
- The study highlights the positive influence of the program on knowledge and emphasizes the importance of nurturing empathy in bullying prevention initiatives.
Research implications:
- The results suggest implications for future research and practical applications in bullying prevention programs.
- Subsequent studies should focus on longitudinal research to assess the lasting impact of prevention programs on knowledge, empathy, and behavioral outcomes.
- Identifying effective components of prevention programs can enhance knowledge in interventions.
- Further investigation into factors affecting empathy development, like program duration and facilitators, is also recommended.
Practical implications:
- The study highlights the need for evidence-based bullying prevention programs in education. Integrating empathy-building activities with knowledge-focused programs is recommended.
- Ongoing training for teachers can improve their skills in addressing bullying.
- Consistent implementation and evaluation of prevention programs are crucial.
- Future studies should focus on effective strategies for reducing bullying and fostering positive school environments.
Limitations of the study:
Despite the proven effect of the training prevention program, the study has several limitations:
- Limited generalizability due to unequal participant distribution and being conducted in one school.
- Focused only on girls, limiting conclusions for boys or mixed-gender settings.
- Lack of long-term follow-up to assess sustained effects.
- Participants not classified into bully, victim, or bully/victim groups for comprehensive analysis.
- Social desirability bias may have affected responses.
- Consider these limitations for interpreting findings and recommend further research with larger, diverse samples for improved validity and generalizability.
Table 1. Distribution of the studied participants according to their demographic characteristics N=155
|
Sociodemographic |
Experimental (n.84) |
Control (n.71) |
Test of significance |
||
|
No. |
% |
No. |
% |
||
|
Nationality |
|
|
|
|
|
|
Saudi |
51 |
60.7 |
46 |
64.8 |
X2: 0.273 P:0.601 |
|
Non-Saudi |
33 |
39.3 |
25 |
35.2 |
|
|
Age |
|
|
|
|
|
|
Early |
15 |
17.9 |
19 |
26.8 |
X2:2.102 P:0.350 |
|
Middle |
56 |
66.7 |
40 |
56.3 |
|
|
Late |
13 |
15.5 |
12 |
16.9 |
|
|
Mean ± SD |
13.52±1.0 |
13.37±1.2 |
|
||
|
No. of family |
|
|
|
|
|
|
3-7 |
64 |
76.2 |
54 |
76.1 |
X2:0.000 P:0.984 |
|
8-16 |
20 |
23.8 |
17 |
23.9 |
|
|
Mean ± SD |
6.7±1.8 |
6.4±2.0 |
|
||
|
Ranking |
|
|
|
|
|
|
1-3 |
46 |
54.8 |
40 |
56.3 |
X2:1.793 P:0.408 |
|
4-6 |
32 |
38.1 |
22 |
31.0 |
|
|
7 and more |
6 |
7.1 |
9 |
12.7 |
|
|
Level of study |
|
|
|
|
|
|
Level 7 |
22 |
26.2 |
26 |
36.6 |
X2:2.484 P:0.289 |
|
Level 8 |
32 |
38.1 |
20 |
28.2 |
|
|
Level 9 |
30 |
35.7 |
25 |
35.2 |
|
|
Father’s education |
|
|
|
|
|
|
Died |
10 |
11.9 |
6 |
8.5 |
X2:8.021 P:0.155 |
|
Elementary |
1 |
1.2 |
1 |
1.4 |
|
|
Middle |
7 |
8.3 |
5 |
7.0 |
|
|
Secondary |
14 |
16.7 |
21 |
29.6 |
|
|
University |
52 |
61.9 |
35 |
49.3 |
|
|
Post study (Master, PhD) |
0 |
0.0 |
3 |
4.2 |
|
|
Mother’s education |
|
|
|
|
|
|
Died |
13 |
15.5 |
8 |
11.3 |
X2:6.673 P:0.246 |
|
Elementary |
1 |
1.2 |
6 |
8.5 |
|
|
Middle |
8 |
9.5 |
4 |
5.6 |
|
|
Secondary |
15 |
17.9 |
12 |
16.9 |
|
|
University |
46 |
54.8 |
41 |
57.7 |
|
|
post study (Master, PhD) |
1 |
1.2 |
0 |
0.0 |
|
|
Income |
|
|
|
|
|
|
Average |
58 |
69.0 |
61 |
85.9 |
X2:8.042 P:0.045* |
|
Above average |
7 |
8.3 |
3 |
4.2 |
|
|
High |
10 |
11.9 |
6 |
8.5 |
|
|
Low |
9 |
10.7 |
1 |
1.4 |
|
|
Previous Attendance of bullying and racial discrimination training activities |
|
|
|
|
|
|
No |
39 |
46.4 |
33 |
46.5 |
X2:0.000 P:0.995 |
|
Yes |
45 |
53.6 |
38 |
53.5 |
|
|
Place of Attendance of bullying and racial discrimination training activities |
|
|
|
|
|
|
In school |
41 |
87.2 |
26 |
68.4 |
X2:4.445 P:0.035* |
|
Out of school |
6 |
12.8 |
12 |
31.6 |
|
Table 2. Distribution of the studied participants according to their experiences with bullying or prejudices N=155
|
Variables |
Experimental (n.84) |
Control (n.71) |
Test of significance |
||
|
O |
% |
No. |
% |
||
|
Previous Experience with bullying and racial discrimination |
|
|
|
|
|
|
No |
41 |
48.8 |
28 |
39.4 |
X2:1.369 P:0.242 |
|
Yes |
43 |
51.2 |
43 |
60.6 |
|
|
Who is the bully |
|
|
|
|
|
|
Classmate |
30 |
68.2 |
25 |
59.5 |
X2:0.794 P:0.672 |
|
Class teachers |
5 |
11.4 |
7 |
16.7 |
|
|
family member |
9 |
20.5 |
10 |
23.8 |
|
|
Previous Bullying Experience |
|
|
|
||
|
Witness Bullying Experience |
|
|
|
||
|
1- A person calls another person with inappropriate names |
2.4±1.8 |
2.9±1.9 |
t:-1.704 P:0.90 |
||
|
2. Someone kicks, hits, or pushes another person |
2.3±1.8 |
3.1±1.9 |
t:-2.597 P:0.010* |
||
|
3. Someone excludes another person from an activity or group. |
2.7±1.9 |
2.8±2.0 |
t:-.197 P:0.844 |
||
|
4- A person who uses racial slurs or stereotypes against others |
2.2±1.9 |
3.0±2.2 |
t:-2.339 P:0.021* |
||
|
5. Someone makes someone feel bad about themselves. |
2.6±1.8 |
2.9±2.2 |
t:-.949 P:0.345 |
||
|
6- Someone uses technology (social networks) against others |
2.5±2.0 |
2.7±2.2 |
t:-.693 P:0.489 |
||
|
Involved in Bullying Experience |
|
|
|
||
|
1- A person calls another person with inappropriate names |
2.9±1.7 |
2.6±1.7 |
t:1.197 P:.233 |
||
|
2. Someone kicks, hits, or pushes another person |
2.8±1.8 |
2.8±1.9 |
t:.062 P:.951 |
||
|
3. Someone excludes another person from an activity or group. |
2.4±1.7 |
2.5±1.9 |
t:-.493 P:.623 |
||
|
4- A person who uses racial slurs or stereotypes against others |
2.5±1.8 |
2.4±2.0 |
t:.333 P:.740 |
||
|
5. Someone makes someone feel bad about themselves. |
2.5±1.7 |
2.5±2.0 |
t:.121 P:.904 |
||
|
6- Someone uses technology (social networks) against others |
2.7±1.7 |
2.4±2.0 |
t:.775 P:.440 |
||
Table 3. Distribution and Comparison of Experimental (N=84) And Control Groups (N=71) According to Their Knowledge, Communication Skills, Attitudes, Ability to Intervene, And Empathy
|
Domains |
Experimental Group |
Sig. |
Control Group |
Sig. |
Significance between groups (EXP./CON) |
||||
|
Pre |
Post |
|
Pre |
Post |
|
Pre |
Post |
||
|
Total knowledge score |
42.4±21.9 |
80.1±27.8 |
t: --15.622 P<0.001* |
41.7±20.6 |
62.5±21.4 |
t-11.046 P<0.001* |
t.197 P. 844 |
t4.436 P<0.001* |
|
|
r (effect size) |
-0.85432 |
|
0.790278 |
|
|||||
|
Total communication skills |
46.0±22.1 |
67.0±27.2 |
t-12.411 P<0.001* |
49.2±25.3 |
71.0±22.8 |
t-9.896 P<0.001* |
t-.857 P.393 |
t1.244 P.215 |
|
|
r (effect size) |
-0.80914773 |
|
-0.81569847 |
|
|||||
|
Total attitudes |
44.0±26.3 |
73.5±31.5 |
t-10.929 P<0.001* |
50.1±27.8 |
64.1±25.5 |
t-5.232 P<0.001* |
t-1.404 P.162 |
t2.053 P.042* |
|
|
r (effect size) |
-0.5631279 |
|
-0.8026054 |
|
|||||
|
Total ability to intervene |
53.8±26.0 |
77.5±28.2 |
t-11.920 P<0.001* |
57.5±28.0 |
72.9±24.9 |
t-6.356 P<0.001* |
t-.863 P.390 |
t1.072 P.285 |
|
|
r (effect size) |
-0.63528422 |
|
-0.80293273 |
|
|||||
|
Total affective emotional empathy |
53.0±14.0 |
54.6±17.0 |
t-.868 P 0.388 |
55.7±13.7 |
48.9±15.0 |
t3.117 P 0.003* |
t-1.209 P.229 |
T2.199 P.029* |
|
|
r (effect size) |
-0.34654 |
|
-0.06350141 |
|
|||||
|
Total cognitive emotional empathy |
55.7±13.6 |
57.7±13.4 |
t-1.121 P 0.266 |
58.2±14.9 |
46.6±14.7 |
t5.228 P<0.001* |
t-1.113 P.267 |
T4.917 P<0.001* |
|
|
r (effect size) |
-0.54425807 |
|
-0.150025
|
|
|||||
|
Total empathy |
54.3±11.6 |
56.2±13.1 |
t-1.221 P 0.225 |
57.0±12.8 |
47.7 ±13.2 |
t4.809 P<0.001* |
t-1.324 P.188 |
T3.955 P<0.001* |
|
|
r (effect size) |
-0.481596 |
|
-0.01745743 |
|
|||||
r: the effect size (small effect size 0,2, medium effect size 0,5, large effect size 0,8).
Table 4. Comparison between experimental and control group related to participants ’abilities to perceive their role in dealing with bullying behavior and prejudice N=155
|
Paired Samples Statistics |
|
|
||||||
|
Group |
Mean |
N |
Std. Deviation |
Std. Error Mean |
t |
Sig. (2-tailed) |
||
|
Experimental |
Pair 1 |
Abilities to perceive their role In the Past |
2.90
|
84 |
.80089 |
.08738 |
-6.028 |
.000 |
|
Abilities to perceive their role Now |
3.54 |
84 |
.62873 |
.06860 |
||||
|
Control |
Pair 1 |
Abilities to perceive their role In the Past |
2.78 |
71 |
.98439 |
.11683 |
-6.028 |
.000 |
|
Abilities to perceive their role Now |
3.54 |
71 |
.71292 |
.08461 |
||||
Table 5. Correlation between participants demographic characteristics among Exp. and Cont. group as regards their level of knowledge
|
Sociodegraphic |
Knowledge |
|||||||||
|
Experimental (n.84) |
Control (n.71) |
|||||||||
|
Inadequate |
Adequate |
Sig. |
Inadequate |
Adequate |
Sig. |
|||||
|
No. |
% |
No. |
% |
|
No. |
% |
No. |
% |
|
|
|
Nationality |
|
|
|
|
|
|
|
|
|
|
|
Saudi |
10 |
19.6% |
41 |
80.4% |
X2:.809 P:.369 |
20 |
43.5% |
26 |
56.5% |
X2: 1.647 P:.199 |
|
Non-Saudi |
4 |
12.1% |
29 |
87.9% |
7 |
28.0% |
18 |
72.0% |
||
|
Age |
|
|
|
|
|
|
|
|
|
|
|
Early |
2 |
13.3% |
13 |
86.7% |
X2: 1.231 P:.540 |
10 |
52.6% |
9 |
47.4% |
X2: 4.048 P:.132 |
|
Middle |
11 |
19.6% |
45 |
80.4% |
15 |
37.5% |
25 |
62.5% |
||
|
Late |
1 |
7.7% |
12 |
92.3% |
2 |
16.7% |
10 |
83.3% |
||
|
No. of family |
|
|
|
|
|
|
|
|
|
|
|
3-7 |
12 |
18.8% |
52 |
81.2% |
X2: .840 P:.359 |
23 |
42.6% |
31 |
57.4% |
X2: 1.994 P:.158 |
|
8-16 |
2 |
10.0% |
18 |
90.0% |
4 |
23.5% |
13 |
76.5% |
||
|
Ranking |
|
|
|
|
|
|
|
|
|
|
|
1-3 |
7 |
15.2% |
39 |
84.8% |
X2: 1.895 P:.388 |
19 |
47.5% |
21 |
52.5% |
X2: 3.557 P:.169 |
|
4-6 |
7 |
21.9% |
25 |
78.1% |
6 |
27.3% |
16 |
72.7% |
||
|
7 and more |
0 |
0.0% |
6 |
100.0% |
2 |
22.2% |
7 |
77.8% |
||
|
Level of study |
|
|
|
|
|
|
|
|
|
|
|
Level 7 |
4 |
18.2% |
18 |
81.8% |
X2: 3.796 P:.159 |
16 |
61.5% |
10 |
38.5% |
X2: 10.093 P:.006* |
|
Level 8 |
8 |
25.0% |
24 |
75.0% |
6 |
30.0% |
14 |
70.0% |
||
|
Level 9 |
2 |
6.7% |
28 |
93.3% |
5 |
20.0% |
20 |
80.0% |
||
|
Father’s education |
|
|
|
|
|
|
|
|
|
|
|
Died |
1 |
10.0% |
9 |
90.0% |
X2: 5.421 P:.247 |
1 |
16.7% |
5 |
83.3% |
X2: 6.280 P:.280 |
|
Elementary |
1 |
100.0% |
0 |
0.0% |
1 |
100.0% |
0 |
0.0% |
||
|
Middle |
1 |
14.3% |
6 |
85.7% |
2 |
40.0% |
3 |
60.0% |
||
|
Secondary |
2 |
14.3% |
12 |
85.7% |
5 |
23.8% |
16 |
76.2% |
||
|
University |
9 |
17.3% |
43 |
82.7% |
17 |
48.6% |
18 |
51.4% |
||
|
Post-study (Master, PhD) |
0 |
0.0% |
0 |
0.0% |
1 |
33.3% |
2 |
66.7% |
||
|
Mother’s education |
|
|
|
|
|
|
|
|
|
|
|
Died |
3 |
23.1% |
10 |
76.9% |
X2: 7.218 P:.205 |
2 |
25.0% |
6 |
75.0% |
X2: 6.316 P:.177 |
|
Elementary |
1 |
100.0% |
0 |
0.0% |
1 |
16.7% |
5 |
83.3% |
||
|
|
|
|
|
|
|
|
|
|
||
|
Middle |
2 |
25.0% |
6 |
75.0% |
2 |
50.0% |
2 |
50.0% |
||
|
|
|
|
|
|
|
|
|
|
||
|
Secondary |
3 |
20.0% |
12 |
80.0% |
2 |
16.7% |
10 |
83.3% |
||
|
University |
5 |
10.9% |
41 |
89.1% |
20 |
48.8% |
21 |
51.2% |
||
|
post study (Master, PhD) |
0 |
0.0% |
1 |
100.0% |
0 |
0.0% |
0 |
0.0% |
||
|
Income |
|
|
|
|
|
|
|
|
|
|
|
Average |
10 |
17.2% |
48 |
82.8% |
X2: 3.534 P:.316 |
23 |
37.7% |
38 |
62.3% |
X2: 1.717 P:.633 |
|
Above average |
0 |
0.0% |
7 |
100.0% |
2 |
66.7% |
1 |
33.3% |
||
|
High |
1 |
10.0% |
9 |
90.0% |
2 |
33.3% |
4 |
66.7% |
||
|
Low |
3 |
33.3% |
6 |
66.7% |
0 |
0.0% |
1 |
100.0% |
||
X2: Chi-square test; P: P value of significance; *: Significance at P value less than 0,05.
Table 6. Correlation between participants' demographic characteristics among exp. and cont. the group as regards their communication skills
|
Sociodemographic |
Communication Skills |
|||||||||
|
Experimental (n.84) |
Control (n.71) |
|||||||||
|
Incompetent |
Competent |
Sig. |
Incompetent |
Competent |
Sig. |
|||||
|
No. |
% |
No. |
% |
|
No. |
% |
No. |
% |
|
|
|
Nationality |
|
|
|
|
|
|
|
|
|
|
|
Saudi |
10 |
19.6% |
41 |
80.4% |
X2: .032 P:.858 |
9 |
19.6% |
37 |
80.4% |
X2: .002 P:.965 |
|
Non-Saudi |
7 |
21.2% |
26 |
78.8% |
5 |
20.0% |
20 |
80.0% |
||
|
Age |
|
|
|
|
|
|
|
|
|
|
|
Early |
2 |
13.3% |
13 |
86.7% |
X2: 1.348 P:.510 |
4 |
21.1% |
15 |
78.9% |
X2: 1.199 P:.549 |
|
Middle |
11 |
19.6% |
45 |
80.4% |
9 |
22.5% |
31 |
77.5% |
||
|
Late |
4 |
30.8% |
9 |
69.2% |
1 |
8.3% |
11 |
91.7% |
||
|
No. of family |
|
|
|
|
|
|
|
|
|
|
|
3-7 |
14 |
21.9% |
50 |
78.1% |
X2:.446 P:.54 |
14 |
25.9% |
40 |
74.1% |
X2:5.490 P:.019* |
|
8-16 |
3 |
15.0% |
17 |
85.0% |
0 |
0.0% |
17 |
100.0% |
||
|
Ranking |
|
|
|
|
|
|
|
|
|
|
|
1-3 |
8 |
17.4% |
38 |
82.6% |
X2:2.986 P:.225 |
11 |
27.5% |
29 |
72.5% |
X2:4.255 P:.119 |
|
4-6 |
9 |
28.1% |
23 |
71.9% |
3 |
13.6% |
19 |
86.4% |
||
|
7 and more |
0 |
0.0% |
6 |
100.0% |
0 |
0.0% |
9 |
100.0% |
||
|
Level of study |
|
|
|
|
|
|
|
|
|
|
|
Level 7 |
2 |
9.1% |
20 |
90.9% |
X2:4.334 P:.114 |
8 |
30.8% |
18 |
69.2% |
X2:4.175 P:.124 |
|
Level 8 |
10 |
31.2% |
22 |
68.8% |
4 |
20.0% |
16 |
80.0% |
||
|
Level 9 |
5 |
16.7% |
25 |
83.3% |
2 |
8.0% |
23 |
92.0% |
||
|
Father’s education |
|
|
|
|
|
|
|
|
|
|
|
Died |
3 |
30.0% |
7 |
70.0% |
X2:6.046 P:.196 |
2 |
33.3% |
4 |
66.7% |
X2:1.693 P:.890
|
|
Elementary |
1 |
100.0% |
0 |
0.0% |
0 |
0.0% |
1 |
100.0% |
||
|
Middle |
1 |
14.3% |
6 |
85.7% |
1 |
20.0% |
4 |
80.0% |
||
|
Secondary |
4 |
28.6% |
10 |
71.4% |
3 |
14.3% |
18 |
85.7% |
||
|
University |
8 |
15.4% |
44 |
84.6% |
7 |
20.0% |
28 |
80.0% |
||
|
Post study (Master, PhD) |
0 |
0.0% |
0 |
0.0% |
1 |
33.3% |
2 |
66.7% |
||
|
Mother’s education |
|
|
|
|
|
|
|
|
|
|
|
Died |
5 |
38.5% |
8 |
61.5% |
X2:9.025 P:.108 |
3 |
37.5% |
5 |
62.5% |
X2:4.254 P:.373 |
|
Elementary |
1 |
100.0% |
0 |
0.0% |
0 |
0.0% |
6 |
100.0% |
||
|
Middle |
1 |
12.5% |
7 |
87.5% |
1 |
25.0% |
3 |
75.0% |
||
|
Secondary |
4 |
26.7% |
11 |
73.3% |
1 |
8.3% |
11 |
91.7% |
||
|
University |
6 |
13.0% |
40 |
87.0% |
9 |
22.0% |
32 |
78.0% |
||
|
post study (Master, PhD) |
0 |
0.0% |
1 |
100.0% |
0 |
0.0% |
0 |
0.0% |
||
|
Income |
|
|
|
|
|
|
|
|
|
|
|
Average |
12 |
20.7% |
46 |
79.3% |
X2:5.700 P:.127 |
12 |
19.7% |
49 |
80.3% |
X2:.632 P:.889 |
|
Above average |
0 |
0.0% |
7 |
100.0% |
1 |
33.3% |
2 |
66.7% |
||
|
High |
1 |
10.0% |
9 |
90.0% |
1 |
16.7% |
5 |
83.3% |
||
|
Low |
4 |
44.4% |
5 |
55.6% |
0 |
0.0% |
1 |
100.0% |
||
X2: Chi-square test; P: P value of significance; *: Significance at P value less than 0,05.
Table 7. Correlation Between Ability to Intervene and Demographic Background of Experimental and Control Group
Sociodemographic |
Attitude |
|||||||||
|
Experimental (n.84) |
Control (n.71) |
|||||||||
|
Negative |
Positive |
Sig. |
Negative |
Positive |
Sig. |
|||||
|
No. |
% |
No. |
% |
|
No. |
% |
No. |
% |
|
|
|
Nationality |
|
|
|
|
|
|
|
|
|
|
|
Saudi |
15 |
29.4% |
36 |
70.6% |
X2:.008 P:.930 |
21 |
45.7% |
25 |
54.3% |
X2:3.222 P:.073 |
|
Non-Saudi |
10 |
30.3% |
23 |
69.7% |
6 |
24.0% |
19 |
76.0% |
||
|
Age |
|
|
|
|
|
|
|
|
|
|
|
Early |
4 |
26.7% |
11 |
73.3% |
X2:.577 P:.749 |
9 |
47.4% |
10 |
52.6% |
X2:5.533 P:.063 |
|
Middle |
16 |
28.6% |
40 |
71.4% |
17 |
42.5% |
23 |
57.5% |
||
|
Late |
5 |
38.5% |
8 |
61.5% |
1 |
8.3% |
11 |
91.7% |
||
|
No. of family |
|
|
|
|
|
|
|
|
|
|
|
3-7 |
21 |
32.8% |
43 |
67.2% |
X2:1.197 P:.274 |
23 |
42.6% |
31 |
57.4% |
X2:1.994 P:.158 |
|
8-16 |
4 |
20.0% |
16 |
80.0% |
4 |
23.5% |
13 |
76.5% |
||
|
Ranking |
|
|
|
|
|
|
|
|
|
|
|
1-3 |
13 |
28.3% |
33 |
71.7% |
X2:3.509 P:.173 |
18 |
45.0% |
22 |
55.0% |
X2:2.139 P:.343 |
|
4-6 |
12 |
37.5% |
20 |
62.5% |
7 |
31.8% |
15 |
68.2% |
||
|
7 and more |
0 |
0.0% |
6 |
100.0% |
2 |
22.2% |
7 |
77.8% |
||
|
Level of study |
|
|
|
|
|
|
|
|
|
|
|
Level 7 |
7 |
31.8% |
15 |
68.2% |
X2:2.329 P:.312 |
15 |
57.7% |
11 |
42.3% |
X2:9.447 P:.009* |
|
Level 8 |
12 |
37.5% |
20 |
62.5% |
8 |
40.0% |
12 |
60.0% |
||
|
Level 9 |
6 |
20.0% |
24 |
80.0% |
4 |
16.0% |
21 |
84.0% |
||
|
Father’s education |
|
|
|
|
|
|
|
|
|
|
|
Died |
4 |
40.0% |
6 |
60.0% |
X2:3.668 P:.453 |
4 |
66.7% |
2 |
33.3% |
X2:3.674 P:597 |
|
Elementary |
1 |
100.0% |
0 |
0.0% |
0 |
0.0% |
1 |
100.0% |
||
|
Middle |
2 |
28.6% |
5 |
71.4% |
1 |
20.0% |
4 |
80.0% |
||
|
Secondary |
5 |
35.7% |
9 |
64.3% |
7 |
33.3% |
14 |
66.7% |
||
|
University |
13 |
25.0% |
39 |
75.0% |
14 |
40.0% |
21 |
60.0% |
||
|
Post study (Master, PhD) |
0 |
0.0% |
0 |
0.0% |
1 |
33.3% |
2 |
66.7% |
||
|
Mother’s education |
|
|
|
|
|
|
|
|
|
|
|
Died |
6 |
46.2% |
7 |
53.8% |
X2:7.724 P:.172 |
5 |
62.5% |
3 |
37.5% |
X2:7.028 P:.091 |
|
Elementary |
1 |
100.0% |
0 |
0.0% |
2 |
33.3% |
4 |
66.7% |
||
|
Middle |
6 |
40.0% |
9 |
60.0% |
2 |
50.0% |
2 |
50.0% |
||
|
Secondary |
9 |
19.6% |
37 |
80.4% |
1 |
8.3% |
11 |
91.7% |
||
|
University |
0 |
0.0% |
1 |
100.0% |
17 |
41.5% |
24 |
58.5% |
||
|
post study (Master, PhD) |
0 |
0.0% |
0 |
0.0% |
0 |
0.0% |
0 |
0.0% |
||
|
Income |
|
|
|
|
|
|
|
|
|
|
|
Average |
19 |
32.8% |
39 |
67.2% |
X2:7.948 P:.047* |
24 |
39.3% |
37 |
60.7% |
X2:2.864 P:.413 |
|
Above average |
0 |
0.0% |
7 |
100.0% |
2 |
66.7% |
1 |
33.3% |
||
|
High |
1 |
10.0% |
9 |
90.0% |
1 |
16.7% |
5 |
83.3% |
||
|
Low |
5 |
55.6% |
4 |
44.4% |
0 |
0.0% |
1 |
100.0% |
||
X2: Chi-square test; P: P value of significance; *: Significance at P value less than 0,05.
Table 8. Correlation Between Ability to Intervene and Demographic Background Of Experimental and Control Group
|
Sociodemographic |
Ability to intervene |
|||||||||
|
Experimental (n.84) |
Control (n.71) |
|||||||||
|
Unable |
Able |
Sig. |
Unable |
Able |
Sig. |
|||||
|
No. |
% |
No. |
% |
|
No. |
% |
No. |
% |
|
|
|
Nationality |
|
|
|
|
|
|
|
|
|
|
|
Saudi |
12 |
23.5% |
39 |
76.5% |
X2:.871 P:.351 |
14 |
30.4% |
32 |
69.6% |
X2:.900 P:.343 |
|
Non-Saudi |
5 |
15.2% |
28 |
84.8% |
5 |
20.0% |
20 |
80.0% |
||
|
Age |
|
|
|
|
|
|
|
|
|
|
|
Early |
1 |
6.7% |
14 |
93.3% |
X2:2.084 P:.353 |
8 |
42.1% |
11 |
57.9% |
X2:3.277 P:.194 |
|
Middle |
13 |
23.2% |
43 |
76.8% |
9 |
22.5% |
31 |
77.5% |
||
|
Late |
3 |
23.1% |
10 |
76.9% |
2 |
16.7% |
10 |
83.3% |
||
|
No. of family |
|
|
|
|
|
|
|
|
|
|
|
3-7 |
14 |
21.9% |
50 |
78.1% |
X2:.446 P:.504 |
16 |
29.6% |
38 |
70.4% |
X2:.947 P:.330 |
|
8-16 |
3 |
15.0% |
17 |
85.0% |
3 |
17.6% |
14 |
82.4% |
||
|
Ranking |
|
|
|
|
|
|
|
|
|
|
|
1-3 |
11 |
23.9% |
35 |
76.1% |
X2:.854 P:.652 |
14 |
35.0% |
26 |
65.0% |
X2:3.414 P:.181 |
|
4-6 |
5 |
15.6% |
27 |
84.4% |
3 |
13.6% |
19 |
86.4% |
||
|
7 and more |
1 |
16.7% |
5 |
83.3% |
2 |
22.2% |
7 |
77.8% |
||
|
Level of study |
|
|
|
|
|
|
|
|
|
|
|
Level 7 |
3 |
13.6% |
19 |
86.4% |
X2:2.064 P:.356 |
13 |
50.0% |
13 |
50.0% |
X2:13.804 P:.001* |
|
Level 8 |
9 |
28.1% |
23 |
71.9% |
5 |
25.0% |
15 |
75.0% |
||
|
Level 9 |
5 |
16.7% |
25 |
83.3% |
1 |
4.0% |
24 |
96.0% |
||
|
Father’s education |
|
|
|
|
|
|
|
|
|
|
|
Died |
4 |
40.0% |
6 |
60.0% |
X2:7.098 P:.131 |
3 |
50.0% |
3 |
50.0% |
X2:7.465 P:.188 |
|
Elementary |
1 |
100.0% |
0 |
0.0% |
1 |
100.0% |
0 |
0.0% |
||
|
Middle |
1 |
14.3% |
6 |
85.7% |
0 |
0.0% |
5 |
100.0% |
||
|
Secondary |
2 |
14.3% |
12 |
85.7% |
5 |
23.8% |
16 |
76.2% |
||
|
University |
9 |
17.3% |
43 |
82.7% |
10 |
28.6% |
25 |
71.4% |
||
|
Post study (Master, PhD) |
0 |
0.0 |
0 |
0.0 |
0 |
0.0% |
3 |
100.0% |
||
|
Mother’s education |
|
|
|
|
|
|
|
|
|
|
|
Died |
5 |
38.5% |
8 |
61.5% |
X2:11.036 P:.051 |
3 |
37.5% |
5 |
62.5% |
X2:3.380 P:.496 |
|
Elementary |
1 |
100.0% |
0 |
0.0% |
1 |
16.7% |
5 |
83.3% |
||
|
Middle |
1 |
12.5% |
7 |
87.5% |
0 |
0.0% |
4 |
100.0% |
||
|
Secondary |
0 |
0.0% |
15 |
100.0% |
2 |
16.7% |
10 |
83.3% |
||
|
University |
10 |
21.7% |
36 |
78.3% |
13 |
31.7% |
28 |
68.3% |
||
|
post study (Master, PhD) |
0 |
0.0% |
1 |
100.0% |
0 |
0.0 |
0 |
0.0 |
||
|
Income |
|
|
|
|
|
|
|
|
|
|
|
Average |
13 |
22.4% |
45 |
77.6% |
X2:3.552 P:.314 |
16 |
26.2% |
45 |
73.8% |
X2:3.124 P:.373 |
|
Above average |
0 |
0.0% |
7 |
100.0% |
2 |
66.7% |
1 |
33.3% |
||
|
High |
1 |
10.0% |
9 |
90.0% |
1 |
16.7% |
5 |
83.3% |
||
|
Low |
3 |
33.3% |
6 |
66.7% |
0 |
0.0% |
1 |
100.0% |
||
X2: Chi-square test; P: P value of significance; *: Significance at P value less than 0,05.
Table 9. Correlation Between Affective Domain of Empathy and Demographic Background of Experimental and Control Group
|
Sociodemographic |
Affective |
|||||||||
|
Experimental (n.84) |
Control (n.71) |
|||||||||
|
Negative |
Positive |
Sig. |
Negative |
Positive |
Sig. |
|||||
|
No. |
% |
No. |
% |
|
No. |
% |
No. |
% |
|
|
|
Nationality |
|
|
|
|
|
|
|
|
|
|
|
Saudi |
22 |
43.1% |
29 |
56.9% |
X2:.231 P:.631 |
23 |
50.0% |
23 |
50.0% |
X2:.651 P:.420 |
|
Non-Saudi |
16 |
48.5% |
17 |
51.5% |
15 |
60.0% |
10 |
40.0% |
||
|
Age |
|
|
|
|
|
|
|
|
|
|
|
Early |
8 |
53.3% |
7 |
46.7% |
X2:.529 P:.767 |
11 |
57.9% |
8 |
42.1% |
X2:1.563 P:.458 |
|
Middle |
24 |
42.9% |
32 |
57.1% |
19 |
47.5% |
21 |
52.5% |
||
|
Late |
6 |
46.2% |
7 |
53.8% |
8 |
66.7% |
4 |
33.3% |
||
|
No. of family |
|
|
|
|
|
|
|
|
|
|
|
3-7 |
26 |
40.6% |
38 |
59.4% |
X2:2.309 P:.129 |
28 |
51.9% |
26 |
48.1% |
X2.253 P:.615 |
|
8-16 |
12 |
60.0% |
8 |
40.0% |
10 |
58.8% |
7 |
41.2% |
||
|
Ranking |
|
|
|
|
|
|
|
|
|
|
|
1-3 |
18 |
39.1% |
28 |
60.9% |
X2:2.098 P:.350 |
21 |
52.5% |
19 |
47.5% |
X2:.589 P:.745 |
|
4-6 |
16 |
50.0% |
16 |
50.0% |
13 |
59.1% |
9 |
40.9% |
||
|
7 and more |
4 |
66.7% |
2 |
33.3% |
4 |
44.4% |
5 |
55.6% |
||
|
Level of study |
|
|
|
|
|
|
|
|
|
|
|
Level 7 |
10 |
45.5% |
12 |
54.5% |
X2:.054 P:.973 |
18 |
69.2% |
8 |
30.8% |
X2:5.361 P:.069 |
|
Level 8 |
14 |
43.8% |
18 |
56.3% |
7 |
35.0% |
13 |
65.0% |
||
|
Level 9 |
14 |
46.7% |
16 |
53.3% |
13 |
52.0% |
12 |
48.0% |
||
|
Father’s education |
|
|
|
|
|
|
|
|
|
|
|
Died |
3 |
30.0% |
7 |
70.0% |
X2:2.287 P:.683 |
4 |
66.7% |
2 |
33.3% |
X2:3.312 P:.652 |
|
Elementary |
0 |
0.0% |
1 |
100.0% |
0 |
0.0% |
1 |
100.0% |
||
|
Middle |
3 |
42.9% |
4 |
57.1% |
3 |
60.0% |
2 |
40.0% |
||
|
Secondary |
6 |
42.9% |
8 |
57.1% |
13 |
61.9% |
8 |
38.1% |
||
|
University |
26 |
50.0% |
26 |
50.0% |
16 |
45.7% |
19 |
54.3% |
||
|
Post study (Master, PhD) |
0 |
0.0 |
0 |
0.0 |
2 |
66.7% |
1 |
33.3% |
||
|
Mother’s education |
|
|
|
|
|
|
|
|
|
|
|
Died |
4 |
30.8% |
9 |
69.2% |
X2:4.651 P:.460 |
4 |
50.0% |
4 |
50.0% |
X2:5.627 P:.229 |
|
Elementary |
0 |
0.0% |
1 |
100.0% |
3 |
50.0% |
3 |
50.0% |
||
|
Middle |
3 |
37.5% |
5 |
62.5% |
2 |
50.0% |
2 |
50.0% |
||
|
Secondary |
6 |
40.0% |
9 |
60.0% |
3 |
25.0% |
9 |
75.0% |
||
|
University |
25 |
54.3% |
21 |
45.7% |
26 |
63.4% |
15 |
36.6% |
||
|
post study (Master, PhD) |
0 |
0.0% |
1 |
100.0% |
0 |
0.0 |
0 |
0.0 |
||
|
Income |
|
|
|
|
|
|
|
|
|
|
|
Average |
26 |
44.8% |
32 |
55.2% |
X2:1.414 P:.702 |
30 |
49.2% |
31 |
50.8% |
X2:4.353 P:.226 |
|
Above average |
3 |
42.9% |
4 |
57.1% |
3 |
100.0% |
0 |
0.0% |
||
|
High |
6 |
60.0% |
4 |
40.0% |
4 |
66.7% |
2 |
33.3% |
||
|
Low |
3 |
33.3% |
6 |
66.7% |
1 |
100.0% |
0 |
0.0% |
||
X2: Chi-square test; P: P value of significance; *: Significance at P value less than 0,05.
Table 10. Correlation Between Cognitive Domain of Empathy and Demographic Background of Experimental and Control Group
|
Sociodemographic |
Cognitive |
|||||||||
|
Experimental (n.84) |
Control (n.71) |
|||||||||
|
Concret |
Abstract |
Sig. |
Concrete |
Abstract |
Sig. |
|||||
|
No. |
% |
No. |
% |
|
No. |
% |
No. |
% |
|
|
|
Nationality |
|
|
|
|
|
|
|
|
|
|
|
Saudi |
16 |
31.4% |
16 |
48.5% |
X2:2.488 P:.115 |
25 |
54.3% |
21 |
45.7% |
X2:.018 P:.894 |
|
Non-Saudi |
35 |
68.6% |
17 |
51.5% |
14 |
56.0% |
11 |
44.0% |
||
|
Age |
|
|
|
|
|
|
|
|
|
|
|
Early |
4 |
26.7% |
11 |
73.3% |
X2:1.042 P:.594 |
13 |
68.4% |
6 |
31.6% |
X2:3.658 P:.161 |
|
Middle |
23 |
41.1% |
33 |
58.9% |
22 |
55.0% |
18 |
45.0% |
||
|
Late |
5 |
38.5% |
8 |
61.5% |
4 |
33.3% |
8 |
66.7% |
||
|
No. of family |
|
|
|
|
|
|
|
|
|
|
|
3-7 |
24 |
37.5% |
40 |
62.5% |
X2:.040 P:.841 |
33 |
61.1% |
21 |
38.9% |
X2:3.481 P:.062 |
|
8-16 |
8 |
40.0% |
12 |
60.0% |
6 |
35.3% |
11 |
64.7% |
||
|
Ranking |
|
|
|
|
|
|
|
|
|
|
|
1-3 |
15 |
32.6% |
31 |
67.4% |
X2:1.691 P:.429 |
26 |
65.0% |
14 |
35.0% |
X2:4.703 P:.095 |
|
4-6 |
15 |
46.9% |
17 |
53.1% |
8 |
36.4% |
14 |
63.6% |
||
|
7 and more |
2 |
33.3% |
4 |
66.7% |
5 |
55.6% |
4 |
44.4% |
||
|
Level of study |
|
|
|
|
|
|
|
|
|
|
|
Level 7 |
5 |
22.7% |
17 |
77.3% |
X2:10.009 P:.007* |
19 |
73.1% |
7 |
26.9% |
X2:14.954 P:.001* |
|
Level 8 |
19 |
59.4% |
13 |
40.6% |
14 |
70.0% |
6 |
30.0% |
||
|
Level 9 |
8 |
26.7% |
22 |
73.3% |
6 |
24.0% |
19 |
76.0% |
||
|
Fatheeducation |
|
|
|
|
|
|
|
|
|
|
|
Died |
5 |
50.0% |
5 |
50.0% |
X2:1.371 P:.849 |
5 |
83.3% |
1 |
16.7% |
X2:4.314 P:.505 |
|
Elementary |
0 |
0.0% |
1 |
100.0% |
0 |
0.0% |
1 |
100.0% |
||
|
Middle |
3 |
42.9% |
4 |
57.1% |
2 |
40.0% |
3 |
60.0% |
||
|
Secondary |
5 |
35.7% |
9 |
64.3% |
11 |
52.4% |
10 |
47.6% |
||
|
University |
19 |
36.5% |
33 |
63.5% |
20 |
57.1% |
15 |
42.9% |
||
|
Post study (Master, PhD) |
0 |
0.0 |
0 |
0.0 |
1 |
33.3% |
2 |
66.7% |
||
|
Mother’s education |
|
|
|
|
|
|
|
|
|
|
|
Died |
4 |
30.8% |
9 |
69.2% |
X2:6.998 P:.221 |
6 |
75.0% |
2 |
25.0% |
X2:5.337 P:.254 |
|
Elementary |
0 |
0.0% |
1 |
100.0% |
2 |
33.3% |
4 |
66.7% |
||
|
Middle |
6 |
75.0% |
2 |
25.0% |
1 |
25.0% |
3 |
75.0% |
||
|
Secondary |
4 |
26.7% |
11 |
73.3% |
5 |
41.7% |
7 |
58.3% |
||
|
University |
18 |
39.1% |
28 |
60.9% |
25 |
61.0% |
16 |
39.0% |
||
|
post study (Master, PhD) |
0 |
0.0% |
1 |
100.0% |
|
|
|
|
||
|
Income |
|
|
|
|
|
|
|
|
|
|
|
Average |
21 |
36.2% |
37 |
63.8% |
X2:.324 P:.955 |
32 |
52.5% |
29 |
47.5% |
X2:4.165 P:.244 |
|
Above average |
3 |
42.9% |
4 |
57.1% |
3 |
100.0% |
0 |
0.0% |
||
|
High |
4 |
40.0% |
6 |
60.0% |
4 |
66.7% |
2 |
33.3% |
||
|
Low |
4 |
44.4% |
5 |
55.6% |
0 |
0.0% |
1 |
100.0% |
||
X2: Chi-square test; P: P value of significance; *: Significance at P value less than 0,05.
Table 11. Correlation Between Empathy and Demographic Background of The Experimental and Control Group
|
Sociodemographic |
Total Empathy |
|||||||||
|
Experimental (n.84) |
Control (n.71) |
|||||||||
|
Sympathy |
Empathy |
Sig. |
Sympathy |
Empathy |
Sig. |
|||||
|
No. |
% |
No. |
% |
|
No. |
% |
No. |
% |
|
|
|
Nationality |
|
|
|
|
|
|
|
|
|
|
|
Saudi |
17 |
33.3% |
34 |
66.7% |
X2:.321 P:.571 |
26 |
56.5% |
20 |
43.5% |
X2:.080 P:.777 |
|
Non-Saudi |
13 |
39.4% |
20 |
60.6% |
15 |
60.0% |
10 |
40.0% |
||
|
Age |
|
|
|
|
|
|
|
|
|
|
|
Early |
6 |
40.0% |
9 |
60.0% |
X2:1.048 P:.592 |
10 |
52.6% |
9 |
47.4% |
X2:.869 P:.648 |
|
Middle |
18 |
32.1% |
38 |
67.9% |
25 |
62.5% |
15 |
37.5% |
||
|
Late |
6 |
46.2% |
7 |
53.8% |
6 |
50.0% |
6 |
50.0% |
||
|
No. of family |
|
|
|
|
|
|
|
|
|
|
|
3-7 |
22 |
34.4% |
42 |
65.6% |
X2:.210 P:.647 |
33 |
61.1% |
21 |
38.9% |
X2:1.046 P:.306 |
|
8-16 |
8 |
40.0% |
12 |
60.0% |
8 |
47.1% |
9 |
52.9% |
||
|
Ranking |
|
|
|
|
|
|
|
|
|
|
|
1-3 |
14 |
30.4% |
32 |
69.6% |
X2:1.473 P:.479 |
25 |
62.5% |
15 |
37.5% |
X2:.929 P:.628 |
|
4-6 |
14 |
43.8% |
18 |
56.3% |
11 |
50.0% |
11 |
50.0% |
||
|
7 and more |
2 |
33.3% |
4 |
66.7% |
5 |
55.6% |
4 |
44.4% |
||
|
Level of study |
|
|
|
|
|
|
|
|
|
|
|
Level 7 |
6 |
27.3% |
16 |
72.7% |
X2:.967 P:.617 |
17 |
65.4% |
9 |
34.6% |
X2:2.989 P:.224 |
|
Level 8 |
12 |
37.5% |
20 |
62.5% |
13 |
65.0% |
7 |
35.0% |
||
|
Level 9 |
12 |
40.0% |
18 |
60.0% |
11 |
44.0% |
14 |
56.0% |
||
|
Father’s education |
|
|
|
|
|
|
|
|
|
|
|
Died |
2 |
20.0% |
8 |
80.0% |
X2:2.113 P:.715 |
5 |
83.3% |
1 |
16.7% |
X2:3.728 P.589 |
|
Elementary |
0 |
0.0% |
1 |
100.0% |
0 |
0.0% |
1 |
100.0% |
||
|
Middle |
3 |
42.9% |
4 |
57.1% |
2 |
40.0% |
3 |
60.0% |
||
|
Secondary |
6 |
42.9% |
8 |
57.1% |
12 |
57.1% |
9 |
42.9% |
||
|
University |
19 |
36.5% |
33 |
63.5% |
20 |
57.1% |
15 |
42.9% |
||
|
Post study (Master, PhD) |
0 |
0.0 |
0 |
0.0 |
2 |
66.7% |
1 |
33.3% |
||
|
Mother’s education |
|
|
|
|
|
|
|
|
|
|
|
Died |
1 |
7.7% |
12 |
92.3% |
X2:7.584 P:.181 |
5 |
62.5% |
3 |
37.5% |
X2:4.356 P:.360 |
|
Elementary |
0 |
0.0% |
1 |
100.0% |
3 |
50.0% |
3 |
50.0% |
||
|
Middle |
3 |
37.5% |
5 |
62.5% |
2 |
50.0% |
2 |
50.0% |
||
|
Secondary |
5 |
33.3% |
10 |
66.7% |
4 |
33.3% |
8 |
66.7% |
||
|
University |
21 |
45.7% |
25 |
54.3% |
27 |
65.9% |
14 |
34.1% |
||
|
post study (Master, PhD) |
0 |
0.0% |
1 |
100.0% |
0 |
0.0 |
0 |
0.0 |
||
|
Income |
|
|
|
|
|
|
|
|
|
|
|
Average |
18 |
31.0% |
40 |
69.0% |
X2:3.300 P:.348 |
32 |
52.5% |
29 |
47.5% |
X2:5.236 P:.155 |
|
Above average |
3 |
42.9% |
4 |
57.1% |
3 |
100.0% |
0 |
0.0% |
||
|
High |
6 |
60.0% |
4 |
40.0% |
5 |
83.3% |
1 |
16.7% |
||
|
Low |
3 |
33.3% |
6 |
66.7% |
1 |
100.0% |
0 |
0.0% |
||
X2:Chi-square test; P: P value of significance; *: Significance at P value less than 0,05.
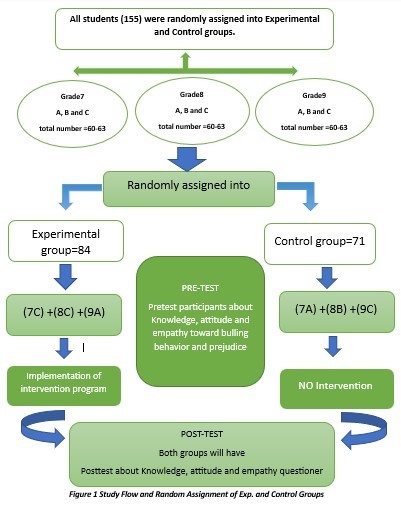
Fig. 1. Study Flow and Random Assignment of Exp. and Control Group: each student level divided into 3 classes as G7 A,G7 B, and G7 C
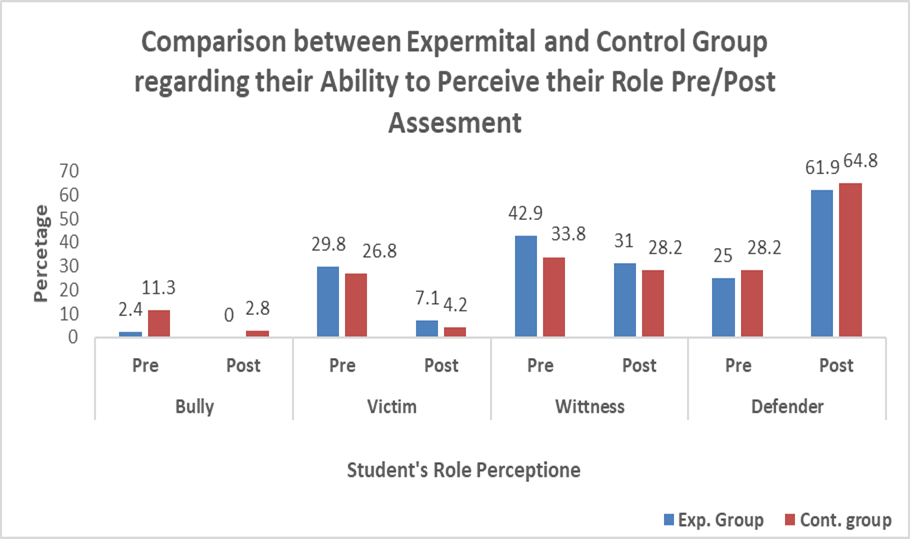
Fig. 2. Comparison between Experimental and control groups about roles pre/post-intervention
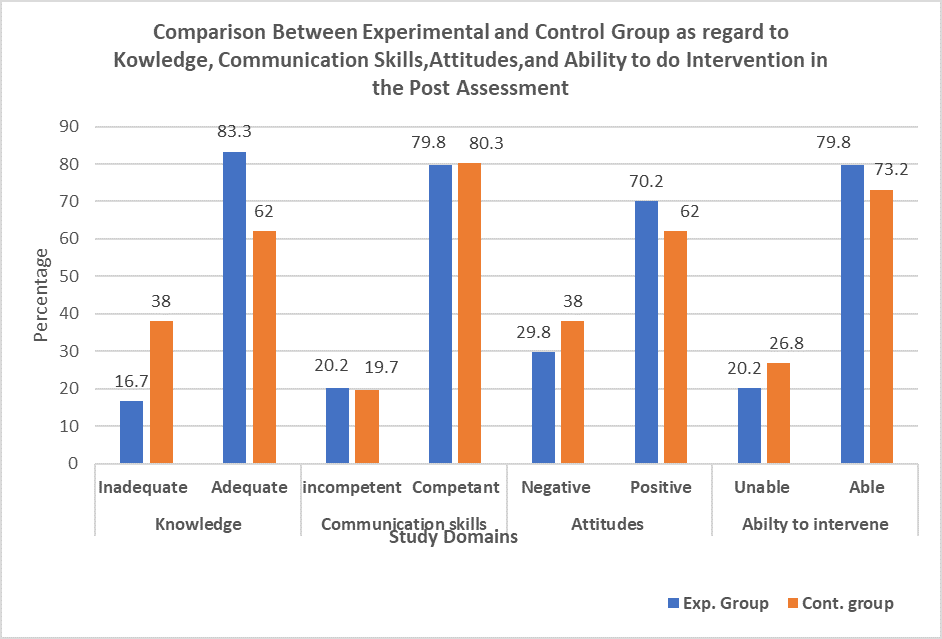
Fig. 3. Comparison between Experimental and control groups about knowledge, communication skills, attitudes, and ability to intervene pre/post
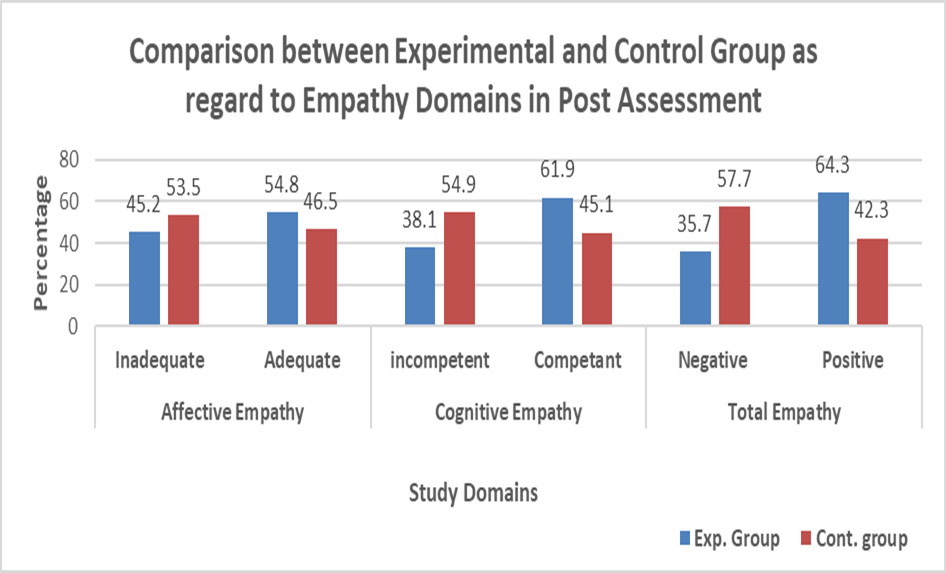
Fig. 4. Comparison between Exp, and Cont. as regards empathy domains/post-intervention