Introduction
The practice of educational inclusion in the education system of the Russian Federation has been developing over the past fifteen years.
As noted in international documents regulating the implementation of the Convention on the Rights of Persons with Disabilities (2006), joint education of students with disabilities in itself, without the creation of the necessary conditions, does not lead to their inclusion in the educational process (General Comment, 2016, p. 4).
This makes it relevant to study the conditions of inclusion, which is the subject of this article.
Public and scientific discourse on the effectiveness or ineffectiveness of inclusive education often focuses on issues of accessibility of the environment, the development of adapted programs, the professional level of teachers, and the staffing of educational organizations which, of course, is of great importance, but at the same time insufficient attention is paid to social relations in educational institutions (Indenbaum, 2023).
There is also insufficient attention to the assessment of personal achievements of schoolchildren, which are closely related to the development of their social competencies, including the formation of accepting relationships.
To create an inclusive environment, specially organized activities are needed, aimed at creating a favorable psychological climate, a friendly, accepting environment, which can positively influence the personal development of schoolchildren.
An inclusive environment, in contrast to a non-inclusive one, is characterized by the presence of students with different educational needs (EN).
In this regard, an important indicator characterizing an inclusive environment is the focus of classmates on communicating with each other, despite the differences between them due to the diversity of special educational needs (SEN).
This indicator, which can be defined as the acceptance by the team of each teacher, including students with special educational needs, should be considered as one of the criteria of an inclusive environment along with the criteria of participation, accessibility and support.
It has been shown (De Bruyn et al., 2009), that the level of acceptance of a student, determined by the positive attitude of his peers towards him, affects the risk of becoming a victim of bullying and the potential aggressiveness of the child: the less a child is accepted by others, the greater the risk of his aggression towards others and the risk of becoming a victim of aggression depending on the combination with other factors
Thus, a high level of acceptance by children of each other, regardless of their characteristics, can be seen as an essential condition and, at the same time, a result of the inclusive process.
According to the results of studies conducted in the conditions of individual educational organizations (special schools), students with disabilities, especially with intellectual disabilities, had inflated self-assessment and poorly differentiated level of aspirations in a situation of insufficient experience of communication in a wider society and, as a consequence, problems in building interpersonal relationships with peers outside of school.
According to the same data, in the environment of comprehensive schools such children had low self-esteem and aspirations, which led either to their aggressive behavior or to isolation from others and withdrawal into themselves and, as a result, to isolation from their peers.
At the same time, in an inclusive class, adolescents with mental disabilities develop the ability for social comparison and reflection better than in special (correctional) schools, which creates conditions for the formation of adequate self-assessment in them.
Modern research has shown that students with learning disabilities who face challenges in the school environment in mainstream schools not only have lower levels of academic achievement but also a lower level of experienced well-being and an increased risk of bullying, which affects their level of self-assessment, experiences of loneliness, and mental health risks such as anxiety and depression (Williams et al., 2024; Touloupis, 2024)
Self-esteem is closely related to the social status of a teenager in a group: the higher his self-assessment, the higher his social status in the group, and vice versa.
Children who are perceived negatively by their peers develop lower self-assessment, which often leads to their antisocial behavior and negative consequences that affect the psychological climate of the class as a whole.
The implementation of criteria of acceptance, accessibility, support, and participation is closely linked to the formation of a favorable psychological climate, which should be inherent in an inclusive school or class.
An inclusive psychological climate is based on social-emotional acceptance, which is formed through the process of communication between students. organized through clear rules for interaction in a team, support in learning and personal development, inclusion in interactions in different compositions of study groups, support for a positive perception of oneself and others (Lyskova, 2019; Margas, 2023).
However, without regular, meaningful communication between students, acceptance remains just an abstract idea.
It is through daily acts of communication—playing together, helping with homework, working on shared projects, and talking during recess—when students overcome barriers, get to know each other, develop empathy, and come to a deep, sincere acceptance of the individual characteristics of each member of their group.
This transforms an inclusive classroom from a simple coexistence of different children into a real community based on respect and mutual understanding.
The parameters of mutual acceptance of students were studied in schools of the Novosibirsk region using the methodology of “Sociomonitoring” (Ryapisova, Tchepel, 2013). During the analysis, classes with a high level of acceptance (38%), an average level (50%) and a low level (12%) were identified.
In our planned study using the “Sociomonitoring” method, the indicators of the level of students’ acceptance of each other in general across classes (Khabarova et al., 2004) were studied in their connection with the parameters of self-esteem, which are significant for the personal development of students, according to the study of A.M. Prikhozhan.
The level of acceptance, as a criterion of inclusiveness, and the levels of self-esteem and aspirations were chosen by us as parameters to evaluate an inclusive educational environment (Evaluation of an inclusive educational environment 2024).
The key point for this work is that the social relations in an inclusive class are based on acceptance of the other with his individual differences.
Based on this, this study assumed that there is a certain connection between the level of acceptance of all students in the class and the level of self-assessment and aspirations of students
Identifying this connection was the goal of this study. As far as we are aware, it has not been studied by anyone, which allows us to say that our research is novel.
Materials and methods
Methodological framework. This study is grounded in the cultural-historical theory of L.S. Vygotsky, which conceptualizes psychological development as a socially mediated process, shaped through interaction with significant others, cultural tools, and communication. From this perspective, personal development is viewed as the result of internalizing social experience and gradually forming self-regulation and individual agency.
Sampling
The sample consisted of pilot schools participating in the national implementation of the inclusive school model in Russia. These schools were selected by the Federal Center for General and Additional Inclusive Education at the Moscow State University of Psychology and Education (Samsonova et al., 2025).
Schools selected classes based on whether they offered co-educational instruction for students with various educational needs (students with disabilities, gifted students, students whose native language of instruction is not Russian, etc.): 109 classes in total, including 57 fourth-grade and 52 eighth-grade students. The sample included 3238 students—1713 fourth-grade students and 1525 eighth-grade students—from 55 schools, representing 11,7% of the total number of schools in six regions of Russia. The inclusion of adolescents of different ages (fourth and eighth grades) in the sample allows for a comparison of the relationship between group acceptance and self-esteem across these age ranges. The number of students with disabilities in the entire sample was 230 (7,1%). Empirical data collection was conducted in 2024.
The empirical base included general education schools in six regions of the Russian Federation:
- Donetsk People’s Republic
- Kaliningrad Region
- Krasnoyarsk Region
- Lipetsk District
- Stavropol Region
- Khanty-Mansi Autonomous Okrug – Yugra.
Research methods:
1. Self-Assessment and Aspirations
To assess personal development and aspiration levels, the study used the Dembo–Rubinstein self-assessment method, as modified by A.M. Prikhozhan.
Normative data for 4th and 8th-grade students were used based on age-specific thresholds:
• For students aged 10–11: normative self-assessment range is 65–85 points
• For ages 12–14: 64–82 points
Aspirations in our sample were somewhat elevated compared to original norms:
• 4th grade: 84–96 points
• 8th grade: 80–95 points.
2. Peer Acceptance
To measure the level of peer acceptance in inclusive classrooms, we employed the Sociomonitoring Service (Khabarova et al., 2004), a software-and-methodology complex (SMC) designed for efficient large-scale data collection and analysis.
Students completed a “communication frequency card”, where they rated how often and how positively they interact with each of their classmates:
• +3 — Very frequent, like close friends
• +2 — Frequent, like good acquaintances
• +1 — Rare, but pleasant
• –1 — Rare, with discomfort
• –2 — Actively avoid communication
• –3 — Consider communication entirely inappropriate
These scores were used to calculate:
• Acceptance by others: average of points each student received (S/j)
• Acceptance of others: average of points each student gave to others (S/i)
Students were ranked, and based on score distribution, three class profile types were identified:
• Type 1: High acceptance across most students (majority above +1)
• Type 2: Mixed acceptance (some scores between +0,4 and +1)
• Type 3: Low acceptance, frequent rejection (many scores below +0.4)
Statistical Analysis. Data analysis was conducted using SPSS v.26.0, applying:
- One-way ANOVA
- Kruskal-Wallis non-parametric test
- Descriptive statistics
- Frequency analysis
Results
Based on the analysis of peer acceptance levels in inclusive classrooms, three distinct class profile types were identified, each reflecting a different level of inclusivity:
- Type 1: High level of peer acceptance
- Type 2: Insufficient level of acceptance
- Type 3: Low level of acceptance.
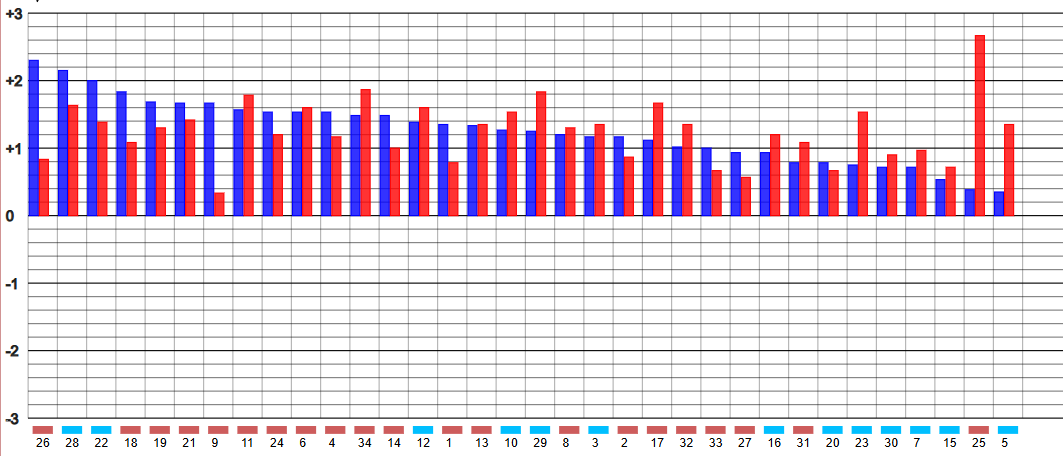
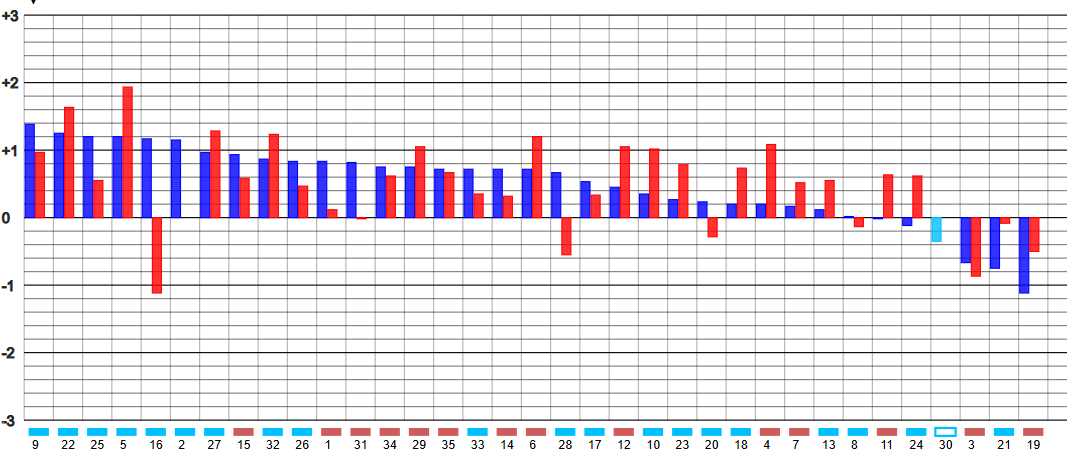
These profiles were determined using the “Sociomonitoring Service” and were visually represented in Figures 1–3.
Distribution of Class Types
Among 4th-grade classes:
- 9% (6 classes) were classified as Type 1
- 77% (49 classes) as Type 2
- 14% (9 classes) as Type 3
Among 8th-grade classes:
- 13% (8 classes) – Type 1
- 63% (38 classes) – Type 2
- 23% (14 classes) – Type 3
In Type 1 classes, the range of mutual acceptance scores was from +0,4 to +2,8, and no students experienced social exclusion, indicating a high level of inclusivity.
In Type 2 classes, scores ranged from –1,2 to +1,9, showing a more uneven distribution—some students were included, while others were only partially accepted.
In Type 3 classes, the range was –2,0 to +1,6, with notable instances of peer rejection, social isolation, and lack of close interactions—indicating serious challenges in mutual acceptance.
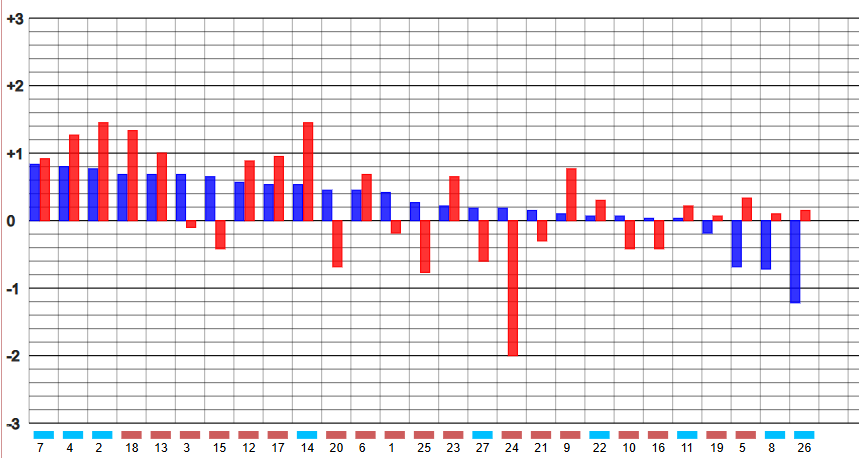
At the same time, the majority of the class has no desire to interact with their classmates and rejects them (red bars with negative values). Taken together, this indicates serious problems with social acceptance within the class.
When comparing the results obtained using the Sociomonitoring and Dembo-Rubinstein methods, certain trends can be noted in the distribution of students with low, medium, and high levels of self-esteem and aspirations across class types (Table 1).
Table 1
Distribution by class type of students who have low, medium and high levels of self-esteem and aspirations
|
Class type* – N of classes (Ni / N, %), (NSt –sample of students; NSWD –/ students with disabilities in a sample) |
Self-esteem, Ni (Ni / N, %) |
Aspiration level, Ni (Ni / N, %) |
||||
|
Low |
Medium |
High |
Low |
Medium |
High |
|
|
first type of fourth grades: N = 6 (9%); NSt = 140, NSWD = 13 (9,3% of 140) |
17 (12%) NSWD = 0 |
99 (71%) NSWD = 9 |
24 (17%) NSWD = 4 |
26 (19%) NSWD = 0 |
90 (64%) NSWD = 10 |
24 (17%) NSWD = 3 |
|
second type of fourth grades: N = 49 (77%); NSt = 1118, NSWD = 89 (8,0% of 1118) |
267 (24%) NSWD = 29 |
589 (53%) NSWD = 50 |
262 (23%) NSWD = 10 |
259 (23%) NSWD = 28 |
557 (50%) NSWD = 41 |
302 (27%) NSWD = 20 |
|
third type of fourth grades: N = 9 (14%); NSt = 264; NSWD = 28; (10,6% of 264) |
98 (37%) NSWD = 19 |
116 (44%) NSWD = 9 |
50 (19%) NSWD = 0 |
124 (47%) NSWD = 19 |
103 (39%) NSWD = 5 |
37 (14%) NSWD = 4 |
|
first type of eighth grades: N = 8 (13%); NSt = 187; NSWD = 6 (3,2% of 187) |
25 (13%) NSWD = 0 |
125 (67%) NSWD = 4 |
37 (20%) NSWD = 2 |
35 (19%) NSWD = 0 |
106 (57%) NSWD = 5 |
45 (24%) NSWD = 1 |
|
second type of eighth grades: N = 38 (63%); NSt = 836; NSWD = 50 (6,0% of 836) |
223 (27%) NSWD = 16 |
399 (48%) NSWD = 24 |
214 (25%) NSWD = 10 |
239 (29%) NSWD = 19 |
385 (46%) NSWD = 21 |
210 (25%) NSWD = 10 |
|
third type of eighth grades: N = 14 (23%); NSt = 376; NSWD = 37 (9,8% of 376) |
110 (29%) NSWD = 18 |
180 (48%) NSWD = 15 |
86 (23%) NSWD = 4 |
135 (36%) NSWD = 14 |
180 (48%) NSWD = 19 |
61 (16%) NSWD = 4 |
Notes: * – type of classes by level of acceptance: 1 type – high, 2 type – insufficient, 3 type – low.
Students with unfavorable personality development are fewer in classes with high levels of student acceptance, while these indicators of unfavorable personality development are more pronounced in classes with insufficient and especially low levels of acceptance. Among fourth-grade classes, 9% showed high levels of student acceptance (Type 1), while among eighth-grade classes, the figure was 13%. These classes also showed higher levels of self-esteem and aspirations. Moreover, in these classes, even students with low self-esteem are not rejected by the group. It is important to note that students with disabilities in Type 1 classes (high levels of acceptance) do not have low self-esteem in either fourth or eighth grades (Table 1).
Table 2
Descriptive statistics of self-esteem and level of aspirations of students depending on the type of class profile by level of acceptance*
|
Indicator |
Type of class profile |
Sample size, N |
Middle rank |
Median |
Standard deviation |
|
|
|
|
Valid |
Missed |
|
|
|
|
Fourth grades |
||||||
|
Self-esteem |
1 |
141 |
0 |
865,41 |
74,00 |
9,46 |
|
2 |
1272 |
46 |
852,53 |
74,71 |
14,04 |
|
|
3 |
258 |
1 |
738,45 |
71,71 |
17,76 |
|
|
Kruskal-Wallis Test |
H = 12,562; df = 2; p = 0,002 |
|||||
|
Level of aspirations |
1 |
140 |
1 |
872,63 |
92,00 |
7,32 |
|
2 |
1243 |
75 |
858,23 |
92,66 |
10,65 |
|
|
3 |
255 |
4 |
601,57 |
85,00 |
14,79 |
|
|
Kruskal-Wallis Test |
H = 64,320; df = 2; p < 0,001 |
|||||
|
Eighth grades |
||||||
|
Self-esteem |
1 |
186 |
0 |
803,87 |
74,64 |
10,11 |
|
2 |
999 |
18 |
761,45 |
73,57 |
14,07 |
|
|
3 |
323 |
0 |
704,56 |
71,43 |
14,45 |
|
|
Kruskal-Wallis Test |
H = 6,894; df = 2; p = 0,032 |
|||||
|
Level of aspirations |
1 |
186 |
0 |
768,63 |
90,00 |
9,63 |
|
2 |
981 |
36 |
750,92 |
89,00 |
12,69 |
|
|
3 |
293 |
30 |
637,93 |
85,00 |
13,57 |
|
|
Kruskal-Wallis Test |
H = 17,963; df = 2; p < 0,001 |
|||||
Notes: * – type of classes by level of acceptance: 1 type – high, 2 type – insufficient, 3 type – low; statistically significant differences in Kruskal-Wallis Test at p < 0,05 are highlighted in bold.
Classes of different profile types differ statistically significantly in self-esteem and aspiration levels among both fourth- and eighth-grade students, according to the results of a one-way Kruskal-Wallis nonparametric analysis of variance (Table 2). Furthermore, it can be noted that the median and mean rank values for class types 1 and 2 differ from each other to a lesser extent than from the corresponding values for class type 3.
Table 3
Pairwise comparisons of classes with different level of acceptence using Dann’s test or Dunn-Bonferroni method*
|
Profile types of the compared classes |
Criterion statistics |
Standard deviation |
Standard criterion statistics |
p-value |
Corrected p-valueа |
|
Fourth grades |
|||||
|
Self-esteem |
|||||
|
3-2 |
114,079 |
32,946 |
3,463 |
0,001 |
0,002 |
|
3-1 |
126,964 |
50,534 |
2,512 |
0,012 |
0,036 |
|
2-1 |
12,885 |
42,828 |
0,301 |
0,764 |
1,000 |
|
Level of aspirations |
|||||
|
3-2 |
256,660 |
32,494 |
7,899 |
0,000 |
0,000 |
|
3-1 |
271,067 |
49,719 |
5,452 |
0,000 |
0,000 |
|
2-1 |
14,407 |
42,138 |
0,342 |
0,732 |
1,000 |
|
Eighth grades |
|||||
|
Self-esteem |
|||||
|
3-2 |
56,896 |
27,873 |
2,041 |
0,041 |
0,124 |
|
3-1 |
99,315 |
40,082 |
2,478 |
0,013 |
0,040 |
|
2-1 |
42,419 |
34,775 |
1,220 |
0,223 |
0,668 |
|
Level of aspirations |
|||||
|
3-2 |
112,992 |
28,057 |
4,027 |
0,000 |
0,000 |
|
3-1 |
130,698 |
39,510 |
3,308 |
0,001 |
0,003 |
|
2-1 |
17,706 |
33,703 |
0,525 |
0,599 |
1,000 |
Notes: * – type of classes by level of acceptance: 1 type – high, 2 type – insufficient, 3 type – low; a – Bonferroni correction for multiple tests has been applied to the values; statistically significant differences at p < 0,05 are highlighted in bold.
As can be seen from Table 3, pairwise comparison of indicators using Dunn's test with Bonferroni correction reveals differences in the level of self-esteem and in the level of aspirations between the fourth grades of types 1 and 2 and the classes of type 3 at a significance level of 0,05. For the eighth grades, differences in the level of self-esteem are statistically significant only between the classes of types 1 and 3, and in the level of aspirations both between the classes of types 2 and 3, and between the classes of types 1 and 3. At the same time, the classes of types 1 and 2 do not differ significantly from each other either in self-esteem or in the level of aspirations.
Discussion of results
Our pilot study identified three types of classrooms based on the level of student acceptance using the "Sociomonitoring" method.
According to the authors of this method, Type 1 classrooms provide a social environment favorable to all children, where the value of human relationships is paramount; students support each other and derive satisfaction from interactions and collaborative activities within the classroom.
Type 2 classrooms typically prioritize academic achievement; students are divided into groups based on their academic performance, within which they primarily interact, with little contact with students from other groups. Thus, social stratification is evident within the classroom, with potential for conflicts, clashes of interest, increased social tension, and attempts to change the current situation. In Type 3 classes, the teacher imposes strict, authoritarian norms on children's behavior, aimed at maintaining discipline in the classroom and excluding interaction between children during lessons. Children are confined to narrow boundaries and forced to suppress their own behavioral and emotional reactions (Khabarova et al., 2004).
Our data are consistent with these descriptions by the developers, in that Type 1 classes with high levels of acceptance have a significantly lower proportion of students with low self-esteem and low aspirations than classes with insufficient and especially low levels of acceptance (Types 2 and 3). Students with disabilities in Type 1 classes do not have low self-esteem.
Our study found statistically significant differences in self-esteem and aspirations in both 4th and 8th grades with different levels of acceptance (Table 2). Statistically significant differences were observed only between classes of types 1 and 3, and 2 and 3, but not between classes of types 1 and 2 (Table 3).
The proportion of classes with a high level of acceptance, where it can be assumed that the homeroom teacher has succeeded in creating an inclusive culture of inclusion of every student, conscious participation in the life of the group, and acceptance of all by all, is 9% in fourth grades and 13% in eighth grades. The development of an inclusive culture in educational organizations aims to create a favorable psychological climate aimed at the well-being of all students. This culture orients all participants in educational relationships toward the creation of a school community based on inclusive values (Booth, Einscow, 2007; Shemanov, Ekushevskaya, 2018; Bozhani et al., 2025). The presence of an inclusive culture in Type 1 classes is confirmed by the fact that students with disabilities in these classes have average or high self-esteem, rather than low self-esteem.
Most classes are characterized by a level of acceptance insufficient for inclusion (Type 2), where some students experience exclusion. This type includes 77% of fourth-graders and 63% of eighth-graders. Some classes had extremely low levels of acceptance (Type 3 – 14% of fourth-graders and 23% of eighth-graders).
Comparative Insights
A 2011–2012 study by Ryapisova and Chepel in Novosibirsk found that:
• 38% of classes were Type 1
• 50% were Type 2
• 12% were Type 3
In contrast, our current results show a decline in inclusive classroom profiles (Type 1: only 9% in 4th grade, 13% in 8th grade). This decline may be due to:
• Different sample compositions
• Shifts in sociocultural conditions
• Staff shortages and reduced support infrastructure
Regardless of the cause, the findings highlight the urgent need to purposefully cultivate inclusive environments, particularly by fostering a welcoming psychological climate in classrooms.
Final Remarks. Research by Yudina and Alekhina (2021) further confirms that while children may show a positive emotional attitude toward classmates with disabilities, they may still avoid interaction. True inclusion goes beyond attitude and requires active participation and acceptance in daily peer interactions.
The findings emphasize the urgent need to strengthen inclusive culture at both the school and classroom levels—where acceptance, support, and psychological well-being become central elements of the learning environment.
Conclusion
This study demonstrates that the level of peer acceptance in inclusive classrooms is closely associated with the self-assessment and aspiration levels of students—including those with special educational needs (SEN). A supportive psychological climate, as observed in Type 1 classes, fosters more positive self-perception and reduces developmental risks for all students.
Key conclusions:
• Inclusive culture exists in only 9% of 4th-grade and 13% of 8th-grade classes.
• All students with SEN in Type 1 classrooms showed average or high self-assessment, with none reporting low levels.
• Most classes were of Type 2 (insufficient acceptance), and a significant portion were Type 3 (low acceptance), where social exclusion and peer rejection were present.
• The presence of students with disabilities alone does not determine classroom acceptance levels, emphasizing the role of the teacher and school culture in fostering inclusivity.
Implications:
• Creating an inclusive school environment requires intentional efforts to build positive peer relationships and ensure emotional safety for every child.
• Teachers play a pivotal role in shaping classroom culture through their attitudes, practices, and interactions.
• Schools must prioritize the development of inclusive values alongside academic objectives.
Limitations. In this pilot study, the average level of mutual acceptance among students was considered as an indicator of acceptance, which requires confirmation in further studies. It would also be interesting to compare the obtained data with the results of an analysis of the academic performance of schoolchildren in the studied classes, as was done in earlier research on schools in the Novosibirsk region. All of this could deepen the understanding of the social development context in the inclusive education of schoolchildren with different educational needs.