Introduction
Spatial presence is a key construct in media psychology, referring to the subjective sensation of “being there” in a virtual or media environment (Sheridan, 2016). According to Lombard and Ditton (1997), it can be understood as the perceptual illusion of nonmediation, in which technology and the external physical environment “disappear” or go unnoticed within the user’s phenomenological consciousness. This phenomenon is central to the study of immersive environments and emerges during interactions with television, cinema, radio, computer simulations, and especially virtual reality (VR) and augmented reality (AR) systems (Wirth et al., 2003).
To date, several theoretical models of spatial presence have been developed in the English-language scientific literature (Biocca, 1992; Schubert et al., 2001; Wirth et al., 2003; Sheridan, 2016). Interest in the topic is also growing in Russian-language research, with up to 472 publications appearing between 2020 and 2025 (according to the Russian Science Citation Index, 2025). Nevertheless, there remains a notable lack of psychometrically sound instruments for measuring spatial presence in Russian-speaking populations.
Problem statement. The absence of reliable, culturally adapted psychodiagnostic tools specifically designed to assess spatial presence in Russian-speaking samples.
Study objective. The present study aimed to adapt the MEC Spatial Presence Questionnaire (MEC-SPQ) for Russian-speaking respondents, evaluate its psychometric properties, and establish normative data using experimental manipulations (three groups: baseline VR, distraction, and motivation).
The MEC-SPQ was selected because of its widespread use in recent research (Kahrl et al., 2021; Brink, 2025) and its strong theoretical foundation — the two-level model of spatial presence formation. At the first level, a spatial situation model (SSM) is constructed through attention allocation and visual spatial imagery (VSI). At the second level, spatial presence emerges through the components of self-location and possible actions (Wirth et al., 2003–2007). The model also highlights the importance of cognitive involvement, suspension of disbelief (SoD), and domain-specific interest in the presented content (Martsinkovskaya, Karpuk, 2023). The original instrument has demonstrated high reliability (α > 0.80) and sensitivity to experimental manipulations (Hofer et al., 2012), and it is applicable across various media formats, including cinema, VR, text, and hypertext (Böcking et al., 2004).
To achieve the study objectives, a comprehensive research design was implemented. This included evaluation of the questionnaire’s factor structure and reliability, assessment of its construct and convergent validity, and experimental testing of the scales’ sensitivity to motivation and attention distraction in a VR setting. In line with this framework, the materials, methods, and procedure of the study are described below.
Materials and methods
Sample. The study involved 382 respondents. 62 (16,23%) questionnaires were excluded due to missing data, to ensure greater homogeneity of the sample in terms of age, poor well-being of respondents during the study (totaling 1,7% of the entire sample), and responses from participants who reported having a mental disorder or taking psychoactive medications, since this could affect the phenomenon under study and the success of the experimental situation.
The final sample comprised 320 respondents aged 17 to 56 years (M = 23,48, SD = 8,33; Md = 20). Of these, 279 (87,2%) were women. The majority (209 participants, 65,31%) were first-year students at the Institute of Psychology of the Russian State University for the Humanities (RSUH), while the remainder were students from other disciplines or non-students. With regard to prior VR experience, 56,6% of participants had none, 40,3% had used VR 1–2 times, and 3,1% reported frequent use.
All respondents were randomly assigned to groups before the experiment: Group 1 – Baseline VR with Instruction 1 (Appendix B). N = 91 (M = 2,.74, SD = 8,93; Md = 23; 86,8% women); Group 2 – Motivation: with a modified instruction to increase motivation (Appendix B). N = 106 (M = 22,72, SD = 7,54; Md = 19; 88,7 % women); Group 3 – Distraction: N = 123 with a modified instruction (Appendix B), and with distraction: after 3,5 minutes from the beginning they were asked to remove the headset and perform eye exercises with the operator; M = 21,74; SD = 7,2; Md = 19; 86,18 % women.
Procedure. The study was conducted individually under identical laboratory conditions. The laboratory was equipped with HTC VIVE Pro 2 headsets (resolution 4896×2448, 120 Hz refresh rate, 120° field of view) and HTC Vive Pro Eye headsets (resolution 2880×1600, 90 Hz refresh rate, 110° field of view), along with controllers and base stations. Prior to the session, participants completed preliminary questionnaires via Google Forms. They were then invited to the laboratory and randomly assigned to one of the VR setups in separate rooms. Each headset was calibrated to the participant’s visual characteristics. A brief training program (approximately 5 minutes) was used to familiarize participants with VR interaction. After training, the instructions were read aloud (Appendix B), any questions were answered, and the “VR Museum Tour Grand Collection” application was launched. All participants spent exactly 7 minutes in the virtual environment. In Group 3, a 5-minute break for standardized eye exercises was included after 3,5 minutes. Immediately after the VR session, participants completed the Russian-language version of the Spatial Presence Questionnaire.
Methods. The MEC Spatial Presence Questionnaire (MEC-SPQ; Vorderer et al., 2004) consists of two 8-item scales rated on a 5-point Likert scale: Self-Location (the sensation of one’s location shifting into the media environment) and Possible Actions (the sensation of being able to act within that environment) (see Appendix A).
To verify the applicability of the original theoretical model to the Russian-speaking sample, structural equation modeling (SEM) was employed. Differences between the three groups were analyzed using the Kruskal–Wallis test with Dunn’s post-hoc comparisons. The translation procedure, full text of the two spatial presence scales and six predictors, and the theoretical model are described in detail in Martsinkovskaya and Karpuk (Martsinkovskaya, Karpuk, 2023).
Analysis. Exploratory factor analysis (EFA) and confirmatory factor analysis (CFA) with the diagonally weighted least squares (DWLS) estimator (appropriate for ordinal data) were performed. Reliability was assessed using Cronbach’s α and McDonald’s ω coefficients. Structural equation modeling (SEM) and analysis of variance (ANOVA) were also used. Convergent validity was examined via Spearman’s rank correlation coefficient. Data were collected using Google Forms and analyzed in JASP version 0.19.3.
Ethical aspects. All participants provided informed consent. Data collection was anonymous, and confidentiality was fully ensured.
Results
The Kaiser-Meyer-Olkin measure of sampling adequacy (KMO) and Bartlett’s test of sphericity (χ²) confirm the suitability of the data for EFA and CFA:
For all items, including the 6 predictors: KMO = 0,917, χ² = 11603,774, p < 0,001.
For the spatial presence scales: KMO = 0,934, χ² = 2444,860, p < 0,001.
The results of descriptive statistics are shown in Table 1.
Table 1
Descriptive statistics and reliability of the Spatial Presence Questionnaire for VR (N = 320)
|
Scale name (number of items) |
Item-total correlations |
Cronbach’s α |
SE |
95% CI |
McDonald’s ω |
SE |
95% CI |
|
Self-Location |
0,47 < r < 0,80 |
0,873 |
0,013 |
0,848-0,897 |
0,874 |
0,011 |
0,853-0,895 |
|
Possible Actions |
0,57 < r < 0,72 |
0,858 |
0,014 |
0,831-0,886 |
0,859 |
0,014 |
0,831-0,886 |
|
Overall Spatial Presence |
- |
0,915 |
0,008 |
0,898-0,931 |
0,916 |
0,007 |
0,902-0,929 |
The reliability level of the items of the spatial presence questionnaire is high (α = 0,915; ω = 0,916). Scale reliability: Self-Location — good (α = 0,873; ω = 0,874), Possible Actions — good (α = 0,858; ω = 0,859). Thus, the spatial presence questionnaire demonstrates a good level of reliability for Russian-speaking respondents.
It was initially decided to conduct EFA to confirm the adequacy of the two-factor structure of the spatial presence questionnaire. EFA was performed using the maximum likelihood method with promax oblique rotation.
The EFA confirmed the two-factor structure of the questionnaire (see Table 2). The “Possible Actions” factor is formed by all eight of its own items with loadings ranging from 0,478 to 0,808, the highest of which is for item “4”: 0,808 (Table 2).
For the “Self-Location” factor, it was established that the original scale structure is also generally reproduced, with loadings ranging from 0,300 to 0,944. The highest loading is for item “8”: 0,944 (Table 2). However, items 5 and 9 (Table 2) showed cross-loadings (> 0,30 on both factors).
Item “5” has a cross-loading with a small difference (0,043) and its uniqueness (proportion of unexplained variance) is 0,384. It was decided to retain the item because: 1) the original MEC-SPQ model states that both spatial presence factors are highly correlated (r = 0,76, p < 0,01; Böcking et al., 2004). Such a correlation is strong and significant, therefore the cross-loading is expected rather than artefactual (Nasledov, 2012). 2) The item has high theoretical significance; it was retained in all three versions of the original questionnaire (8-, 6-, and 4-item versions), emphasizing its role in assessing spatial presence. 3) Cultural features of the Russian translation of the question are possible: “being part of” is theoretically an important basis for self-location, but it also implies the possibility of action and the ability to influence what one is part of, which blurs the distinction between the scales while maintaining its importance for the construct (uniqueness 0,384).
Item “9” also has a cross-loading on both factors with a negligible difference (0,024) and a generally low factor loading (0,300), but its uniqueness is 0,673. Therefore, it was decided to conduct an additional CFA without this item. As a result, model quality deteriorated slightly: CFI decreased from 0,942 to 0,941, and RMSEA increased to 0,104. These changes, although minor, indicate that removing the item makes the model worse. Apparently, item 9, despite its low factor loading, adds substantive validity by covering a unique aspect of the construct, as evidenced by its high uniqueness value. A possible cultural feature of the translation: “true location” sounds too philosophical, reducing relevance. Since the factor loading satisfies the inequality |aij| ≥ 0,30, its removal only slightly worsens the model fit indices. In addition, the original MEC-SPQ documentation recommends retaining core items for theoretical coverage. Therefore, the item was retained at the current stage of adaptation. However, its removal is recommended when developing a short version of the instrument.
Table 2
Factor loadings of the Spatial Presence Questionnaire
|
Items of the method (see Appendix A) |
Possible Actions |
Self-Location |
Uniqueness |
|
4. |
0,808 |
-0,266 |
0,570 |
|
15. |
0,784 |
-0,177 |
0,543 |
|
11. |
0,670 |
0,055 |
0,497 |
|
1. |
0,644 |
-0,003 |
0,589 |
|
16. |
0,608 |
0,078 |
0,559 |
|
3. |
0,608 |
0,015 |
0,618 |
|
7. |
0,578 |
0,189 |
0,481 |
|
14. |
0,478 |
0,224 |
0,575 |
|
8. |
-0,301 |
0,944 |
0,406 |
|
2. |
-0,168 |
0,648 |
0,700 |
|
10. |
0,279 |
0,538 |
0,429 |
|
13. |
0,208 |
0,534 |
0,520 |
|
6. |
0,314 |
0,531 |
0,392 |
|
12. |
0,388 |
0,493 |
0,344 |
|
5. |
0,449 |
0,406 |
0,384 |
|
9. |
0,324 |
0,300 |
0,673 |
|
Notes: The rotation method used is promax. The full content of the items is provided in Appendix A. |
|||
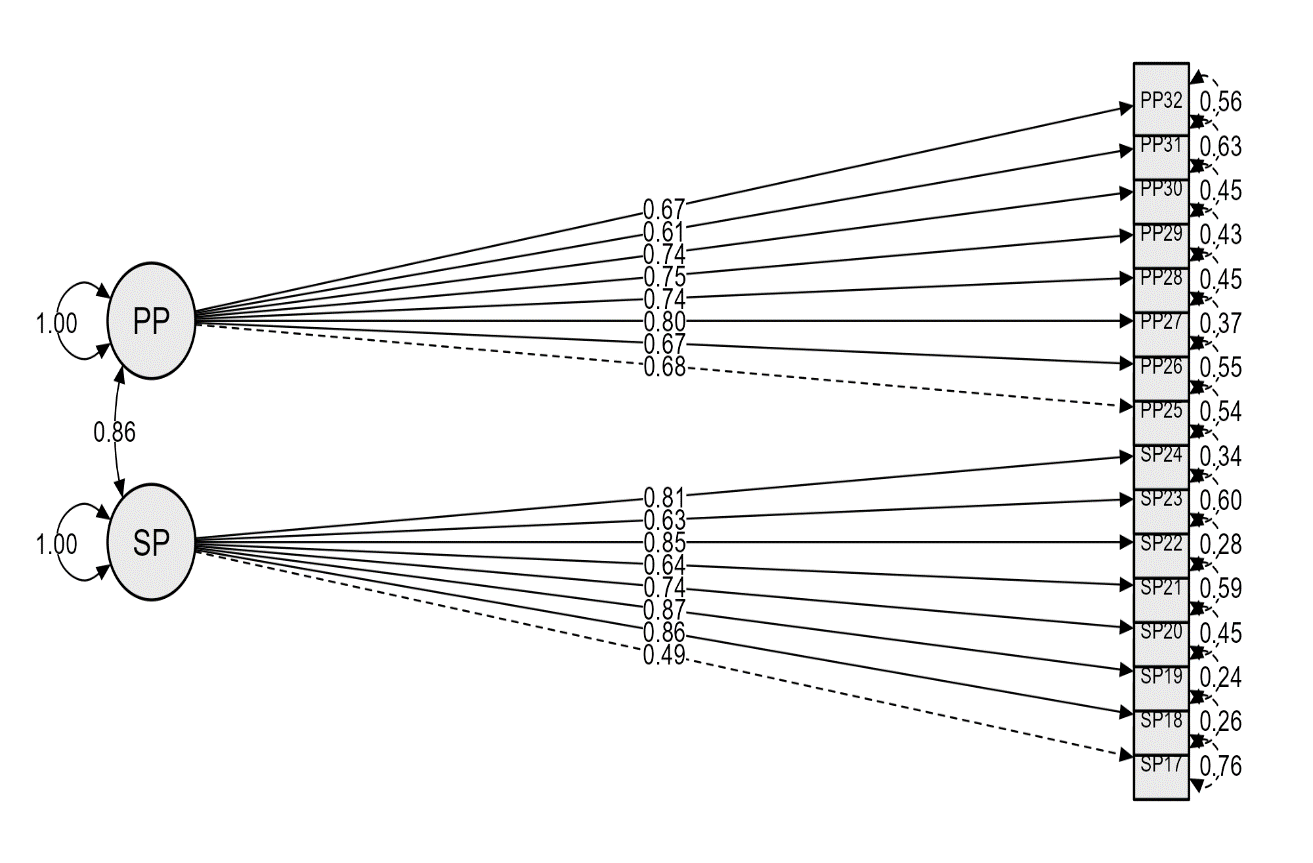
To confirm the factor structure of the adapted MEC-SPQ, a confirmatory factor analysis (CFA) was performed (Fig. 1) using the diagonally weighted least squares (DWLS) estimator, which is appropriate for ordinal data. The model consisted of two correlated latent factors: Self-Location (8 indicators, SP17–SP24) and Possible Actions (8 indicators, PP25–PP32), as specified in the original MEC model (Vorderer et al., 2004). The sample size was N = 320.
Standardized factor loadings ranged from 0,495 to 0,870 for the Self-Location factor (all p < 0,001, Z > 11,4) and from 0,668 to 0,796 for the Possible Actions factor (all p < 0,001, Z > 15,2). These results indicate strong associations between the indicators and their respective latent constructs. Standard errors were low (0,018–0,043), supporting the stability of the estimates. All loadings exceeded the 0,4 threshold. The proportion of explained variance (R²) for the indicators ranged from 0,245 to 0,720, with mean values of 0,560 for Self-Location and 0,502 for Possible Actions.
The model demonstrated acceptable fit to the data: χ² = 431,015, df = 103, p < 0,001; CFI = 0,942; NFI = 0,925; TLI = 0,932. These indices confirm the construct validity of the instrument. The root mean square error of approximation (RMSEA) was 0,100 (90% CI: 0,090–0,110; p < 0,001 for H₀: RMSEA ≤ 0,05), indicating a mediocre but acceptable fit. The standardized root mean square residual (SRMR) was 0,061 (< 0,08), reflecting good absolute fit. Hoelter’s critical N was 159 (α = 0,05) and 174 (α = 0,01), both well below the actual sample size of 320, suggesting that the sample was adequate for testing the model.
Charts
To confirm the correct functioning of the theoretical model on the Russian-speaking sample, the method of structural equation modeling (SEM) was applied. As the main hypothesis, we assumed that the obtained model would function similarly to the original one (Fig. 2), namely: Attention has a positive effect on the spatial situation model (SSM) (β = 0,47, p < 0,001); Visual spatial imagery (VSI) is a positive predictor of SSM (β = 0,24, p < 0,05); SSM is a positive predictor of spatial presence (β = 0,45, p < 0,001); cognitive involvement has a positive effect on spatial presence (β = 0,27, p < 0,05); Domain-specific interest (DSI) has a positive effect on involvement (β = 0,35, p < 0,001); Suspension of disbelief (SoD) has a positive effect on spatial presence (β = 0,24, p < 0,05), including self-location (β = 0,90; p < 0,001) and possible actions (β = 0,72; p < 0,001) (Hofer et al., 2012).
Separately, we note the negative influence of SoD on SSM (β = -0,31, p < 0,05), which was not initially assumed theoretically, but was indicated by modification indices and added to improve model fit: the negative influence of suspension of disbelief on the spatial situation model means that a high level of suspension of disbelief (ignoring contradictions) can reduce the accuracy or quality of the mental model, although it enhances the feeling of presence itself (Hofer et al., 2012).
It is important to note that the presented model (Fig. 2) was obtained from data of a study that used a less immersive environment, without a VR headset — the virtual museum “House of Learning”. Participants were located approximately two meters from the screen and moved through the rooms of the virtual environment using a wireless mouse and keyboard. After the habituation phase, they explored the museum for 10 minutes (Hofer et al., 2012).
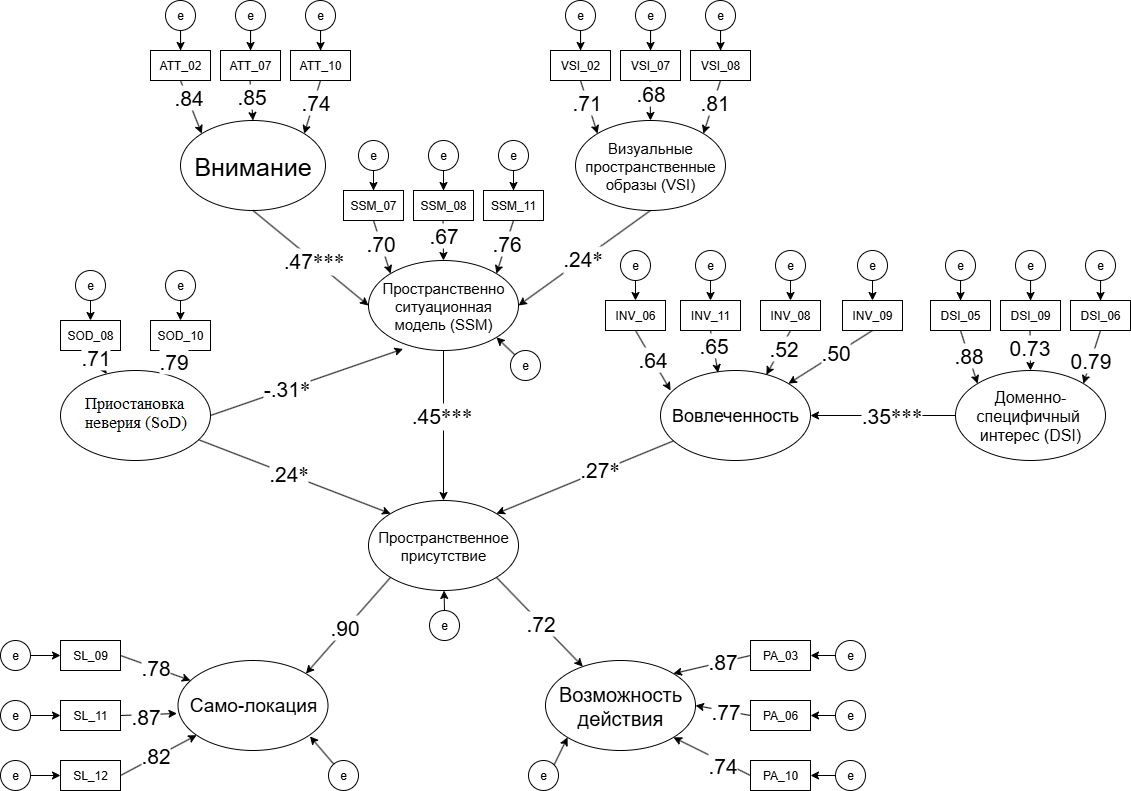
As a result, a similar model was obtained (Fig. 3), but with minor deviations: In the original study, each predictor consisted of 2–3 indicators, although the MEC-SPQ questionnaire itself includes from 4 to 8 indicators per factor, depending on the version of the questionnaire. Since the authors of the original model did not specify the method of item selection for each of the 8 factors, we used data from the previously conducted EFA with variables that had the highest factor loadings. Thus, in the obtained model some indicators differ, but it includes all latent factors as in the original, sample size N=320.
Standardized factor loadings for the indicators ranged from 0,38 to 0,89 (all p < 0,001).
The obtained regression paths are as follows: 1. Attention has a strong influence on SSM (β = 0,83, p < 0,001), compared to the original β = 0,47, p < 0,001; 2. VSI influences SSM (β = 0,22, p < 0,001), slightly less than in the original (β = 0,24, p < 0,05); 3. SSM is a positive predictor of spatial presence (β = 0,63, p < 0,001), compared to the original β = 0,45, p < 0,001; 4. Cognitive involvement has a positive effect on spatial presence (β = 0,42, p < 0,001), stronger than in the original (β = 0,27, p < 0,05); 5. DSI is a positive predictor of involvement (β = 0,53, p < 0,001), compared to the original β = 0,35, p < 0,001; 6. SoD has a positive effect on spatial presence (β = 0,44, p < 0,001), compared to the original β = 0,24, p < 0,05. The negative path from SoD to SSM was also confirmed (β = -0,27, p < 0,01), which is weaker than in the original (β = -0,31, p < 0,05). It should be noted that the overall model fit indices after removing the initially theoretically unjustified path from SoD to SSM deteriorated slightly (Table 3).

Good fit coefficients were obtained for all model fit criteria (Table 3).
Table 3
Fit indices of the SEM model
|
№ |
Criterion |
Value |
|
|
Value for the SEM model with all paths |
Value for the SEM model without the SoD–SSM path |
||
|
1 |
χ² |
596,444 (df = 237, p < 0,001) |
604,075 (df = 238, p < 0,001) |
|
2 |
CFI |
0,942 |
0,941 |
|
3 |
TLI |
0,932 |
0,931 |
|
4 |
NFI |
0,932 |
0,907 |
|
5 |
RFI |
0,908 |
0,892 |
|
6 |
IFI |
0,942 |
0,941 |
|
7 |
RMSEA |
0,069 (90% CI: 0,062–0,076) |
0,069 (90% CI: 0,063–0,076) |
|
8 |
SRMR |
0,070 |
0,071 |
|
9 |
Hoelter's N (α = 0,05) |
162 |
157 |
Due to the lack of Russian-language instruments for measuring spatial presence in immersive environments, convergent validity was examined by correlating the questionnaire scores with a single-item subjective rating of presence. Participants were asked: “On a scale from 1 to 10, rate the degree of your subjective presence in the virtual world during the immersion procedure.” The results showed strong positive correlations: overall spatial presence score (ρ = 0,604, p < 0,001), Self-Location scale (ρ = 0,588, p < 0,001), and Possible Actions scale (ρ = 0,558, p < 0,001). These findings indicate that the questionnaire scores align well with participants’ self-perceived presence while also providing a more nuanced and differentiated assessment.
Criterion validity was tested experimentally by randomizing participants into three groups (see Sample section). Following the original study, it was hypothesized that mean scores on both spatial presence scales would be significantly lower in Group 3 (distraction) than in Group 1 (baseline VR). It was also expected that Group 2 (motivation) would show significantly higher scores on both scales compared with Groups 1 and 3.
Normality of distribution was assessed using the Shapiro–Wilk test. The data were non-normally distributed for the Self-Location scale in Groups 2 and 3, for the Possible Actions scale in Group 3, and for the overall spatial presence score in Group 3. Therefore, the non-parametric Kruskal–Wallis test with Dunn’s post-hoc comparisons was used to analyze group differences.
The statistical analyses and descriptive statistics confirmed partial sensitivity of the scales to the experimental manipulations. For overall spatial presence, Group 1 scored significantly higher than Group 3 by 0,301 points (p = 0,022; in the original study: 0,26, p < 0,01). On the Possible Actions scale, Group 1 also scored significantly higher than Group 3 by 0,554 points (p < 0,001; in the original study: 0,19, non-significant). For the Self-Location scale, the difference between Group 1 and Group 3 was small (0,048) and non-significant (in the original study: 0,33, p < 0,01). All statistically significant differences were identified using Dunn’s post-hoc test.
Table 4. Descriptive statistics of mean scores on the MEC-SPQ scales
|
Scale
|
Group 1 (Baseline VR) n=91 |
Group 2 (Motivation) n=106 |
Group 3 (Distraction) n=123 |
Overall (n=320) |
|
Self-Location |
M = 3,378; SD = 0,776; 25% = 2,875; 50% = 3,438; 75% = 4,000 |
M = 3,514; SD = 0,905; 25% = 3,000; 50% = 3,500; 75% = 4,125 |
M = 3,330; SD = 1,044; 25% = 2,875; 50% = 3,375; 75% = 4,000 |
M = 3,405; SD = 0,929; 25% = 2,875; 50% = 3,438; 75% = 4,000 |
|
Possible Actions
|
M = 3,768; SD = 0,777; 25% = 3,250; 50% = 3,875; 75% = 4,375 |
M = 3,384; SD = 0,835; 25% = 2,875; 50% = 3,375; 75% = 4,000 |
M = 3,214; SD = 0,932; 25% = 2,625; 50% = 3,250; 75% = 3,875 |
M = 3,500; SD = 0,885; 25% = 3,000; 50% = 3,500; 75% = 4,125 |
|
Overall Spatial Presence
|
M = 3,573; SD = 0,687; 25% = 3,063; 50% = 3,656; 75% = 4,031 |
M = 3,449; SD = 0,804; 25% = 2,938; 50% = 3,469; 75% = 4,000 |
M = 3,272; SD = 0,942; 25% = 2,688; 50% = 3,313; 75% = 3.938 |
M = 3,453; SD = 0,907; 25% = 2,938; 50% = 3,469; 75% = 4,063 |
Note: The distribution shows a slight positive skew toward higher scores (skew = -0,362 / -0,490).
Our additional hypothesis that the scales of Self-Location, Possible Actions, and overall spatial presence would have statistically significantly higher values in Group 2 (with the additional task) was not confirmed: no significant differences were found.
It was expected that the additional task with the mini-game would increase spatial presence; however, the descriptive statistics show that the mean score of Group 2 on the Possible Actions scale was lower than the mean score of Group 1 by 0,384, and the overall spatial presence score was lower by 0,124. At the same time, the mean score on the Self-Location scale was higher in Group 2 compared to Group 1 by 0,136. All these differences are statistically non-significant, but indicate a trend: the additional task reduces the sense of possible actions and overall presence, but increases self-location. This effect may be associated with task overload — searching for objects focuses attention on specific actions, thereby reducing the overall sense of presence. However, further investigation is required to confirm this assumption.
Since spatial presence is a psychological state that depends on the specific media environment, context, and moment in time (according to the instructions, the questionnaire is administered immediately after exposure to the stimulus), and not a stable personality characteristic, and since test-retest reliability was not assessed during the development of the original instrument, test-retest reliability was not evaluated in the present study.
Discussion
The results of the present study largely support the main hypothesis. The Russian adaptation of the MEC-SPQ demonstrated strong psychometric properties comparable to the original model, including high reliability, a clear two-factor structure, and successful replication of the process model of spatial presence formation (Vorderer et al., 2004; Wirth et al., 2007; Hofer et al., 2012). The additional hypothesis concerning the instrument’s sensitivity to experimental manipulations was partially confirmed: distraction significantly reduced both overall spatial presence and the sense of possible actions, whereas the motivational instruction did not produce a statistically significant increase in scores.
One possible explanation for the lack of a motivational effect is that the additional task directed participants’ attention toward specific actions (resulting in a 0,384-point decrease on the Possible Actions scale) rather than toward general immersion. Several alternative interpretations of this finding can be proposed. First, a cultural factor may have played a role: Russian participants might have perceived the additional task not as a game but as “work”, thereby reducing their involvement and interest. Second, methodological constraints, such as the relatively short VR session (7 minutes), may have limited the time available for motivation to enhance presence. Moreover, searching for treasure chests in a virtual museum may not have been engaging enough compared to modern commercial video games. Third, the sample primarily consisted of students, whose baseline motivation for participating in the experiment and using VR may have been modest. These interpretations warrant further investigation in future studies.
The reliability coefficients and model fit indices were comparable to those reported in the original studies (see Results section). These findings support the stability of the spatial presence construct in a Russian-speaking context, where validated instruments had previously been unavailable. Both EFA and CFA successfully reproduced the two-factor structure (Self-Location and Possible Actions) with factor loadings above 0,30, consistent with the original model (Vorderer et al., 2004). The cross-loadings observed for items 5 and 9 (Table 2), which were retained to preserve theoretical coverage, may reflect cultural-linguistic nuances in interpretation. Russian-speaking respondents appear to more strongly associate the idea of “being part of the environment” with active participation, which may blur the boundaries between the two subscales.
The SEM results confirmed that the theoretical model functioned well in the Russian sample, showing good fit (CFI = 0,942; RMSEA = 0,069). All regression paths were statistically significant and directionally consistent with the original model, although the β-coefficients were generally stronger. This difference is likely attributable to the use of highly immersive VR headsets rather than desktop simulations. Previous research has shown that immersive technologies tend to strengthen relationships within presence models by enhancing perceptual involvement (presence scores are typically 20–30% higher; Pausch et al., 1997).
Mean scores on the spatial presence scales were notably high (“Possible Actions” M = 3,42; “Self-Location” M = 3,40; Table 1) compared with the original study (“Possible Actions” M = 2,32; “Self-Location” M = 2,38; Vorderer et al., 2004). This pattern aligns with findings from the development of the short version of the MEC-SPQ (Hartmann et al., 2015), in which lower and more negatively skewed scores were attributed to the use of low-immersive stimuli (books and non-interactive films). Given that the current study employed highly immersive VR stimuli, the higher scores and stronger predictor effects observed here are theoretically expected.
The negative path from SoD to SSM (β = −0,27), although weaker than in the original study (β = −0,31), supports the idea that ignoring inconsistencies between virtual and real environments may reduce the precision of the mental model while simultaneously enhancing subjective presence. This pattern can be conceptualized as a trade-off between cognitive processing and emotional immersion (Wirth et al., 2007).
Convergent validity was supported by strong correlations with subjective presence ratings (ρ = 0,58–0,63), consistent with previous findings (Böcking et al., 2004). Criterion validity was evidenced by the scales’ sensitivity to distraction, with reductions in presence ranging from 0,301 to 0,554 points — comparable in magnitude to the original effects (0,19–0,33), which were attributed to disrupted attention (Hofer et al., 2012). However, the motivational condition did not yield the expected increase, showing only a non-significant trend (+0,264 for Self-Location and −0,384 for Possible Actions). This suggests that in highly immersive settings, additional tasks may have a dual effect: enhancing self-location while potentially fragmenting the overall experience through cognitive overload. Such findings help refine the MEC model by highlighting context-specific effects of motivation in VR environments (Makransky et al., 2019).
Conclusions
The findings of this study allow us to conceptualize spatial presence as a stable psychological construct within the Russian-speaking cultural context. They confirm its universality while highlighting the importance of cultural and technological modifiers. Differences in the strength of β-coefficients underscore the need to account for the level of immersiveness in future theoretical models. The adapted Russian-language version of the MEC-SPQ represents a reliable and valid tool for measuring spatial presence and is well suited for use in media psychology research. Further validation on more heterogeneous samples and with a wider range of stimuli (e.g., books and non-interactive films), as well as the development of a short form for practical applications (similar to the SPES; Hartmann et al., 2015), is recommended. The integration of objective measures, such as eye-tracking and electroencephalography (EEG), is also advised to strengthen the instrument’s validity.
The results have practical implications for media psychology, education, and therapy. They can inform the optimization of VR interfaces and the enhancement of user engagement, thereby advancing VR research in Russia. Future directions include adapting the questionnaire for other media environments (e.g., games and films), conducting replications with diverse samples, and examining cultural effects in greater depth.
The construct of spatial presence is particularly important because it directly influences the effectiveness of immersive technologies in education, psychological therapy, and entertainment. The present findings also support interdisciplinary applications: in IT — for optimizing VR interfaces and reducing cognitive load; in medicine — for developing culturally sensitive VR-based phobia treatments; and in education — for designing gamified learning experiences that enhance engagement while avoiding cognitive overload. Researchers and practitioners working on VR projects in psychology and education can draw on these data for culturally localized implementations. Overall, this study contributes to cross-cultural research and strengthens the global body of knowledge in media psychology.
Limitations. Despite these promising results, several limitations should be acknowledged. First, the sample (N = 320) consisted predominantly of first-year psychology students from RSUH (65,31%), with a large majority of women (87,2%) and relatively young participants (M = 23,48, SD = 8,33). This composition limits the generalizability of the findings to broader demographic groups, including older adults, men, and individuals from non-student or non-psychological backgrounds, where prior VR experience may differ substantially (56,6% of the sample had no or minimal VR experience). Although there is no theoretical reason to expect major differences across Russian regions, the limited demographic diversity reduces the representativeness of the adaptation for the entire Russian-speaking population.
Second, the data were collected under controlled laboratory conditions using specific high-end VR devices (HTC VIVE Pro 2 and HTC Vive Pro Eye). Consequently, the results may not fully generalize to other immersive setups, such as mobile VR systems or lower-specification platforms. Additional studies are needed to examine the questionnaire’s performance across a wider range of devices and real-world contexts.
Finally, because no Russian-language measures of spatial presence were available, full convergent validity could not be assessed through comparison with established instruments. In addition, test-retest reliability was not evaluated, consistent with the original MEC-SPQ development and the state-like nature of the construct.