Introduction
To date, there is no single definition of the concept of “human resilience” that is universally accepted by all researchers of this phenomenon. Most often, the term is associated with a person's ability to overcome adversity and continue their normal development. Resilience is a multidimensional theoretical construct, according to which individuals, facing the adverse impact of complex sociocultural factors that threaten their well-being, acquire experience in coping with them. Consequently, while conceptualizing the concept of “human resilience,” researchers have begun to turn to the study of psychological, socio-psychological, and sociocultural resources that form an individual's resilience and strengthen their overall psychological well-being. Traditionally, the following factors of human resilience are identified: individual characteristics (Laktionova, 2025; Handbook of Resilience in Children, 2023); support from family and friends (Nikitina, 2023; Odintsova et al., 2023; Kharlamenkova et al., 2024; Eagle, Sheridan, 2023); context and culture (Baeva et al., 2023; Odintsova et al., 2023; Postylyakova, 2024; Nagpal, Radliff, 2024; Renbarger et al., 2020; Smrke et al., 2025; Ungar et al., 2008). It has been shown that an individual's immersion in the broad cultural context of their people is a protective factor and strengthens their resilience (Makhnach et al., 2024; Collado-Soler et al., 2023). Many researchers also consider religious beliefs and practices to be resilience factors that help people reframe difficult situations (Makhnach et al., 2024). For instance, a study by I.A. Baeva and colleagues showed that “the ability to use social resources, seek support and reinforcement in cultural works, religious practices, existing folk and cultural traditions contributes to the psychological adaptation of students” (Baeva et al., 2023, p. 14).
In line with this understanding of resilience, a group of experts developed the “Child and Youth Resilience Measure” (CYRM-28), which is based on U. Bronfenbrenner's ecological model of development (Bronfenbrenner, 1979). According to this model, a person is viewed as an open system influenced by surrounding systems (family, society, school, work, etc.). The measure includes three scales: “Individual Сharacteristics” – assesses an individual's resilience resources; “Family Support” – the respondent's perception of physical and psychological family support; “Context” – social resources of an individual's resilience. The sum of the scores on these three scales constitutes the measure's integral indicator – “Total Resilience Score”.
Adaptation and validation of the Child and Youth Resilience Measure worldwide
The creation and validation of the Child and Youth Resilience Measure has a 20-year history. The first version of the measure was developed between 2002 and 2005 by a group of scientists from 14 research institutions across 11 countries on 5 continents, who united to study the phenomenology of resilience and develop a measure assessing culturally determined factors of positive development in children and youth facing adversity. During the work on the international project “Methodological and Contextual Challenges in Child and Adolescent Resilience Research: An International Collaboration to Develop a Measure of Health among At-Risk Children and Adolescents” (Ungar et al., 2008), the first version of the CYRM, consisting of 58 items, was created. Psychometric testing showed that it provides a reliable measurement of individual and socio-personal characteristics determining the resilience of children and youth living in different social and cultural contexts, attributed to both Western and non-Western cultures (Ungar et al., 2008).
Russia was represented in the project to develop the CYRM by the authors of this article. After the creation of the English version of the measure, its cross-cultural adaptation began. For this purpose, we engaged five experts – specialists in developmental and social psychology. In selecting the experts, we followed the requirements of the International Test Commission (2017).
At the initial stage of validation, the experts analyzed and discussed the measure's items. Based on their comments, changes were made to the final version of the measure. After several years of using the measure, the content of some items was reviewed and the measure was shortened to 28 items (Liebenberg et al., 2012), with its validity tested on several national samples. Furthermore, the resulting three-factor model demonstrates statistically significant differences (p < 0,001) between comparison groups (Ungar et al., 2008). Consequently, a quantitative tool for assessing child and youth resilience was developed, which is one of the few that has undergone cross-cultural validation (Renbarger et al., 2020; Wood et al., 2020).
Over the years, adaptation and validation of this measure have been conducted in many countries. The main conclusion regarding the use of the CYRM to study the resilience of children and youth living in different countries and socio-economic conditions is as follows: the reliability and validity of the three-factor structure of the original scale are confirmed on respondent samples from Canada (Liebenberg et al., 2012), Nicaragua (Stumpf, Chang, 2021), Peru (Bullock et al., 2021), India (Singh et al., 2022), Iran (Aghebati et al., 2023), and Spain (Artuch-Garde et al., 2022).
However, some studies on national samples have noted differences in the obtained factor structures from the original. For example, a psychometric study of the CYRM-28 in New Zealand showed that a four-factor model explains the empirical data better than the original three-factor model (Sanders et al., 2017). The original factor structure was also not fully replicated on Australian (Langham et al., 2018) and Spanish data (Llistosella et al., 2019). Several studies have reported differences in the number of items within a three-factor solution. For instance, in the Iranian version of the measure, despite its confirmed three-factor structure, only 11 items were informative, and the rest were excluded (Kazerooni Zand et al., 2017); a 24-item measure better fit the resilience structure of South African youth (Govender et al., 2017). Another Spanish study, using confirmatory factor analysis (CFA), also confirmed the three factors of the original CYRM-28, with high reliability values for the scales: “Family Support” – 0,79, “Context” – 0,72, “Individual Characteristics” – 0,78. However, 4 items were excluded from the original measure, 5 items with very low factor loadings were reworded, and 6 items were added, resulting in a 32-item scale (Llistosella et al., 2019). A systematic review of CYRM psychometric studies and multilevel confirmatory factor analysis of data (n = 6232) from 6 countries (Ghana, Costa Rica, Russia, USA, Czech Republic, South Africa) showed significant variability in the contextual applicability of the CYRM, indicating difficulties in comparing resilience among children and adolescents living in different conditions. Normative data for the measure's scales, depending on age and gender of adolescents, were also obtained from the cohort sample (Renbarger et al., 2020).
Thus, the validation of the CYRM-28 conducted in several countries shows that the identified differences in the structure and number of items require further research. Despite ongoing work on validating the measure on national samples, it remains the most frequently used tool in cross-cultural studies of child and youth resilience.
Organization and methods of the study
In Russia, the use of the Child and Youth Resilience Measure (CYRM) began for research purposes in our works (Laktionova, Makhnach, 2007), as well as in the works of other authors (Guseva, 2018; Rylskaya, 2008).
Procedure. During the adaptation and validation of the CYRM on the Russian sample, adhering to the standard procedure of forward and backward translation, the following sequence of actions was implemented.
- Linguistic adaptation of the measure. This stage involved translating and adjusting the vocabulary and grammar of the measure to the age and educational characteristics of the sample, considering the connotative meaning of linguistic units and categories. Therefore, the sociocultural features of the Russian language were considered, and equivalents for concepts and definitions accepted in Russian culture were sought. Translation and linguistic adaptation were carried out by university English language instructors and professional translators proficient in English. They were asked to answer the measure's questions in English – one month after completing the Russian version of the measure. During testing, respondents in this group were asked to mark items in the Russian version that were inaccurate or did not align well with our sociocultural reality. After comparing expert assessments of the correspondence of the Russian translation to the original, we made changes to the Russian translation of the measure.
- The test-retest reliability procedure and comparison of the two versions (Russian and English) were conducted based on the testing results of a sample of 24 individuals. Re-testing using the measure was carried out five months after the first test.
- Convergent validity of the measure was assessed based on data from a sample of 232 individuals. They were asked to answer the measure's questions and then complete the Social-Psychological Adjustment Scale by C. Rogers and R. Diamond (adapted by T.V. Snegireva, version by A.M. Prikhozhan) (Tolstykh, Prikhozhan, 2017).
- Verification or re-standardization of test norms. In accordance with test reliability requirements, the following were calculated: arithmetic mean, standard deviation, skewness, and kurtosis; normality of distribution was checked; the stability of the obtained distribution of test scores to sample splitting was checked. The obtained evidence of data distribution stability serves as proof of the representativeness of the test norms.
Analytical strategy. Structural (factorial) validity of the measure was tested using confirmatory factor analysis (CFA). Given that responses to questions were provided using an ordinal scale (Likert), a CFA method designed for ordinal scales and applicable to non-parametric data distribution was used. The diagonally weighted least squares (DWLS) method, which accounts for this data characteristic, was used, applying adjusted estimates of standard errors and fit indices. Model fit was assessed using the following coefficients and criteria: Root Mean Square Error of Approximation (RMSEA – model is considered good if RMSEA < 0,080), Comparative Fit Index (CFI), and Tucker-Lewis Index (TLI – values > 0,900 are considered good) (Hu, Bentler, 1999). Scale reliability was assessed using Cronbach's α coefficient, with values corresponding to good internal consistency indicators.
Comparison of scale scores between men and women was performed using Student's t-test with Welch's correction for unequal variances. The correlation of scale scores with age was assessed using Pearson's correlation coefficient.
Test-retest reliability and comparison of the two versions (Russian and English) of the measure were conducted considering small sample sizes using nonparametric statistics – Spearman's rank correlation coefficient.
Statistical analysis was performed in RStudio (version 2024.09.0) using functions from the `psych` package (version 2.4.6.26) (Revelle, 2024); `R package` (version 2.4.12), `tidyverse` (version 2.0.0) (Wickham et al., 2019); `lavaan` (version 0.6.19) (Rosseel, 2019), as well as functions from the R standard library (version 4.3.3).
Participants. The total sample consisted of young people (n = 1707) aged 13–21 years (mean age – 18,62 years, SD – 2,05). Among them were 834 males (mean – 18,31 years, SD – 2,04) and 873 females (mean – 18,90 years, SD – 2,02). During the test-retest reliability procedure, the group consisted of 24 individuals (mean – 20,25 years, SD – 1,59).
Results
To assess the reliability (internal consistency) of the scales on the empirical sample, Cronbach's α coefficient was calculated. The results are presented in Table 1 (Sample 1). This table also presents the test's reliability data according to Cronbach's α coefficient for samples from South Africa (Govender et al., 2017), Canada (Daigneault et al., 2013), Spain (Llistosella et al., 2019), and Iran (Kazerooni Zand et al., 2017).
Table 1
Values of the reliability coefficients of the α-Cronbach's alpha of the CYRM scales in the samples: 1. Russian sample (n = 1707); 2. Govender et al., 2017 (n = 1854, South Africa); 3. Daigneault et al., 2017 (n = 589, Canada); 4. Llistosella et al., 2019 (n = 432, Spain); 5. Kazerooni Zand et al., 2017 (n = 353, Iran)
|
Шкалы / Scales |
1 выборка / 1 sample |
2 выборка / 2 sample |
3 выборка / 3 sample |
4 выборка / 4 sample |
5 выборка / 5 sample |
|
Индивидуальные характеристики / Individual Characteristics |
0,837 |
0,82 |
0,84 |
0,78 |
0,82 |
|
Семейная поддержка / Family Support |
0,847 |
0,71 |
0,78 |
0,79 |
0,70 |
|
Контекст / Context |
0,745 |
0,70 |
0,64 |
0,72 |
0,72 |
Comparing the Cronbach's α reliability coefficients across the samples in Table 1, we note that the question of what constitutes an acceptable level of reliability-consistency remains unresolved. Currently, the most common convention is that internal consistency from 0,5 to 0,6 is considered poor, from 0,6 to 0,7 is questionable, from 0,7 to 0,8 is acceptable, and above 0,8 is good reliability. Thus, the "Individual Characteristics" and "Family Support" scales prove to be quite reliable, while the reliability of the "Context" scale is somewhat reduced but still quite good. The reliability coefficient of the latter scale in other samples mentioned in the table is also reduced, yet it still demonstrates sufficient consistency of scale items: between 0,7 and 0,8.
When comparing the scale scores of the CYRM across gender groups in the total sample (n = 1707), no statistically significant differences were found (see Table 2).
Table 2
Values of the indicators for the CYRM scales in groups: boys (n = 834) and girls (n = 873); m ± SD
|
Шкала / Scale |
Юноши / Boys |
Девушки / Girls |
Результаты сравнения (t-критерий) / Comparison results (t-test) |
|
Индивидуальные характеристики / Individual Characteristics |
4,054 (0,615) |
4,042 (0,609) |
t(1699) = 0,407, p = 0,684 |
|
Семейная поддержка / Family Support |
3,908 (0,812) |
3,874 (0,846) |
t(1704,9) = 0,843, p = 0,399 |
|
Контекст / Context |
3,529 (0,641) |
3,521 (0,622) |
t(1695,5) = 0,248, p = 0,804 |
The correlations between age and the scores on the test scales are low, but they are significant for the "Family Support" and "Context" scales, which can be explained by the large sample size (see Table 3).
Table 3. Correlations between the indicator "age" and the CYRM scales
|
Шкала / Scales |
r |
P |
|
Индивидуальные характеристики / Individual Characteristics |
–0,007 |
0,758 |
|
Семейная поддержка / Family Support |
0,067 |
0,006 |
|
Контекст / Context |
–0,079 |
0,001 |
To assess the structural validity of the measure, a confirmatory factor analysis (CFA) was conducted. The model specified three factors, corresponding to the three scales, which loaded onto the respective items. The model also included possible correlations between factors. The DWLS estimation method was used; the model fit indices were quite good, although a somewhat high RMSEA coefficient can be noted: χ²(342) = 4076, RMSEA = 0,080, CFI = 0,967, TLI = 0,963, which are entirely acceptable estimates for the model. The factor structure is depicted in Figure 1.
Given the obtained RMSEA value, additional error covariances were included in the model for the following item pairs: 10-28; 22-9; 26-27; 5-6; 14-18. These items, belonging to different scales – for example, No. 26 ("I like my family's cultural and family traditions," Family Support scale) and No. 27 ("I like my community's traditions," Context scale) – may be similar in form but differ in content. Conversely, items No. 5 ("My family cares for me throughout my life") and No. 6 ("My family knows almost everything about me") belong to the same scale (Family Support) but have different content. This correlation of items beyond the factors was done because they are linked both by a common theme and by similarity in wording. The factor structure of the resulting model is shown in the figure.
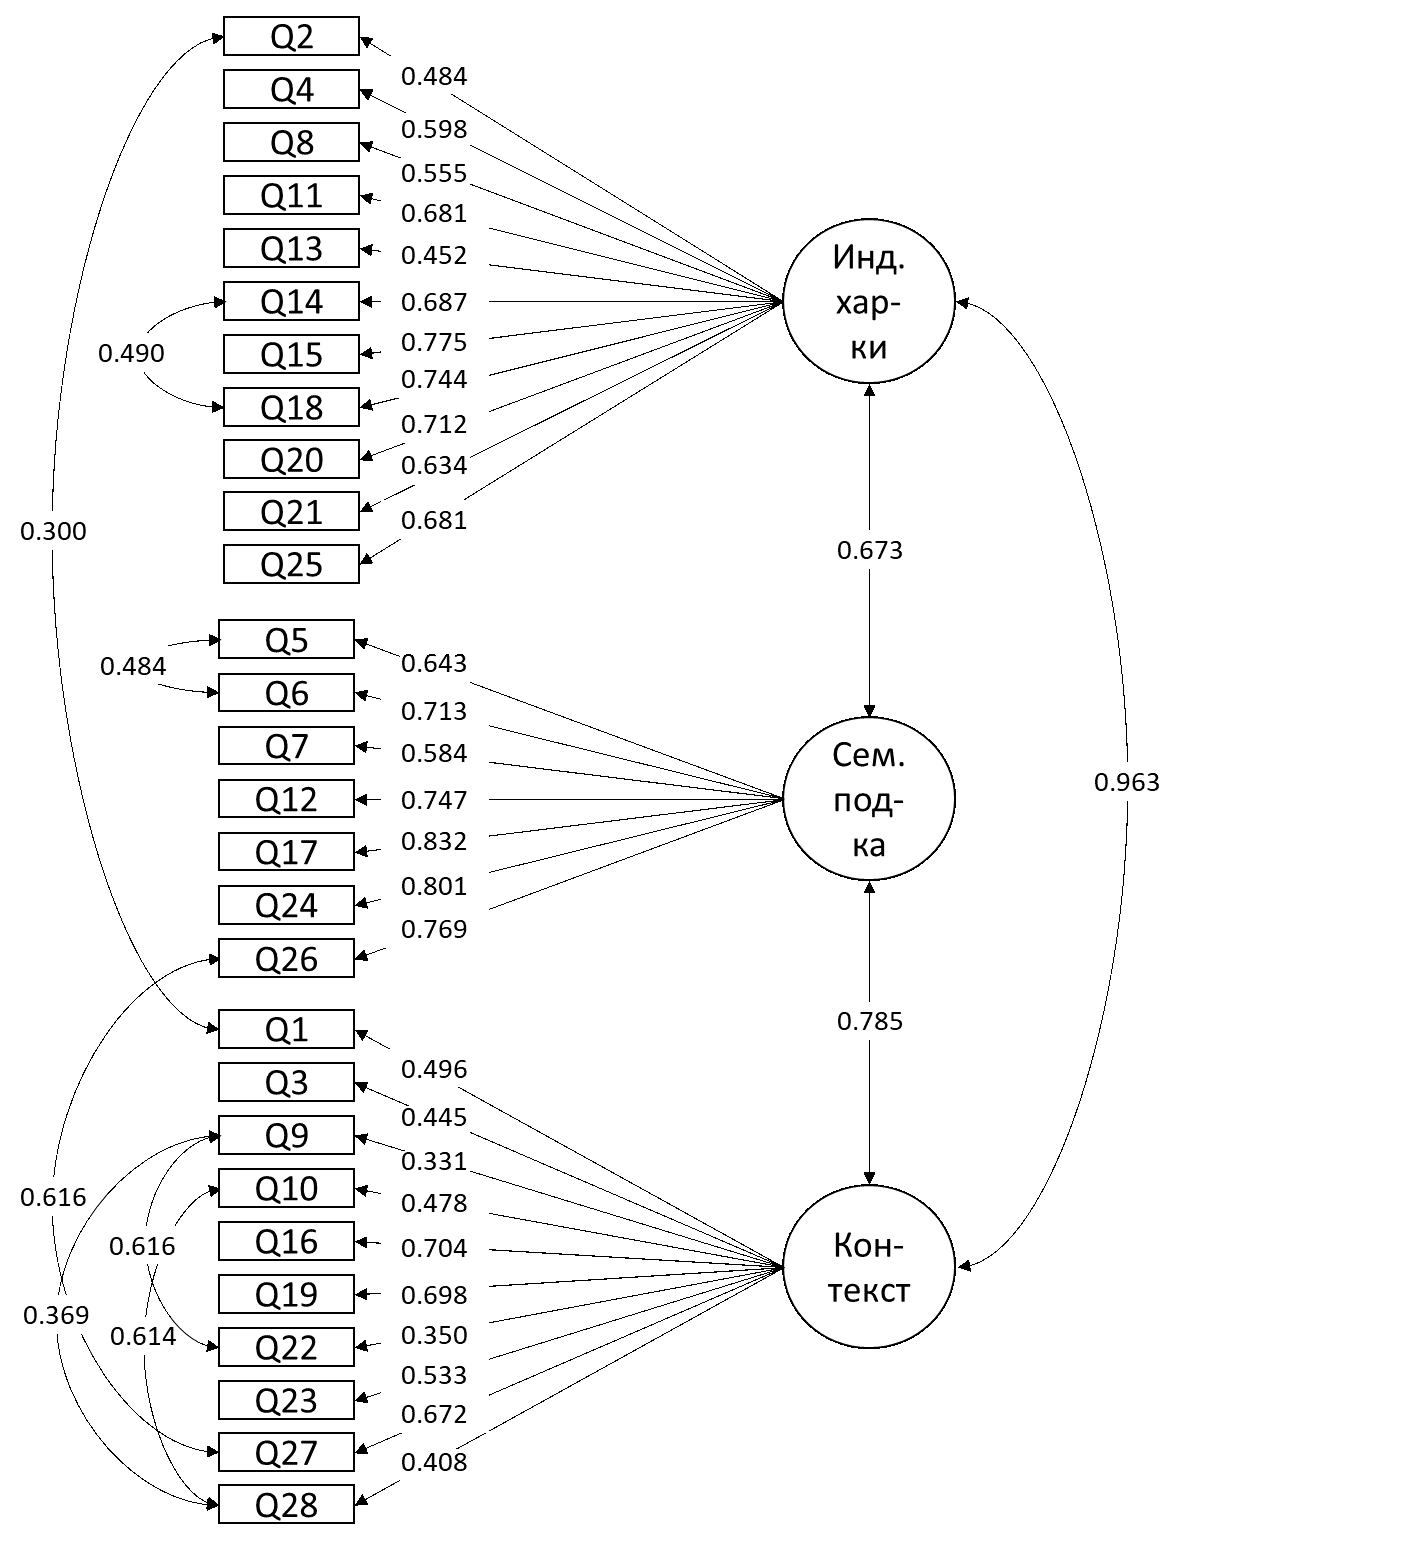
The correlations between the factors in the model are quite high: "Individual Characteristics" – "Family Support": r = 0,673, "Individual Characteristics" – "Context": r = 0,963, "Family Support" – "Context": r = 0,785. This indicates that the scales may be poorly differentiated; however, the aim of the study was to demonstrate the possibility of retaining the original structure of the questionnaire, which is why the three-factor model was tested and proved to be consistent with the original. The two-factor model is not published in the article but showed nearly identical fit indices: χ²(342) = 3882, RMSEA = 0,078, CFI = 0,969, TLI = 0,965. Based on the results, both models fit the data approximately equally well. The three-factor model was chosen, first, because it aligns with the original structure of the measure, and second, because the empirical correlations between the scales are not as high as those in the model (Table 4), a point also noted by Dutch researchers (Jonkman et al., 2022).
Table 4
Values of the indicators for the scales of the CYRM; Pearson correlation coefficient (n = 1707)
|
Шкала / Scale |
Индивидуальные характеристики / Individual Characteristics |
Семейная поддержка / Family Support |
Контекст / Context |
|
Индивидуальные характеристики / Individual Characteristics |
|
|
|
|
Семейная поддержка / Family Support |
0,57 |
|
|
|
Контекст / Context |
0,67 |
0,58 |
|
Note. All coefficients are significant at the p < 0,001.
The error correlations added to the model improved it and were as follows: for item pair 10-28, the coefficient was 0,614; for 9-22 – 0,616; for 26-27 – 0,616; for 5-6 – 0,484; for 14-18 – 0,49; for 9-28 – 0,369; for 2-1 – 0,300.
Comparison of the two language versions of the test
To assess the consistency between the Russian and English versions of the test, the results of 24 respondents were used, each of whom completed both the Russian and English versions of the test.
The analysis showed fairly high consistency of total scores across all scales. For the "Individual Characteristics" scale, the correlation coefficient was r = 0,777; for the "Family Support" scale – r = 0,869; for the "Context" scale – r = 0,845; and for the "Total scale" – r = 0,781 (in all cases, correlations were significant at p < 0,001).
Test-retest reliability
To check the test-retest reliability of the CYRM, the results of the test completed by respondents with a five-month interval were compared. Twenty-four individuals participated in this part of the study. Given the small sample size, the consistency of results across the test scales was assessed using the nonparametric Spearman's rank correlation coefficient.
The analysis showed fairly high consistency of total scores across all scales in the two measurements: "Individual Characteristics" (r = 0,789; p = 0,011), "Family Support" (r = 0,848; p = 0,004), "Context" (r = 0,950; p < 0,001), and "Total scale" (r = 0,883; p = 0,002). Thus, the test demonstrated high test-retest reliability (Spearman's r ranging from 0,789 to 0,950).
Convergent validity
The convergent validity of the CYRM was tested by analyzing the correlations between the test scales and scales from other tests validated on Russian samples that assess ontologically related concepts. In particular, indicators measuring resilience are positively associated with several indicators of the Social-Psychological Adjustment Scale by C. Rogers and R. Diamond (Tolstykh, Prikhozhan, 2017). Given the nonparametric distribution of the scales, Spearman's rank correlation coefficient was used in the analysis (see Table 5).
Table 5
Correlations between the scales of the CYRM (1) and the “Social-Psychological Adjustment Scale” by K. Rogers, R. Diamond (2)
|
1 2 |
ЖИ / IR |
ЖС / FR |
ЖК / CR |
ЖО /GR |
|
КоэфСПА / CoefSPA |
0,745** |
0,677** |
0,668** |
0,780** |
|
КоэфСПДА / CoefSPM |
–0,590** |
–0,537** |
–0,504** |
–0,611** |
|
ПС / SA |
0,632** |
0,586** |
0,577** |
0,665** |
|
НС / SR |
–0,544** |
–0,500** |
–0,485** |
–0,569** |
|
ПД / AO |
0,525** |
0,422** |
0,490** |
0,549** |
|
КД / CwO |
–0,371** |
–0,299** |
–0,334** |
–0,383** |
|
ВнутрЛК / ILC |
0,598** |
0,529** |
0,513** |
0,612** |
|
ВнешЛК / ELC |
–0,442** |
–0,385** |
–0,345** |
–0,441** |
|
ЭК / EC |
0,622** |
0,568** |
0,575** |
0,665** |
|
ЭД / ED |
–0,520** |
–0,463** |
–0,458** |
–0,535** |
|
Д / Dom |
0,427** |
0,442** |
0,363** |
0,457** |
|
З / Dep |
–0,279** |
–0,335** |
–0,236** |
–0,309** |
|
УРП / APS |
–0,369** |
–0,305** |
–0,283** |
–0,362** |
Note: ** – Correlations are significant at the p < 0,001. Scales legend: CoefSPA – Coefficient of Social and Psychological Adaptation; CoefSPM – Coefficient of Social and Psychological Maladaptation; SA – Self-Acceptance; SR – Self-Rejection; AO – Acceptance of Others; CwO – Conflict with Others; IntrLC – Internal Locus of Control; ExtrLC – External Locus of Control; EC – Emotional Comfort; ED – Emotional Discomfort; D – Dominance; D – Dependence; APS – Aversion to Problem Solving; IR – Individual Resilience; FR – Family Resilience; CR– Contextual Resilience; GR – General Resilience.
Given the fairly large sample size (n = 232), it is worth noting not only the high significance of the correlations but also the absolute values of the correlation coefficients. Thus, we see strong correlations between all resilience indicators and the "Social-Psychological Adjustment Coefficient". Strong correlations are also observed between the "Individual Resilience" indicator and "Self-Acceptance" (0,632), "Emotional Comfort" (0,622); between the "Total Resilience" indicator and "Self-Acceptance" (0,665), "Internal Locus of Control" (0,61), "Emotional Comfort" (0,665). This aligns with a number of studies showing that positive self-esteem, internal locus of control, and a level of emotional regulation that reduces emotional tension are protective factors of human resilience associated with social adaptation (Laktionova, 2025; Collado-Soler et al., 2023; Handbook of Resilience in Children, 2023).
Conclusions
The Russian-language version of the CYRM ("Child and Youth Resilience Measure"), adapted on a cohort sample, has good psychometric properties and can be recommended for assessing resilience in adolescence and young adulthood (ages 13–21). Future research perspectives include continuing psychometric procedures, working on a shortened version of the measure (CYRM-12), as well as studying the resilience of adolescents and young people in different regions of Russia belonging to different social groups.
The CYRM adapted for the Russian sample will help Russian researchers compare their results with data obtained in other cultures. Given that we live in a multicultural and multilingual society, test adaptation and cross-cultural comparisons of data obtained using these tests represent a relevant scientific task.